
 Login Sign Up


| |||||
 |  | ||||

| 12Stocks.com Market Intelligence |
Best Financial Stocks
| In a hurry? Financial Stocks Lists: Performance Trends Table, Stock Charts
Sort Financial stocks: Daily, Weekly, Year-to-Date, Market Cap & Trends. Filter Financial stocks list by size:All Financial Large Mid-Range Small & MicroCap |
| 12Stocks.com Financial Stocks Performances & Trends Daily | |||||||||
|
|  The overall Smart Investing & Trading Score is 78 (0-bearish to 100-bullish) which puts Financial sector in short term neutral to bullish trend. The Smart Investing & Trading Score from previous trading session is 46 and hence an improvement of trend.
| ||||||||
Here are the Smart Investing & Trading Scores of the most requested Financial stocks at 12Stocks.com (click stock name for detailed review):
|


| 12Stocks.com: Investing in Financial sector with Stocks | |
|
The following table helps investors and traders sort through current performance and trends (as measured by Smart Investing & Trading Score) of various
stocks in the Financial sector. Quick View: Move mouse or cursor over stock symbol (ticker) to view short-term Technical chart and over stock name to view long term chart. Click on  to add stock symbol to your watchlist and to add stock symbol to your watchlist and  to view watchlist. Click on any ticker or stock name for detailed market intelligence report for that stock. to view watchlist. Click on any ticker or stock name for detailed market intelligence report for that stock. |
12Stocks.com Performance of Stocks in Financial Sector
| Ticker | Stock Name | Watchlist | Category | Recent Price | Smart Investing & Trading Score | Change % | Weekly Change% |
| WF | Woori |   | Foreign Banks | 31.11 | 0 | -0.13% | -3.39% |
| SVC | Service Properties | | REIT | 5.38 | 27 | 0.56% | -3.41% |
| AIV | Apartment | | REIT | 7.89 | 53 | 1.68% | -3.43% |
| BBDO | Banco Bradesco | | Foreign Banks | 2.22 | 10 | -1.33% | -3.48% |
| CASH | Meta | | S&L | 53.31 | 86 | 0.28% | -3.51% |
| WFH | Direxion Work | | Exchange Traded Fund | 52.85 | 8 | -0.52% | -3.51% |
| AEF | Aberdeen Emerging | | Asset Mgmt | 5.14 | 51 | -1.91% | -3.56% |
| CG | Carlyle | | Asset Mgmt | 42.96 | 40 | 0.82% | -3.57% |
| AEG | Aegon N.V | | Life Insurance | 6.46 | 58 | 0.78% | -3.58% |
| EFX | Equifax | | Credit Services | 231.39 | 32 | 0.78% | -3.60% |
| INBK | First Internet | | Regional Banks | 29.46 | 32 | 1.62% | -3.79% |
| WDH | Waterdrop | | Insurance - | 1.38 | 76 | 0.73% | -3.83% |
| WHG | Westwood | | Asset Mgmt | 12.14 | 28 | -2.33% | -3.88% |
| VCTR | Victory Capital | | Asset Mgmt | 52.03 | 65 | -0.46% | -3.92% |
| AFCG | AFC Gamma | | REIT - Specialty | 11.75 | 46 | 1.03% | -3.92% |
| ARES | Ares Management | | Asset Mgmt | 140.17 | 53 | -1.97% | -4.00% |
| PFS | Provident | | S&L | 14.40 | 20 | 0.63% | -4.06% |
| IFN | India Fund | | Asset Mgmt | 17.27 | 10 | -1.31% | -4.06% |
| EVBN | Evans Bancorp | | Regional Banks | 26.46 | 50 | 2.12% | -4.13% |
| GGT | Gabelli Multimedia | | Closed-End Fund - Equity | 5.59 | 35 | 0.54% | -4.28% |
| BBU | Brookfield Business | | Real Estatet | 18.08 | 0 | -0.22% | -4.29% |
| MPV | Barings Participation | | Closed-End Fund - Debt | 15.33 | 38 | -3.37% | -4.31% |
| VIRT | Virtu | | Brokerage | 22.00 | 44 | -4.43% | -4.43% |
| OZKAP | Bank OZK | | Banks - Regional | 15.70 | 17 | 0.90% | -4.56% |
| TREE | LendingTree | | Mortgage | 42.99 | 38 | -3.39% | -4.59% |
| For chart view version of above stock list: Chart View ➞ 0 - 25 , 25 - 50 , 50 - 75 , 75 - 100 , 100 - 125 , 125 - 150 , 150 - 175 , 175 - 200 , 200 - 225 , 225 - 250 , 250 - 275 , 275 - 300 , 300 - 325 , 325 - 350 , 350 - 375 , 375 - 400 , 400 - 425 , 425 - 450 , 450 - 475 , 475 - 500 , 500 - 525 , 525 - 550 , 550 - 575 , 575 - 600 , 600 - 625 , 625 - 650 , 650 - 675 , 675 - 700 , 700 - 725 , 725 - 750 , 750 - 775 , 775 - 800 , 800 - 825 , 825 - 850 , 850 - 875 , 875 - 900 , 900 - 925 , 925 - 950 , 950 - 975 , 975 - 1000 , 1000 - 1025 , 1025 - 1050 , 1050 - 1075 , 1075 - 1100 , 1100 - 1125 , 1125 - 1150 , 1150 - 1175 , 1175 - 1200 , 1200 - 1225 | ||
 | Click To Change The Sort Order: By Market Cap or Company Size Performance: Year-to-date, Week and Day |  |
|
Get the most comprehensive stock market coverage daily at 12Stocks.com ➞ Best Stocks Today ➞ Best Stocks Weekly ➞ Best Stocks Year-to-Date ➞ Best Stocks Trends ➞  Best Stocks Today 12Stocks.com Best Nasdaq Stocks ➞ Best S&P 500 Stocks ➞ Best Tech Stocks ➞ Best Biotech Stocks ➞ |
| Detailed Overview of Financial Stocks |
| Financial Technical Overview, Leaders & Laggards, Top Financial ETF Funds & Detailed Financial Stocks List, Charts, Trends & More |
| Financial Sector: Technical Analysis, Trends & YTD Performance | |
| Financial sector is composed of stocks
from banks, brokers, insurance, REITs
and services subsectors. Financial sector, as represented by XLF, an exchange-traded fund [ETF] that holds basket of Financial stocks (e.g, Bank of America, Goldman Sachs) is up by 10.74% and is currently outperforming the overall market by 0.95% year-to-date. Below is a quick view of Technical charts and trends: |
|
 XLF Weekly Chart |
|
| Long Term Trend: Very Good | |
| Medium Term Trend: Good | |
 XLF Daily Chart |
|
| Short Term Trend: Very Good | |
| Overall Trend Score: 78 | |
| YTD Performance: 10.74% | |
| **Trend Scores & Views Are Only For Educational Purposes And Not For Investing | |
| 12Stocks.com: Top Performing Financial Sector Stocks | ||||||||||||||||||||||||||||||||||||||||||||||||
 The top performing Financial sector stocks year to date are
Now, more recently, over last week, the top performing Financial sector stocks on the move are


|
||||||||||||||||||||||||||||||||||||||||||||||||
| 12Stocks.com: Investing in Financial Sector using Exchange Traded Funds | |
|
The following table shows list of key exchange traded funds (ETF) that
help investors track Financial Index. For detailed view, check out our ETF Funds section of our website. Quick View: Move mouse or cursor over ETF symbol (ticker) to view short-term Technical chart and over ETF name to view long term chart. Click on ticker or stock name for detailed view. Click on to add stock symbol to your watchlist and to view watchlist. |
12Stocks.com List of ETFs that track Financial Index
| Ticker | ETF Name | Watchlist | Recent Price | Smart Investing & Trading Score | Change % | Week % | Year-to-date % |
| XLF | Financial | | 41.64 | 78 | 1.46 | 0.07 | 10.74% |
| IAI | Broker-Dealers & Secs | | 116.64 | 58 | 0.53 | -1.91 | 7.47% |
| IYF | Financials | | 95.25 | 78 | 1.32 | 0.03 | 11.52% |
| IYG | Financial Services | | 65.74 | 71 | 1.14 | -0.33 | 10.05% |
| KRE | Regional Banking | | 48.85 | 61 | 1.41 | -0.14 | -6.83% |
| IXG | Global Financials | | 87.05 | 76 | 0.80 | -0.54 | 10.77% |
| VFH | Financials | | 101.01 | 78 | 1.28 | -0.12 | 9.48% |
| KBE | Bank | | 46.23 | 68 | 1.34 | 0 | 0.46% |
| FAS | Financial Bull 3X | | 105.34 | 78 | 4.16 | -0.02 | 27.45% |
| FAZ | Financial Bear 3X | | 10.35 | 17 | -4.08 | -0.1 | -24.29% |
| UYG | Financials | | 65.65 | 78 | 3.19 | -0.03 | 18.93% |
| IAT | Regional Banks | | 41.90 | 68 | 1.87 | 0 | 0.14% |
| KIE | Insurance | | 51.16 | 78 | 1.11 | 0.69 | 13.14% |
| PSCF | SmallCap Financials | | 47.14 | 53 | 1.59 | -0.79 | -4.14% |
| EUFN | Europe Financials | | 24.18 | 100 | 1.02 | 0.71 | 15.36% |
| PGF | Financial Preferred | | 14.79 | 55 | 1.09 | 0.68 | 1.44% |
| 12Stocks.com: Charts, Trends, Fundamental Data and Performances of Financial Stocks | |
|
We now take in-depth look at all Financial stocks including charts, multi-period performances and overall trends (as measured by Smart Investing & Trading Score). One can sort Financial stocks (click link to choose) by Daily, Weekly and by Year-to-Date performances. Also, one can sort by size of the company or by market capitalization. |
| Select Your Default Chart Type: | |||||
| |||||
| Click on stock symbol or name for detailed view. Click on to add stock symbol to your watchlist and to view watchlist. Quick View: Move mouse or cursor over "Daily" to quickly view daily Technical stock chart and over "Weekly" to view weekly Technical stock chart. | |||||

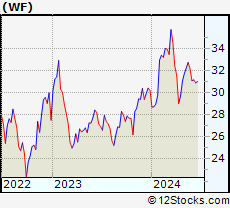 | WF Woori Financial Group Inc. |
| Sector: Financials | |
| SubSector: Foreign Regional Banks | |
| MarketCap: 4772.69 Millions | |
| Recent Price: 31.11 Smart Investing & Trading Score: 0 | |
| Day Percent Change: -0.13% Day Change: -0.04 | |
| Week Change: -3.39% Year-to-date Change: 3.0% | |
| WF Links: Profile News Message Board | |
| Charts:- Daily , Weekly | |
| Add WF to Watchlist: View: Get Complete WF Trend Analysis ➞ | |
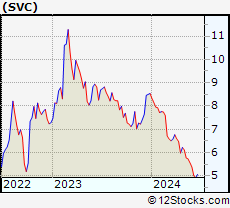 | SVC Service Properties Trust |
| Sector: Financials | |
| SubSector: REIT - Hotel/Motel | |
| MarketCap: 1067.74 Millions | |
| Recent Price: 5.38 Smart Investing & Trading Score: 27 | |
| Day Percent Change: 0.56% Day Change: 0.03 | |
| Week Change: -3.41% Year-to-date Change: -37.0% | |
| SVC Links: Profile News Message Board | |
| Charts:- Daily , Weekly | |
| Add SVC to Watchlist: View: Get Complete SVC Trend Analysis ➞ | |
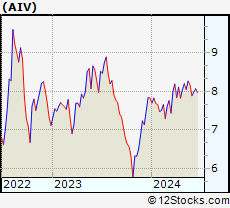 | AIV Apartment Investment and Management Company |
| Sector: Financials | |
| SubSector: REIT - Residential | |
| MarketCap: 4485.11 Millions | |
| Recent Price: 7.89 Smart Investing & Trading Score: 53 | |
| Day Percent Change: 1.68% Day Change: 0.13 | |
| Week Change: -3.43% Year-to-date Change: 0.8% | |
| AIV Links: Profile News Message Board | |
| Charts:- Daily , Weekly | |
| Add AIV to Watchlist: View: Get Complete AIV Trend Analysis ➞ | |
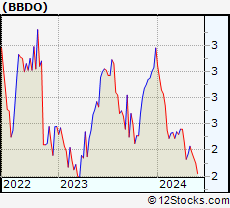 | BBDO Banco Bradesco S.A. |
| Sector: Financials | |
| SubSector: Foreign Regional Banks | |
| MarketCap: 27711.4 Millions | |
| Recent Price: 2.22 Smart Investing & Trading Score: 10 | |
| Day Percent Change: -1.33% Day Change: -0.03 | |
| Week Change: -3.48% Year-to-date Change: -30.2% | |
| BBDO Links: Profile News Message Board | |
| Charts:- Daily , Weekly | |
| Add BBDO to Watchlist: View: Get Complete BBDO Trend Analysis ➞ | |
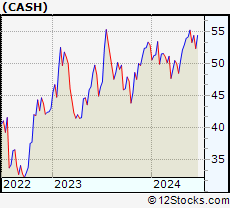 | CASH Meta Financial Group, Inc. |
| Sector: Financials | |
| SubSector: Savings & Loans | |
| MarketCap: 849.33 Millions | |
| Recent Price: 53.31 Smart Investing & Trading Score: 86 | |
| Day Percent Change: 0.28% Day Change: 0.15 | |
| Week Change: -3.51% Year-to-date Change: 0.7% | |
| CASH Links: Profile News Message Board | |
| Charts:- Daily , Weekly | |
| Add CASH to Watchlist: View: Get Complete CASH Trend Analysis ➞ | |
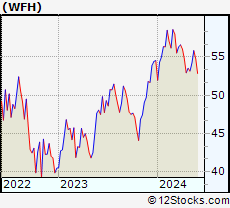 | WFH Direxion Work From Home ETF |
| Sector: Financials | |
| SubSector: Exchange Traded Fund | |
| MarketCap: 60157 Millions | |
| Recent Price: 52.85 Smart Investing & Trading Score: 8 | |
| Day Percent Change: -0.52% Day Change: -0.28 | |
| Week Change: -3.51% Year-to-date Change: -3.1% | |
| WFH Links: Profile News Message Board | |
| Charts:- Daily , Weekly | |
| Add WFH to Watchlist: View: Get Complete WFH Trend Analysis ➞ | |
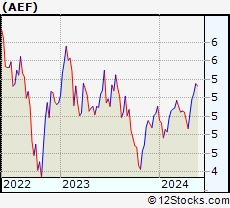 | AEF Aberdeen Emerging Markets Equity Income Fund, Inc. |
| Sector: Financials | |
| SubSector: Asset Management | |
| MarketCap: 245.803 Millions | |
| Recent Price: 5.14 Smart Investing & Trading Score: 51 | |
| Day Percent Change: -1.91% Day Change: -0.10 | |
| Week Change: -3.56% Year-to-date Change: 0.6% | |
| AEF Links: Profile News Message Board | |
| Charts:- Daily , Weekly | |
| Add AEF to Watchlist: View: Get Complete AEF Trend Analysis ➞ | |
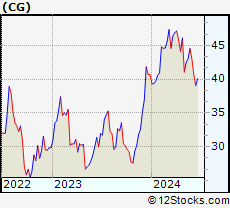 | CG The Carlyle Group Inc. |
| Sector: Financials | |
| SubSector: Asset Management | |
| MarketCap: 7269.33 Millions | |
| Recent Price: 42.96 Smart Investing & Trading Score: 40 | |
| Day Percent Change: 0.82% Day Change: 0.35 | |
| Week Change: -3.57% Year-to-date Change: 5.6% | |
| CG Links: Profile News Message Board | |
| Charts:- Daily , Weekly | |
| Add CG to Watchlist: View: Get Complete CG Trend Analysis ➞ | |
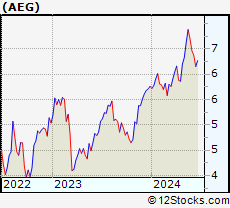 | AEG Aegon N.V. |
| Sector: Financials | |
| SubSector: Life Insurance | |
| MarketCap: 6154.26 Millions | |
| Recent Price: 6.46 Smart Investing & Trading Score: 58 | |
| Day Percent Change: 0.78% Day Change: 0.05 | |
| Week Change: -3.58% Year-to-date Change: 12.2% | |
| AEG Links: Profile News Message Board | |
| Charts:- Daily , Weekly | |
| Add AEG to Watchlist: View: Get Complete AEG Trend Analysis ➞ | |
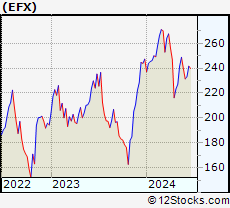 | EFX Equifax Inc. |
| Sector: Financials | |
| SubSector: Credit Services | |
| MarketCap: 13754.6 Millions | |
| Recent Price: 231.39 Smart Investing & Trading Score: 32 | |
| Day Percent Change: 0.78% Day Change: 1.80 | |
| Week Change: -3.6% Year-to-date Change: -6.4% | |
| EFX Links: Profile News Message Board | |
| Charts:- Daily , Weekly | |
| Add EFX to Watchlist: View: Get Complete EFX Trend Analysis ➞ | |
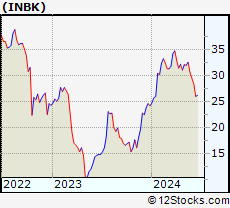 | INBK First Internet Bancorp |
| Sector: Financials | |
| SubSector: Regional - Midwest Banks | |
| MarketCap: 149.07 Millions | |
| Recent Price: 29.46 Smart Investing & Trading Score: 32 | |
| Day Percent Change: 1.62% Day Change: 0.47 | |
| Week Change: -3.79% Year-to-date Change: 21.8% | |
| INBK Links: Profile News Message Board | |
| Charts:- Daily , Weekly | |
| Add INBK to Watchlist: View: Get Complete INBK Trend Analysis ➞ | |
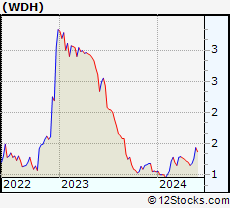 | WDH Waterdrop Inc. |
| Sector: Financials | |
| SubSector: Insurance - Diversified | |
| MarketCap: 874 Millions | |
| Recent Price: 1.38 Smart Investing & Trading Score: 76 | |
| Day Percent Change: 0.73% Day Change: 0.01 | |
| Week Change: -3.83% Year-to-date Change: 31.8% | |
| WDH Links: Profile News Message Board | |
| Charts:- Daily , Weekly | |
| Add WDH to Watchlist: View: Get Complete WDH Trend Analysis ➞ | |
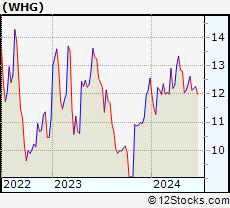 | WHG Westwood Holdings Group, Inc. |
| Sector: Financials | |
| SubSector: Asset Management | |
| MarketCap: 172.103 Millions | |
| Recent Price: 12.14 Smart Investing & Trading Score: 28 | |
| Day Percent Change: -2.33% Day Change: -0.29 | |
| Week Change: -3.88% Year-to-date Change: -3.4% | |
| WHG Links: Profile News Message Board | |
| Charts:- Daily , Weekly | |
| Add WHG to Watchlist: View: Get Complete WHG Trend Analysis ➞ | |
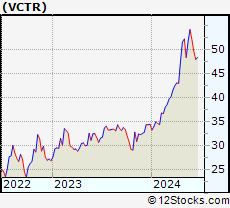 | VCTR Victory Capital Holdings, Inc. |
| Sector: Financials | |
| SubSector: Asset Management | |
| MarketCap: 1148.33 Millions | |
| Recent Price: 52.03 Smart Investing & Trading Score: 65 | |
| Day Percent Change: -0.46% Day Change: -0.24 | |
| Week Change: -3.92% Year-to-date Change: 51.1% | |
| VCTR Links: Profile News Message Board | |
| Charts:- Daily , Weekly | |
| Add VCTR to Watchlist: View: Get Complete VCTR Trend Analysis ➞ | |
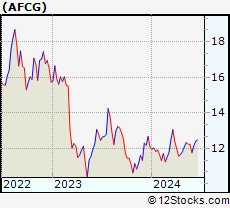 | AFCG AFC Gamma, Inc. |
| Sector: Financials | |
| SubSector: REIT - Specialty | |
| MarketCap: 269 Millions | |
| Recent Price: 11.75 Smart Investing & Trading Score: 46 | |
| Day Percent Change: 1.03% Day Change: 0.12 | |
| Week Change: -3.92% Year-to-date Change: -2.5% | |
| AFCG Links: Profile News Message Board | |
| Charts:- Daily , Weekly | |
| Add AFCG to Watchlist: View: Get Complete AFCG Trend Analysis ➞ | |
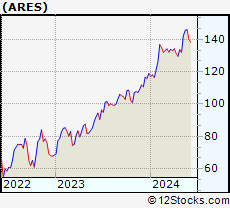 | ARES Ares Management Corporation |
| Sector: Financials | |
| SubSector: Asset Management | |
| MarketCap: 5826.23 Millions | |
| Recent Price: 140.17 Smart Investing & Trading Score: 53 | |
| Day Percent Change: -1.97% Day Change: -2.81 | |
| Week Change: -4% Year-to-date Change: 17.9% | |
| ARES Links: Profile News Message Board | |
| Charts:- Daily , Weekly | |
| Add ARES to Watchlist: View: Get Complete ARES Trend Analysis ➞ | |
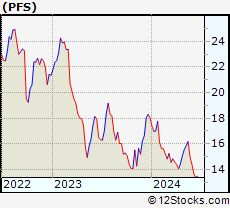 | PFS Provident Financial Services, Inc. |
| Sector: Financials | |
| SubSector: Savings & Loans | |
| MarketCap: 829.73 Millions | |
| Recent Price: 14.40 Smart Investing & Trading Score: 20 | |
| Day Percent Change: 0.63% Day Change: 0.09 | |
| Week Change: -4.06% Year-to-date Change: -20.1% | |
| PFS Links: Profile News Message Board | |
| Charts:- Daily , Weekly | |
| Add PFS to Watchlist: View: Get Complete PFS Trend Analysis ➞ | |
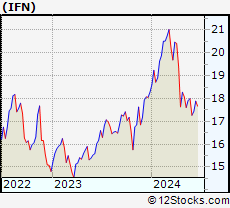 | IFN The India Fund, Inc. |
| Sector: Financials | |
| SubSector: Asset Management | |
| MarketCap: 344.303 Millions | |
| Recent Price: 17.27 Smart Investing & Trading Score: 10 | |
| Day Percent Change: -1.31% Day Change: -0.23 | |
| Week Change: -4.06% Year-to-date Change: -5.6% | |
| IFN Links: Profile News Message Board | |
| Charts:- Daily , Weekly | |
| Add IFN to Watchlist: View: Get Complete IFN Trend Analysis ➞ | |
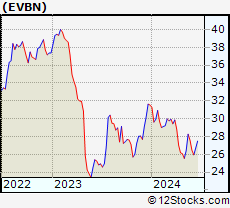 | EVBN Evans Bancorp, Inc. |
| Sector: Financials | |
| SubSector: Regional - Northeast Banks | |
| MarketCap: 124.899 Millions | |
| Recent Price: 26.46 Smart Investing & Trading Score: 50 | |
| Day Percent Change: 2.12% Day Change: 0.55 | |
| Week Change: -4.13% Year-to-date Change: -16.1% | |
| EVBN Links: Profile News Message Board | |
| Charts:- Daily , Weekly | |
| Add EVBN to Watchlist: View: Get Complete EVBN Trend Analysis ➞ | |
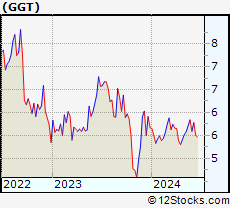 | GGT The Gabelli Multimedia Trust Inc. |
| Sector: Financials | |
| SubSector: Closed-End Fund - Equity | |
| MarketCap: 104.547 Millions | |
| Recent Price: 5.59 Smart Investing & Trading Score: 35 | |
| Day Percent Change: 0.54% Day Change: 0.03 | |
| Week Change: -4.28% Year-to-date Change: -1.4% | |
| GGT Links: Profile News Message Board | |
| Charts:- Daily , Weekly | |
| Add GGT to Watchlist: View: Get Complete GGT Trend Analysis ➞ | |
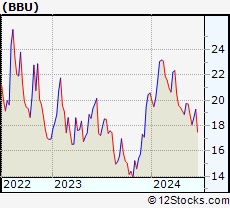 | BBU Brookfield Business Partners L.P. |
| Sector: Financials | |
| SubSector: Real Estate Development | |
| MarketCap: 1612.19 Millions | |
| Recent Price: 18.08 Smart Investing & Trading Score: 0 | |
| Day Percent Change: -0.22% Day Change: -0.04 | |
| Week Change: -4.29% Year-to-date Change: -12.2% | |
| BBU Links: Profile News Message Board | |
| Charts:- Daily , Weekly | |
| Add BBU to Watchlist: View: Get Complete BBU Trend Analysis ➞ | |
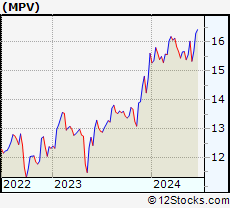 | MPV Barings Participation Investors |
| Sector: Financials | |
| SubSector: Closed-End Fund - Debt | |
| MarketCap: 101.207 Millions | |
| Recent Price: 15.33 Smart Investing & Trading Score: 38 | |
| Day Percent Change: -3.37% Day Change: -0.54 | |
| Week Change: -4.31% Year-to-date Change: -1.7% | |
| MPV Links: Profile News Message Board | |
| Charts:- Daily , Weekly | |
| Add MPV to Watchlist: View: Get Complete MPV Trend Analysis ➞ | |
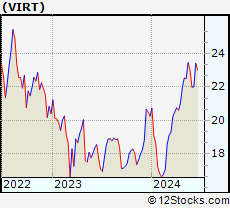 | VIRT Virtu Financial, Inc. |
| Sector: Financials | |
| SubSector: Investment Brokerage - National | |
| MarketCap: 4305.15 Millions | |
| Recent Price: 22.00 Smart Investing & Trading Score: 44 | |
| Day Percent Change: -4.43% Day Change: -1.02 | |
| Week Change: -4.43% Year-to-date Change: 8.6% | |
| VIRT Links: Profile News Message Board | |
| Charts:- Daily , Weekly | |
| Add VIRT to Watchlist: View: Get Complete VIRT Trend Analysis ➞ | |
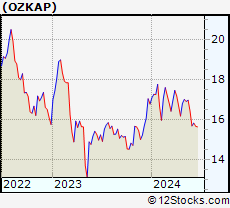 | OZKAP Bank OZK |
| Sector: Financials | |
| SubSector: Banks - Regional | |
| MarketCap: 5170 Millions | |
| Recent Price: 15.70 Smart Investing & Trading Score: 17 | |
| Day Percent Change: 0.90% Day Change: 0.14 | |
| Week Change: -4.56% Year-to-date Change: -6.5% | |
| OZKAP Links: Profile News Message Board | |
| Charts:- Daily , Weekly | |
| Add OZKAP to Watchlist: View: Get Complete OZKAP Trend Analysis ➞ | |
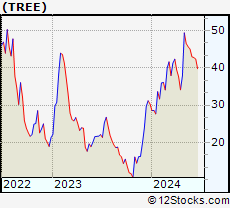 | TREE LendingTree, Inc. |
| Sector: Financials | |
| SubSector: Mortgage Investment | |
| MarketCap: 2745.99 Millions | |
| Recent Price: 42.99 Smart Investing & Trading Score: 38 | |
| Day Percent Change: -3.39% Day Change: -1.51 | |
| Week Change: -4.59% Year-to-date Change: 41.8% | |
| TREE Links: Profile News Message Board | |
| Charts:- Daily , Weekly | |
| Add TREE to Watchlist: View: Get Complete TREE Trend Analysis ➞ | |
| For tabular summary view of above stock list: Summary View ➞ 0 - 25 , 25 - 50 , 50 - 75 , 75 - 100 , 100 - 125 , 125 - 150 , 150 - 175 , 175 - 200 , 200 - 225 , 225 - 250 , 250 - 275 , 275 - 300 , 300 - 325 , 325 - 350 , 350 - 375 , 375 - 400 , 400 - 425 , 425 - 450 , 450 - 475 , 475 - 500 , 500 - 525 , 525 - 550 , 550 - 575 , 575 - 600 , 600 - 625 , 625 - 650 , 650 - 675 , 675 - 700 , 700 - 725 , 725 - 750 , 750 - 775 , 775 - 800 , 800 - 825 , 825 - 850 , 850 - 875 , 875 - 900 , 900 - 925 , 925 - 950 , 950 - 975 , 975 - 1000 , 1000 - 1025 , 1025 - 1050 , 1050 - 1075 , 1075 - 1100 , 1100 - 1125 , 1125 - 1150 , 1150 - 1175 , 1175 - 1200 , 1200 - 1225 | ||
| Click To Change The Sort Order: By Market Cap or Company Size Performance: Year-to-date, Week and Day | |
| Select Chart Type: | ||
|
Best Stocks Today 12Stocks.com |
© 2024 12Stocks.com Terms & Conditions Privacy Contact Us
All Information Provided Only For Education And Not To Be Used For Investing or Trading. See Terms & Conditions


One More Thing ... Get Best Stocks Delivered Daily!
Never Ever Miss A Move With Our Top Ten Stocks Lists
Find Best Stocks In Any Market - Bull or Bear Market
Take A Peek At Our Top Ten Stocks Lists: Daily, Weekly, Year-to-Date & Top Trends
Find Best Stocks In Any Market - Bull or Bear Market
Take A Peek At Our Top Ten Stocks Lists: Daily, Weekly, Year-to-Date & Top Trends
Financial Stocks With Best Up Trends [0-bearish to 100-bullish]: X [100], Brighthouse [100], Central and[100], Northrim BanCorp[100], Bank of America[100], Hagerty [100], Urban Edge[100], Global Blockchain[100], Ventas [100], Omega Healthcare[100], LPL [100]
Best Financial Stocks Year-to-Date:
Root [385.58%], Chimera [138.48%], Banco Macro[130.98%], SelectQuote [127.74%], Gladstone Capital[109.35%], Grupo Financiero[107.65%], Banco BBVA[107.54%], EverQuote [95.18%], Hippo [93.63%], Grupo Supervielle[78.33%], Vista Oil[64.18%] Best Financial Stocks This Week:
C3.ai [23%], Investors Title[19.4%], Banco BBVA[14.74%], Riverview Bancorp[14.25%], Banco Macro[13.7%], IRSA Inversiones[12.15%], Grupo Supervielle[11.73%], Metals Acquisition[10.74%], Grupo Financiero[10.41%], Fathom [10.24%], Vista Oil[9.32%] Best Financial Stocks Daily:
Riverview Bancorp[15.75%], Allied World[14.88%], Medical Properties[7.20%], X [6.14%], Franklin Street[5.32%], Washington Federal[5.16%], Iris Energy[5.13%], Ameris Bancorp[4.80%], Brighthouse [4.79%], Auburn National[4.70%], Central and[4.63%]