
 Login Sign Up


| |||||
 |  | ||||

| 12Stocks.com Market Intelligence |
Best Tech Stocks
| In a hurry? Tech Stocks Lists: Performance & Trends, Stock Charts, FANG Stocks
Sort Tech stocks: Daily, Weekly, Year-to-Date, Market Cap & Trends. Filter Tech stocks list by size:All Tech Large Mid-Range Small and MicroCap |
| 12Stocks.com Tech Stocks Performances & Trends Daily | |||||||||
|
|  The overall Smart Investing & Trading Score is 90 (0-bearish to 100-bullish) which puts Technology sector in short term bullish trend. The Smart Investing & Trading Score from previous trading session is 95 and hence a deterioration of trend.
| ||||||||
Here are the Smart Investing & Trading Scores of the most requested Technology stocks at 12Stocks.com (click stock name for detailed review):
|


| 12Stocks.com: Investing in Technology sector with Stocks | |
|
The following table helps investors and traders sort through current performance and trends (as measured by Smart Investing & Trading Score) of various
stocks in the Tech sector. Quick View: Move mouse or cursor over stock symbol (ticker) to view short-term technical chart and over stock name to view long term chart. Click on  to add stock symbol to your watchlist and to add stock symbol to your watchlist and  to view watchlist. Click on any ticker or stock name for detailed market intelligence report for that stock. to view watchlist. Click on any ticker or stock name for detailed market intelligence report for that stock. |
12Stocks.com Performance of Stocks in Tech Sector
| Ticker | Stock Name | Watchlist | Category | Recent Price | Smart Investing & Trading Score | Change % | YTD Change% |
| PINC | Premier |   | Healthcare Information | 19.78 | 35 | -0.55% | -11.54% |
| QRVO | Qorvo | | Semiconductor | 99.51 | 39 | -0.40% | -11.63% |
| TTGT | TechTarget | | Internet | 30.78 | 74 | 0.03% | -11.70% |
| MSCI | MSCI | | Processing | 497.51 | 64 | 1.52% | -12.05% |
| TRVG | trivago N.V | | Internet | 2.15 | 17 | 1.42% | -12.09% |
| ACN | Accenture | | IT | 308.00 | 37 | -0.17% | -12.23% |
| SMAR | Smartsheet | | Software | 41.94 | 69 | 1.08% | -12.30% |
| KLIC | Kulicke and | | Semiconductor | 47.97 | 76 | -0.83% | -12.34% |
| PAYC | Paycom Software | | Software | 181.07 | 59 | 2.04% | -12.41% |
| TUYA | Tuya | | Software - Infrastructure | 2.01 | 59 | 2.55% | -12.42% |
| ACLS | Axcelis | | Semiconductor | 113.57 | 95 | 0.56% | -12.43% |
| RAMP | LiveRamp | | IT | 33.16 | 57 | 0.76% | -12.46% |
| ON | ON Semiconductor | | Semiconductor | 73.00 | 69 | -2.33% | -12.61% |
| MOMO | Momo | | Internet | 6.07 | 30 | 0.50% | -12.66% |
| BCE | BCE | | Telecom | 34.34 | 57 | -0.67% | -12.80% |
| VIOT | Viomi | | Electronic | 0.87 | 100 | 4.82% | -13.00% |
| DXC | DXC | | IT | 19.88 | 67 | 0.76% | -13.07% |
| FARO | FARO | | Instruments | 19.57 | 57 | 1.87% | -13.14% |
| TRIP | TripAdvisor | | Internet | 18.69 | 18 | -1.06% | -13.19% |
| WBX | Wallbox N.V | | Electronic Components | 1.51 | 30 | -0.66% | -13.47% |
| OLO | Olo | | Software - | 4.94 | 31 | 3.35% | -13.64% |
| ARQQ | Arqit Quantum | | Software - Infrastructure | 0.39 | 30 | -0.63% | -13.81% |
| YY | JOYY | | Internet | 34.11 | 70 | -0.26% | -14.08% |
| MTCH | Match | | Internet | 31.36 | 40 | 0.00% | -14.08% |
| SCWX | SecureWorks | | Software | 6.32 | 42 | 1.12% | -14.36% |
| For chart view version of above stock list: Chart View ➞ 0 - 25 , 25 - 50 , 50 - 75 , 75 - 100 , 100 - 125 , 125 - 150 , 150 - 175 , 175 - 200 , 200 - 225 , 225 - 250 , 250 - 275 , 275 - 300 , 300 - 325 , 325 - 350 , 350 - 375 , 375 - 400 , 400 - 425 , 425 - 450 , 450 - 475 , 475 - 500 , 500 - 525 , 525 - 550 , 550 - 575 , 575 - 600 , 600 - 625 , 625 - 650 | ||
 | Click To Change The Sort Order: By Market Cap or Company Size Performance: Year-to-date, Week and Day |  |
|
Get the most comprehensive stock market coverage daily at 12Stocks.com ➞ Best Stocks Today ➞ Best Stocks Weekly ➞ Best Stocks Year-to-Date ➞ Best Stocks Trends ➞  Best Stocks Today 12Stocks.com Best Nasdaq Stocks ➞ Best S&P 500 Stocks ➞ Best Tech Stocks ➞ Best Biotech Stocks ➞ |
| Detailed Overview of Tech Stocks |
| Tech Technical Overview, Leaders & Laggards, Top Tech ETF Funds & Detailed Tech Stocks List, Charts, Trends & More |
| Tech Sector: Technical Analysis, Trends & YTD Performance | |
| Technology sector is composed of stocks
from semiconductors, software, web, social media
and services subsectors. Technology sector, as represented by XLK, an exchange-traded fund [ETF] that holds basket of tech stocks (e.g, Intel, Google) is up by 10.29% and is currently underperforming the overall market by -0.13% year-to-date. Below is a quick view of technical charts and trends: |
|
 XLK Weekly Chart |
|
| Long Term Trend: Very Good | |
| Medium Term Trend: Very Good | |
 XLK Daily Chart |
|
| Short Term Trend: Very Good | |
| Overall Trend Score: 90 | |
| YTD Performance: 10.29% | |
| **Trend Scores & Views Are Only For Educational Purposes And Not For Investing | |
| 12Stocks.com: Top Performing Technology Sector Stocks | ||||||||||||||||||||||||||||||||||||||||||||||||
 The top performing Technology sector stocks year to date are
Now, more recently, over last week, the top performing Technology sector stocks on the move are


|
||||||||||||||||||||||||||||||||||||||||||||||||
| 12Stocks.com: Investing in Tech Sector using Exchange Traded Funds | |
|
The following table shows list of key exchange traded funds (ETF) that
help investors track Tech Index. For detailed view, check out our ETF Funds section of our website. Quick View: Move mouse or cursor over ETF symbol (ticker) to view short-term technical chart and over ETF name to view long term chart. Click on ticker or stock name for detailed view. Click on to add stock symbol to your watchlist and to view watchlist. |
12Stocks.com List of ETFs that track Tech Index
| Ticker | ETF Name | Watchlist | Recent Price | Smart Investing & Trading Score | Change % | Week % | Year-to-date % |
| XLK | Technology | | 212.29 | 90 | -0.35 | 3.28 | 10.29% |
| QQQ | QQQ | | 454.60 | 95 | 0.94 | 2.84 | 11.01% |
| IYW | Technology | | 138.85 | 95 | 0.10 | 3.64 | 13.11% |
| VGT | Information Technology | | 538.04 | 100 | 0.36 | 4.22 | 11.17% |
| IXN | Global Tech | | 76.21 | 95 | -0.43 | 3.14 | 11.78% |
| IGV | Tech-Software | | 84.11 | 64 | 0.09 | 3.34 | 3.67% |
| XSD | Semiconductor | | 238.46 | 95 | -0.49 | 3.98 | 6.08% |
| TQQQ | QQQ | | 63.08 | 90 | -0.61 | 6.61 | 24.42% |
| SQQQ | Short QQQ | | 9.94 | 10 | 0.71 | -6.31 | -26.1% |
| SOXL | Semicondct Bull 3X | | 46.26 | 100 | -1.57 | 12.75 | 47.32% |
| SOXS | Semicondct Bear 3X | | 28.25 | 26 | -5.23 | -14.81 | 385.4% |
| SOXX | PHLX Semiconductor | | 232.14 | 100 | 0.64 | 5.4 | 20.89% |
| QTEC | First -100-Tech | | 192.24 | 82 | 0.44 | 4.03 | 9.56% |
| SMH | Semiconductor | | 232.20 | 95 | -0.73 | 3.99 | 32.78% |
| 12Stocks.com: Charts, Trends, Fundamental Data and Performances of Tech Stocks | |
|
We now take in-depth look at all Tech stocks including charts, multi-period performances and overall trends (as measured by Smart Investing & Trading Score). One can sort Tech stocks (click link to choose) by Daily, Weekly and by Year-to-Date performances. Also, one can sort by size of the company or by market capitalization. |
| Select Your Default Chart Type: | |||||
| |||||
| Click on stock symbol or name for detailed view. Click on to add stock symbol to your watchlist and to view watchlist. Quick View: Move mouse or cursor over "Daily" to quickly view daily technical stock chart and over "Weekly" to view weekly technical stock chart. | |||||


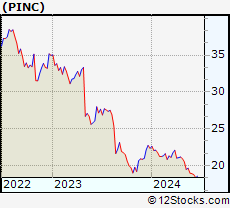 | PINC Premier, Inc. |
| Sector: Technology | |
| SubSector: Healthcare Information Services | |
| MarketCap: 2044.85 Millions | |
| Recent Price: 19.78 Smart Investing & Trading Score: 35 | |
| Day Percent Change: -0.55% Day Change: -0.11 | |
| Week Change: 1.44% Year-to-date Change: -11.5% | |
| PINC Links: Profile News Message Board | |
| Charts:- Daily , Weekly | |
| Add PINC to Watchlist: View: Get Complete PINC Trend Analysis ➞ | |
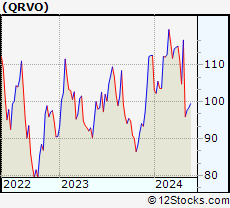 | QRVO Qorvo, Inc. |
| Sector: Technology | |
| SubSector: Semiconductor - Broad Line | |
| MarketCap: 9524.32 Millions | |
| Recent Price: 99.51 Smart Investing & Trading Score: 39 | |
| Day Percent Change: -0.40% Day Change: -0.40 | |
| Week Change: 1.86% Year-to-date Change: -11.6% | |
| QRVO Links: Profile News Message Board | |
| Charts:- Daily , Weekly | |
| Add QRVO to Watchlist: View: Get Complete QRVO Trend Analysis ➞ | |
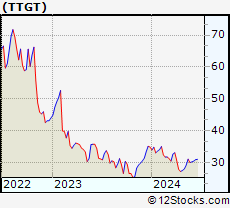 | TTGT TechTarget, Inc. |
| Sector: Technology | |
| SubSector: Internet Information Providers | |
| MarketCap: 560.78 Millions | |
| Recent Price: 30.78 Smart Investing & Trading Score: 74 | |
| Day Percent Change: 0.03% Day Change: 0.01 | |
| Week Change: 5.45% Year-to-date Change: -11.7% | |
| TTGT Links: Profile News Message Board | |
| Charts:- Daily , Weekly | |
| Add TTGT to Watchlist: View: Get Complete TTGT Trend Analysis ➞ | |
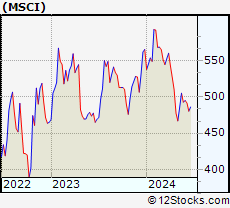 | MSCI MSCI Inc. |
| Sector: Technology | |
| SubSector: Processing Systems & Products | |
| MarketCap: 21086.3 Millions | |
| Recent Price: 497.51 Smart Investing & Trading Score: 64 | |
| Day Percent Change: 1.52% Day Change: 7.45 | |
| Week Change: 2.55% Year-to-date Change: -12.1% | |
| MSCI Links: Profile News Message Board | |
| Charts:- Daily , Weekly | |
| Add MSCI to Watchlist: View: Get Complete MSCI Trend Analysis ➞ | |
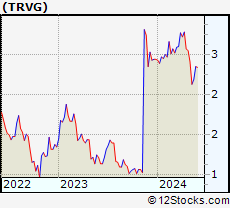 | TRVG trivago N.V. |
| Sector: Technology | |
| SubSector: Internet Information Providers | |
| MarketCap: 587.88 Millions | |
| Recent Price: 2.15 Smart Investing & Trading Score: 17 | |
| Day Percent Change: 1.42% Day Change: 0.03 | |
| Week Change: 0.7% Year-to-date Change: -12.1% | |
| TRVG Links: Profile News Message Board | |
| Charts:- Daily , Weekly | |
| Add TRVG to Watchlist: View: Get Complete TRVG Trend Analysis ➞ | |
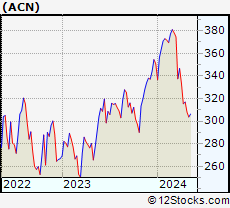 | ACN Accenture plc |
| Sector: Technology | |
| SubSector: Information Technology Services | |
| MarketCap: 106627 Millions | |
| Recent Price: 308.00 Smart Investing & Trading Score: 37 | |
| Day Percent Change: -0.17% Day Change: -0.52 | |
| Week Change: 0.55% Year-to-date Change: -12.2% | |
| ACN Links: Profile News Message Board | |
| Charts:- Daily , Weekly | |
| Add ACN to Watchlist: View: Get Complete ACN Trend Analysis ➞ | |
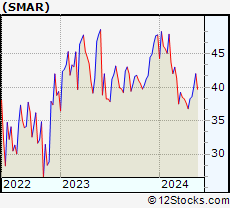 | SMAR Smartsheet Inc. |
| Sector: Technology | |
| SubSector: Business Software & Services | |
| MarketCap: 5159.38 Millions | |
| Recent Price: 41.94 Smart Investing & Trading Score: 69 | |
| Day Percent Change: 1.08% Day Change: 0.45 | |
| Week Change: 4.61% Year-to-date Change: -12.3% | |
| SMAR Links: Profile News Message Board | |
| Charts:- Daily , Weekly | |
| Add SMAR to Watchlist: View: Get Complete SMAR Trend Analysis ➞ | |
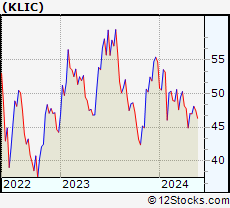 | KLIC Kulicke and Soffa Industries, Inc. |
| Sector: Technology | |
| SubSector: Semiconductor Equipment & Materials | |
| MarketCap: 1336.68 Millions | |
| Recent Price: 47.97 Smart Investing & Trading Score: 76 | |
| Day Percent Change: -0.83% Day Change: -0.40 | |
| Week Change: -0.29% Year-to-date Change: -12.3% | |
| KLIC Links: Profile News Message Board | |
| Charts:- Daily , Weekly | |
| Add KLIC to Watchlist: View: Get Complete KLIC Trend Analysis ➞ | |
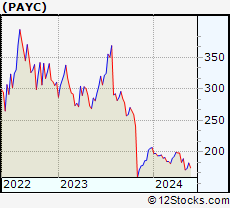 | PAYC Paycom Software, Inc. |
| Sector: Technology | |
| SubSector: Application Software | |
| MarketCap: 13041.6 Millions | |
| Recent Price: 181.07 Smart Investing & Trading Score: 59 | |
| Day Percent Change: 2.04% Day Change: 3.62 | |
| Week Change: 4.43% Year-to-date Change: -12.4% | |
| PAYC Links: Profile News Message Board | |
| Charts:- Daily , Weekly | |
| Add PAYC to Watchlist: View: Get Complete PAYC Trend Analysis ➞ | |
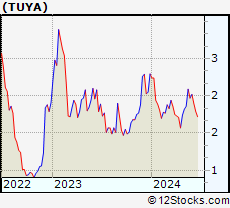 | TUYA Tuya Inc. |
| Sector: Technology | |
| SubSector: Software - Infrastructure | |
| MarketCap: 1050 Millions | |
| Recent Price: 2.01 Smart Investing & Trading Score: 59 | |
| Day Percent Change: 2.55% Day Change: 0.05 | |
| Week Change: 8.06% Year-to-date Change: -12.4% | |
| TUYA Links: Profile News Message Board | |
| Charts:- Daily , Weekly | |
| Add TUYA to Watchlist: View: Get Complete TUYA Trend Analysis ➞ | |
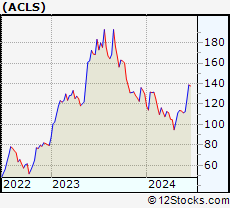 | ACLS Axcelis Technologies, Inc. |
| Sector: Technology | |
| SubSector: Semiconductor Equipment & Materials | |
| MarketCap: 498.518 Millions | |
| Recent Price: 113.57 Smart Investing & Trading Score: 95 | |
| Day Percent Change: 0.56% Day Change: 0.63 | |
| Week Change: -0.19% Year-to-date Change: -12.4% | |
| ACLS Links: Profile News Message Board | |
| Charts:- Daily , Weekly | |
| Add ACLS to Watchlist: View: Get Complete ACLS Trend Analysis ➞ | |
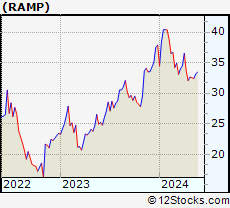 | RAMP LiveRamp Holdings, Inc. |
| Sector: Technology | |
| SubSector: Information Technology Services | |
| MarketCap: 2124.38 Millions | |
| Recent Price: 33.16 Smart Investing & Trading Score: 57 | |
| Day Percent Change: 0.76% Day Change: 0.25 | |
| Week Change: 2.35% Year-to-date Change: -12.5% | |
| RAMP Links: Profile News Message Board | |
| Charts:- Daily , Weekly | |
| Add RAMP to Watchlist: View: Get Complete RAMP Trend Analysis ➞ | |
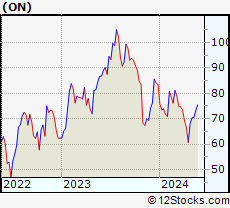 | ON ON Semiconductor Corporation |
| Sector: Technology | |
| SubSector: Semiconductor - Broad Line | |
| MarketCap: 5183.82 Millions | |
| Recent Price: 73.00 Smart Investing & Trading Score: 69 | |
| Day Percent Change: -2.33% Day Change: -1.74 | |
| Week Change: 3.6% Year-to-date Change: -12.6% | |
| ON Links: Profile News Message Board | |
| Charts:- Daily , Weekly | |
| Add ON to Watchlist: View: Get Complete ON Trend Analysis ➞ | |
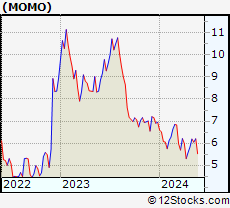 | MOMO Momo Inc. |
| Sector: Technology | |
| SubSector: Internet Software & Services | |
| MarketCap: 4796.71 Millions | |
| Recent Price: 6.07 Smart Investing & Trading Score: 30 | |
| Day Percent Change: 0.50% Day Change: 0.03 | |
| Week Change: 0.33% Year-to-date Change: -12.7% | |
| MOMO Links: Profile News Message Board | |
| Charts:- Daily , Weekly | |
| Add MOMO to Watchlist: View: Get Complete MOMO Trend Analysis ➞ | |
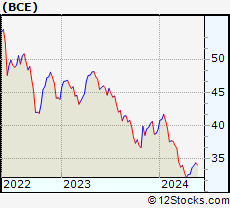 | BCE BCE Inc. |
| Sector: Technology | |
| SubSector: Telecom Services - Domestic | |
| MarketCap: 37288.3 Millions | |
| Recent Price: 34.34 Smart Investing & Trading Score: 57 | |
| Day Percent Change: -0.67% Day Change: -0.23 | |
| Week Change: 1.18% Year-to-date Change: -12.8% | |
| BCE Links: Profile News Message Board | |
| Charts:- Daily , Weekly | |
| Add BCE to Watchlist: View: Get Complete BCE Trend Analysis ➞ | |
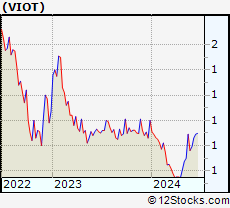 | VIOT Viomi Technology Co., Ltd |
| Sector: Technology | |
| SubSector: Electronic Equipment | |
| MarketCap: 357.2 Millions | |
| Recent Price: 0.87 Smart Investing & Trading Score: 100 | |
| Day Percent Change: 4.82% Day Change: 0.04 | |
| Week Change: 24.55% Year-to-date Change: -13.0% | |
| VIOT Links: Profile News Message Board | |
| Charts:- Daily , Weekly | |
| Add VIOT to Watchlist: View: Get Complete VIOT Trend Analysis ➞ | |
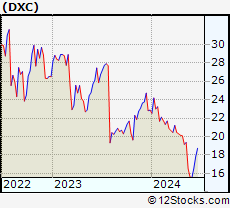 | DXC DXC Technology Company |
| Sector: Technology | |
| SubSector: Information Technology Services | |
| MarketCap: 3622.28 Millions | |
| Recent Price: 19.88 Smart Investing & Trading Score: 67 | |
| Day Percent Change: 0.76% Day Change: 0.15 | |
| Week Change: 2.69% Year-to-date Change: -13.1% | |
| DXC Links: Profile News Message Board | |
| Charts:- Daily , Weekly | |
| Add DXC to Watchlist: View: Get Complete DXC Trend Analysis ➞ | |
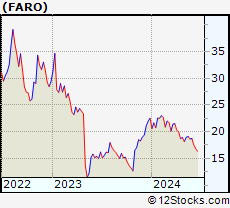 | FARO FARO Technologies, Inc. |
| Sector: Technology | |
| SubSector: Scientific & Technical Instruments | |
| MarketCap: 721.953 Millions | |
| Recent Price: 19.57 Smart Investing & Trading Score: 57 | |
| Day Percent Change: 1.87% Day Change: 0.36 | |
| Week Change: 3.27% Year-to-date Change: -13.1% | |
| FARO Links: Profile News Message Board | |
| Charts:- Daily , Weekly | |
| Add FARO to Watchlist: View: Get Complete FARO Trend Analysis ➞ | |
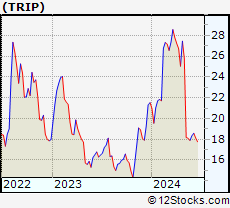 | TRIP TripAdvisor, Inc. |
| Sector: Technology | |
| SubSector: Internet Information Providers | |
| MarketCap: 2633.9 Millions | |
| Recent Price: 18.69 Smart Investing & Trading Score: 18 | |
| Day Percent Change: -1.06% Day Change: -0.20 | |
| Week Change: 2.81% Year-to-date Change: -13.2% | |
| TRIP Links: Profile News Message Board | |
| Charts:- Daily , Weekly | |
| Add TRIP to Watchlist: View: Get Complete TRIP Trend Analysis ➞ | |
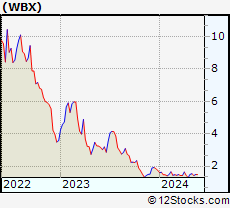 | WBX Wallbox N.V. |
| Sector: Technology | |
| SubSector: Electronic Components | |
| MarketCap: 528 Millions | |
| Recent Price: 1.51 Smart Investing & Trading Score: 30 | |
| Day Percent Change: -0.66% Day Change: -0.01 | |
| Week Change: 6.34% Year-to-date Change: -13.5% | |
| WBX Links: Profile News Message Board | |
| Charts:- Daily , Weekly | |
| Add WBX to Watchlist: View: Get Complete WBX Trend Analysis ➞ | |
 | OLO Olo Inc. |
| Sector: Technology | |
| SubSector: Software - Application | |
| MarketCap: 1030 Millions | |
| Recent Price: 4.94 Smart Investing & Trading Score: 31 | |
| Day Percent Change: 3.35% Day Change: 0.16 | |
| Week Change: 5.78% Year-to-date Change: -13.6% | |
| OLO Links: Profile News Message Board | |
| Charts:- Daily , Weekly | |
| Add OLO to Watchlist: View: Get Complete OLO Trend Analysis ➞ | |
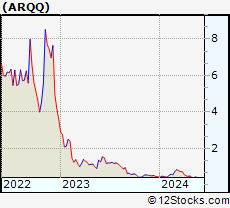 | ARQQ Arqit Quantum Inc. |
| Sector: Technology | |
| SubSector: Software - Infrastructure | |
| MarketCap: 165 Millions | |
| Recent Price: 0.39 Smart Investing & Trading Score: 30 | |
| Day Percent Change: -0.63% Day Change: 0.00 | |
| Week Change: -1.33% Year-to-date Change: -13.8% | |
| ARQQ Links: Profile News Message Board | |
| Charts:- Daily , Weekly | |
| Add ARQQ to Watchlist: View: Get Complete ARQQ Trend Analysis ➞ | |
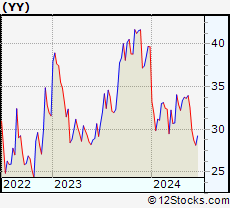 | YY JOYY Inc. |
| Sector: Technology | |
| SubSector: Internet Information Providers | |
| MarketCap: 3527.6 Millions | |
| Recent Price: 34.11 Smart Investing & Trading Score: 70 | |
| Day Percent Change: -0.26% Day Change: -0.09 | |
| Week Change: 1.37% Year-to-date Change: -14.1% | |
| YY Links: Profile News Message Board | |
| Charts:- Daily , Weekly | |
| Add YY to Watchlist: View: Get Complete YY Trend Analysis ➞ | |
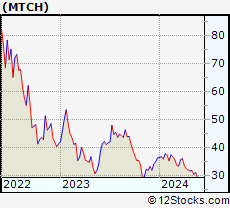 | MTCH Match Group, Inc. |
| Sector: Technology | |
| SubSector: Internet Information Providers | |
| MarketCap: 14655.8 Millions | |
| Recent Price: 31.36 Smart Investing & Trading Score: 40 | |
| Day Percent Change: 0.00% Day Change: 0.00 | |
| Week Change: 2.18% Year-to-date Change: -14.1% | |
| MTCH Links: Profile News Message Board | |
| Charts:- Daily , Weekly | |
| Add MTCH to Watchlist: View: Get Complete MTCH Trend Analysis ➞ | |
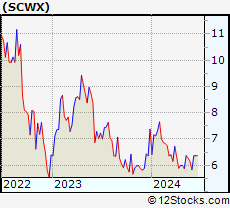 | SCWX SecureWorks Corp. |
| Sector: Technology | |
| SubSector: Application Software | |
| MarketCap: 986 Millions | |
| Recent Price: 6.32 Smart Investing & Trading Score: 42 | |
| Day Percent Change: 1.12% Day Change: 0.07 | |
| Week Change: -0.78% Year-to-date Change: -14.4% | |
| SCWX Links: Profile News Message Board | |
| Charts:- Daily , Weekly | |
| Add SCWX to Watchlist: View: Get Complete SCWX Trend Analysis ➞ | |
| For tabular summary view of above stock list: Summary View ➞ 0 - 25 , 25 - 50 , 50 - 75 , 75 - 100 , 100 - 125 , 125 - 150 , 150 - 175 , 175 - 200 , 200 - 225 , 225 - 250 , 250 - 275 , 275 - 300 , 300 - 325 , 325 - 350 , 350 - 375 , 375 - 400 , 400 - 425 , 425 - 450 , 450 - 475 , 475 - 500 , 500 - 525 , 525 - 550 , 550 - 575 , 575 - 600 , 600 - 625 , 625 - 650 | ||
| Click To Change The Sort Order: By Market Cap or Company Size Performance: Year-to-date, Week and Day | |
| Select Chart Type: | ||
|
Best Stocks Today 12Stocks.com |
© 2024 12Stocks.com Terms & Conditions Privacy Contact Us
All Information Provided Only For Education And Not To Be Used For Investing or Trading. See Terms & Conditions


One More Thing ... Get Best Stocks Delivered Daily!
Never Ever Miss A Move With Our Top Ten Stocks Lists
Find Best Stocks In Any Market - Bull or Bear Market
Take A Peek At Our Top Ten Stocks Lists: Daily, Weekly, Year-to-Date & Top Trends
Find Best Stocks In Any Market - Bull or Bear Market
Take A Peek At Our Top Ten Stocks Lists: Daily, Weekly, Year-to-Date & Top Trends
Technology Stocks With Best Up Trends [0-bearish to 100-bullish]: GDS [100], Mercury Systems[100], Synchronoss [100], Viomi [100], Marvell [100], Sea [100], Turkcell Iletisim[100], Himax [100], Agilysys [100], Bilibili [100], EverCommerce [100]
Best Technology Stocks Year-to-Date:
MicroCloud Hologram[449.64%], Uxin [403.57%], Bakkt [370.4%], MediaCo Holding[256.81%], Smith Micro[224.46%], Super Micro[218.16%], CXApp [147.1%], SoundHound AI[138.79%], MicroStrategy [127.98%], AppLovin [109.15%], CuriosityStream [99.96%] Best Technology Stocks This Week:
Maxeon Solar[49.31%], SunPower [43.04%], Uxin [40.64%], Synchronoss [33.17%], Tigo Energy[32.41%], on [26.45%], LivePerson [25.76%], monday.com [25.66%], Viomi [24.55%], MicroStrategy [21.98%], Agilysys [21.01%] Best Technology Stocks Daily:
Maxeon Solar[26.56%], Orion Energy[16.94%], Comtech Tele[12.92%], iQIYI [12.21%], Extreme Networks[10.52%], NextNav [8.96%], Agora [8.46%], iCAD [7.88%], GDS [7.45%], Omnicell [5.99%], SunPower [5.79%]