
 Login Sign Up


| |||||
 |  | ||||

| 12Stocks.com Market Intelligence |
Best Tech Stocks
| In a hurry? Tech Stocks Lists: Performance & Trends, Stock Charts, FANG Stocks
Sort Tech stocks: Daily, Weekly, Year-to-Date, Market Cap & Trends. Filter Tech stocks list by size:All Tech Large Mid-Range Small and MicroCap |
| 12Stocks.com Tech Stocks Performances & Trends Daily | |||||||||
|
|  The overall Smart Investing & Trading Score is 90 (0-bearish to 100-bullish) which puts Technology sector in short term bullish trend. The Smart Investing & Trading Score from previous trading session is 95 and hence a deterioration of trend.
| ||||||||
Here are the Smart Investing & Trading Scores of the most requested Technology stocks at 12Stocks.com (click stock name for detailed review):
|


| 12Stocks.com: Investing in Technology sector with Stocks | |
|
The following table helps investors and traders sort through current performance and trends (as measured by Smart Investing & Trading Score) of various
stocks in the Tech sector. Quick View: Move mouse or cursor over stock symbol (ticker) to view short-term technical chart and over stock name to view long term chart. Click on  to add stock symbol to your watchlist and to add stock symbol to your watchlist and  to view watchlist. Click on any ticker or stock name for detailed market intelligence report for that stock. to view watchlist. Click on any ticker or stock name for detailed market intelligence report for that stock. |
12Stocks.com Performance of Stocks in Tech Sector
| Ticker | Stock Name | Watchlist | Category | Recent Price | Smart Investing & Trading Score | Change % | YTD Change% |
| JBL | Jabil |   | Circuit Boards | 115.38 | 10 | -0.08% | -9.43% |
| BLKB | Blackbaud | | Software | 78.52 | 76 | -0.62% | -9.43% |
| ADSK | Autodesk | | Software | 220.43 | 64 | 0.09% | -9.47% |
| MDB | MongoDB | | Software | 369.94 | 49 | -1.74% | -9.52% |
| ERIC | Telefonaktiebolaget LM | | Communication | 5.69 | 100 | 0.18% | -9.68% |
| CCI | Crown Castle | | Communication | 104.02 | 74 | 0.48% | -9.70% |
| ANSS | ANSYS | | Software | 327.53 | 32 | -0.71% | -9.74% |
| NET | Cloudflare | | Software | 75.14 | 49 | 1.20% | -9.75% |
| TDY | Teledyne | | Instruments | 402.26 | 64 | -0.31% | -9.87% |
| DIOD | Diodes | | Semiconductor | 72.41 | 79 | 0.56% | -10.07% |
| OPRX | OptimizeRx | | Healthcare Information | 12.85 | 67 | -2.43% | -10.20% |
| GILT | Gilat Satellite | | Communication | 5.48 | 25 | -1.08% | -10.31% |
| NTGR | NETGEAR | | Communication | 13.06 | 49 | -0.15% | -10.43% |
| GFS | GLOBALFOUNDRIES | | Semiconductors | 54.18 | 57 | -0.53% | -10.45% |
| HLIT | Harmonic | | Communication | 11.67 | 69 | 3.27% | -10.51% |
| LITE | Lumentum | | Communication | 46.80 | 67 | 2.36% | -10.72% |
| GTLB | GitLab | | Software - | 56.50 | 64 | -1.05% | -10.84% |
| WMG | Warner Music | | Entertainment | 31.89 | 10 | -2.21% | -10.93% |
| ZM | Zoom Video | | Software | 63.96 | 62 | 0.24% | -11.06% |
| ITI | Iteris | | Communication | 4.62 | 57 | 2.90% | -11.15% |
| CEVA | CEVA | | Semiconductor | 20.16 | 62 | -1.18% | -11.23% |
| XPER | Xperi | | Semiconductor | 9.78 | 8 | -2.30% | -11.25% |
| DT | Dynatrace | | Software | 48.47 | 64 | 1.51% | -11.37% |
| APPN | Appian | | Software | 33.37 | 25 | -0.21% | -11.39% |
| ENPH | Enphase Energy | | Semiconductor | 116.89 | 74 | 1.22% | -11.54% |
| For chart view version of above stock list: Chart View ➞ 0 - 25 , 25 - 50 , 50 - 75 , 75 - 100 , 100 - 125 , 125 - 150 , 150 - 175 , 175 - 200 , 200 - 225 , 225 - 250 , 250 - 275 , 275 - 300 , 300 - 325 , 325 - 350 , 350 - 375 , 375 - 400 , 400 - 425 , 425 - 450 , 450 - 475 , 475 - 500 , 500 - 525 , 525 - 550 , 550 - 575 , 575 - 600 , 600 - 625 , 625 - 650 | ||
 | Click To Change The Sort Order: By Market Cap or Company Size Performance: Year-to-date, Week and Day |  |
|
Get the most comprehensive stock market coverage daily at 12Stocks.com ➞ Best Stocks Today ➞ Best Stocks Weekly ➞ Best Stocks Year-to-Date ➞ Best Stocks Trends ➞  Best Stocks Today 12Stocks.com Best Nasdaq Stocks ➞ Best S&P 500 Stocks ➞ Best Tech Stocks ➞ Best Biotech Stocks ➞ |
| Detailed Overview of Tech Stocks |
| Tech Technical Overview, Leaders & Laggards, Top Tech ETF Funds & Detailed Tech Stocks List, Charts, Trends & More |
| Tech Sector: Technical Analysis, Trends & YTD Performance | |
| Technology sector is composed of stocks
from semiconductors, software, web, social media
and services subsectors. Technology sector, as represented by XLK, an exchange-traded fund [ETF] that holds basket of tech stocks (e.g, Intel, Google) is up by 10.29% and is currently underperforming the overall market by -0.13% year-to-date. Below is a quick view of technical charts and trends: |
|
 XLK Weekly Chart |
|
| Long Term Trend: Very Good | |
| Medium Term Trend: Very Good | |
 XLK Daily Chart |
|
| Short Term Trend: Very Good | |
| Overall Trend Score: 90 | |
| YTD Performance: 10.29% | |
| **Trend Scores & Views Are Only For Educational Purposes And Not For Investing | |
| 12Stocks.com: Top Performing Technology Sector Stocks | ||||||||||||||||||||||||||||||||||||||||||||||||
 The top performing Technology sector stocks year to date are
Now, more recently, over last week, the top performing Technology sector stocks on the move are


|
||||||||||||||||||||||||||||||||||||||||||||||||
| 12Stocks.com: Investing in Tech Sector using Exchange Traded Funds | |
|
The following table shows list of key exchange traded funds (ETF) that
help investors track Tech Index. For detailed view, check out our ETF Funds section of our website. Quick View: Move mouse or cursor over ETF symbol (ticker) to view short-term technical chart and over ETF name to view long term chart. Click on ticker or stock name for detailed view. Click on to add stock symbol to your watchlist and to view watchlist. |
12Stocks.com List of ETFs that track Tech Index
| Ticker | ETF Name | Watchlist | Recent Price | Smart Investing & Trading Score | Change % | Week % | Year-to-date % |
| XLK | Technology | | 212.29 | 90 | -0.35 | 3.28 | 10.29% |
| QQQ | QQQ | | 454.60 | 95 | 0.94 | 2.84 | 11.01% |
| IYW | Technology | | 138.85 | 95 | 0.10 | 3.64 | 13.11% |
| VGT | Information Technology | | 538.04 | 100 | 0.36 | 4.22 | 11.17% |
| IXN | Global Tech | | 76.21 | 90 | -0.43 | 3.14 | 11.78% |
| IGV | Tech-Software | | 84.11 | 64 | 0.09 | 3.34 | 3.67% |
| XSD | Semiconductor | | 238.46 | 95 | -0.49 | 3.98 | 6.08% |
| TQQQ | QQQ | | 63.08 | 90 | -0.61 | 6.61 | 24.42% |
| SQQQ | Short QQQ | | 9.94 | 10 | 0.71 | -6.31 | -26.1% |
| SOXL | Semicondct Bull 3X | | 46.26 | 100 | -1.57 | 12.75 | 47.32% |
| SOXS | Semicondct Bear 3X | | 28.25 | 26 | -5.23 | -14.81 | 385.4% |
| SOXX | PHLX Semiconductor | | 232.14 | 100 | 0.64 | 5.4 | 20.89% |
| QTEC | First -100-Tech | | 192.24 | 95 | 0.44 | 4.03 | 9.56% |
| SMH | Semiconductor | | 232.20 | 95 | -0.73 | 3.99 | 32.78% |
| 12Stocks.com: Charts, Trends, Fundamental Data and Performances of Tech Stocks | |
|
We now take in-depth look at all Tech stocks including charts, multi-period performances and overall trends (as measured by Smart Investing & Trading Score). One can sort Tech stocks (click link to choose) by Daily, Weekly and by Year-to-Date performances. Also, one can sort by size of the company or by market capitalization. |
| Select Your Default Chart Type: | |||||
| |||||
| Click on stock symbol or name for detailed view. Click on to add stock symbol to your watchlist and to view watchlist. Quick View: Move mouse or cursor over "Daily" to quickly view daily technical stock chart and over "Weekly" to view weekly technical stock chart. | |||||


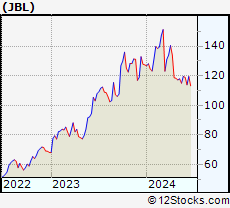 | JBL Jabil Inc. |
| Sector: Technology | |
| SubSector: Printed Circuit Boards | |
| MarketCap: 3272.15 Millions | |
| Recent Price: 115.38 Smart Investing & Trading Score: 10 | |
| Day Percent Change: -0.08% Day Change: -0.09 | |
| Week Change: -2.18% Year-to-date Change: -9.4% | |
| JBL Links: Profile News Message Board | |
| Charts:- Daily , Weekly | |
| Add JBL to Watchlist: View: Get Complete JBL Trend Analysis ➞ | |
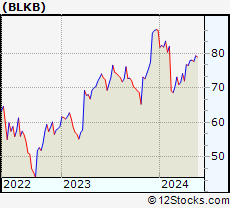 | BLKB Blackbaud, Inc. |
| Sector: Technology | |
| SubSector: Business Software & Services | |
| MarketCap: 2838.48 Millions | |
| Recent Price: 78.52 Smart Investing & Trading Score: 76 | |
| Day Percent Change: -0.62% Day Change: -0.49 | |
| Week Change: 1.12% Year-to-date Change: -9.4% | |
| BLKB Links: Profile News Message Board | |
| Charts:- Daily , Weekly | |
| Add BLKB to Watchlist: View: Get Complete BLKB Trend Analysis ➞ | |
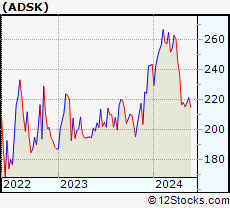 | ADSK Autodesk, Inc. |
| Sector: Technology | |
| SubSector: Technical & System Software | |
| MarketCap: 36975.8 Millions | |
| Recent Price: 220.43 Smart Investing & Trading Score: 64 | |
| Day Percent Change: 0.09% Day Change: 0.19 | |
| Week Change: 1.22% Year-to-date Change: -9.5% | |
| ADSK Links: Profile News Message Board | |
| Charts:- Daily , Weekly | |
| Add ADSK to Watchlist: View: Get Complete ADSK Trend Analysis ➞ | |
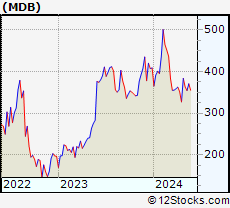 | MDB MongoDB, Inc. |
| Sector: Technology | |
| SubSector: Application Software | |
| MarketCap: 7591.22 Millions | |
| Recent Price: 369.94 Smart Investing & Trading Score: 49 | |
| Day Percent Change: -1.74% Day Change: -6.55 | |
| Week Change: 4.37% Year-to-date Change: -9.5% | |
| MDB Links: Profile News Message Board | |
| Charts:- Daily , Weekly | |
| Add MDB to Watchlist: View: Get Complete MDB Trend Analysis ➞ | |
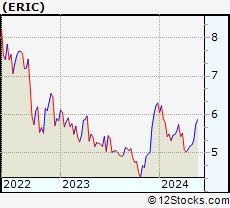 | ERIC Telefonaktiebolaget LM Ericsson (publ) |
| Sector: Technology | |
| SubSector: Communication Equipment | |
| MarketCap: 27041.1 Millions | |
| Recent Price: 5.69 Smart Investing & Trading Score: 100 | |
| Day Percent Change: 0.18% Day Change: 0.01 | |
| Week Change: 6.55% Year-to-date Change: -9.7% | |
| ERIC Links: Profile News Message Board | |
| Charts:- Daily , Weekly | |
| Add ERIC to Watchlist: View: Get Complete ERIC Trend Analysis ➞ | |
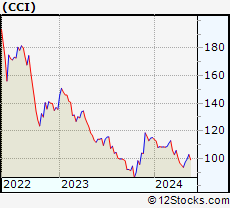 | CCI Crown Castle International Corp. (REIT) |
| Sector: Technology | |
| SubSector: Diversified Communication Services | |
| MarketCap: 57615.4 Millions | |
| Recent Price: 104.02 Smart Investing & Trading Score: 74 | |
| Day Percent Change: 0.48% Day Change: 0.50 | |
| Week Change: 4.53% Year-to-date Change: -9.7% | |
| CCI Links: Profile News Message Board | |
| Charts:- Daily , Weekly | |
| Add CCI to Watchlist: View: Get Complete CCI Trend Analysis ➞ | |
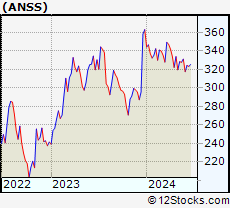 | ANSS ANSYS, Inc. |
| Sector: Technology | |
| SubSector: Application Software | |
| MarketCap: 19497.4 Millions | |
| Recent Price: 327.53 Smart Investing & Trading Score: 32 | |
| Day Percent Change: -0.71% Day Change: -2.35 | |
| Week Change: -0.22% Year-to-date Change: -9.7% | |
| ANSS Links: Profile News Message Board | |
| Charts:- Daily , Weekly | |
| Add ANSS to Watchlist: View: Get Complete ANSS Trend Analysis ➞ | |
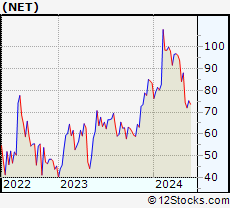 | NET Cloudflare, Inc. |
| Sector: Technology | |
| SubSector: Application Software | |
| MarketCap: 7063.72 Millions | |
| Recent Price: 75.14 Smart Investing & Trading Score: 49 | |
| Day Percent Change: 1.20% Day Change: 0.89 | |
| Week Change: 4.42% Year-to-date Change: -9.8% | |
| NET Links: Profile News Message Board | |
| Charts:- Daily , Weekly | |
| Add NET to Watchlist: View: Get Complete NET Trend Analysis ➞ | |
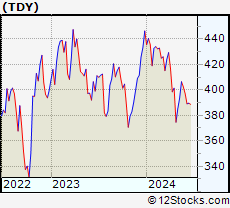 | TDY Teledyne Technologies Incorporated |
| Sector: Technology | |
| SubSector: Scientific & Technical Instruments | |
| MarketCap: 9360.43 Millions | |
| Recent Price: 402.26 Smart Investing & Trading Score: 64 | |
| Day Percent Change: -0.31% Day Change: -1.26 | |
| Week Change: 2.23% Year-to-date Change: -9.9% | |
| TDY Links: Profile News Message Board | |
| Charts:- Daily , Weekly | |
| Add TDY to Watchlist: View: Get Complete TDY Trend Analysis ➞ | |
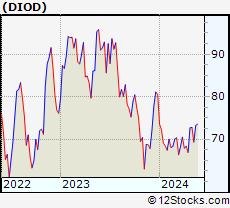 | DIOD Diodes Incorporated |
| Sector: Technology | |
| SubSector: Semiconductor - Integrated Circuits | |
| MarketCap: 1967.6 Millions | |
| Recent Price: 72.41 Smart Investing & Trading Score: 79 | |
| Day Percent Change: 0.56% Day Change: 0.40 | |
| Week Change: 4.46% Year-to-date Change: -10.1% | |
| DIOD Links: Profile News Message Board | |
| Charts:- Daily , Weekly | |
| Add DIOD to Watchlist: View: Get Complete DIOD Trend Analysis ➞ | |
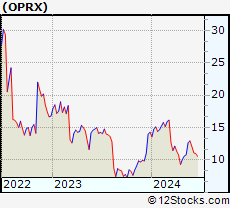 | OPRX OptimizeRx Corporation |
| Sector: Technology | |
| SubSector: Healthcare Information Services | |
| MarketCap: 107.155 Millions | |
| Recent Price: 12.85 Smart Investing & Trading Score: 67 | |
| Day Percent Change: -2.43% Day Change: -0.32 | |
| Week Change: 18.87% Year-to-date Change: -10.2% | |
| OPRX Links: Profile News Message Board | |
| Charts:- Daily , Weekly | |
| Add OPRX to Watchlist: View: Get Complete OPRX Trend Analysis ➞ | |
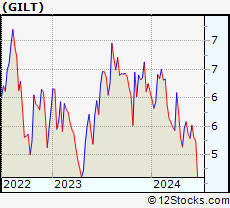 | GILT Gilat Satellite Networks Ltd. |
| Sector: Technology | |
| SubSector: Communication Equipment | |
| MarketCap: 343.739 Millions | |
| Recent Price: 5.48 Smart Investing & Trading Score: 25 | |
| Day Percent Change: -1.08% Day Change: -0.06 | |
| Week Change: -1.79% Year-to-date Change: -10.3% | |
| GILT Links: Profile News Message Board | |
| Charts:- Daily , Weekly | |
| Add GILT to Watchlist: View: Get Complete GILT Trend Analysis ➞ | |
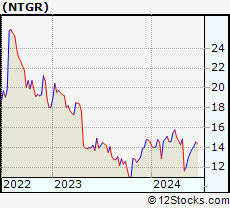 | NTGR NETGEAR, Inc. |
| Sector: Technology | |
| SubSector: Communication Equipment | |
| MarketCap: 558.839 Millions | |
| Recent Price: 13.06 Smart Investing & Trading Score: 49 | |
| Day Percent Change: -0.15% Day Change: -0.02 | |
| Week Change: 8.47% Year-to-date Change: -10.4% | |
| NTGR Links: Profile News Message Board | |
| Charts:- Daily , Weekly | |
| Add NTGR to Watchlist: View: Get Complete NTGR Trend Analysis ➞ | |
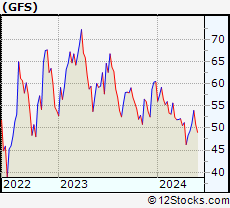 | GFS GLOBALFOUNDRIES Inc. |
| Sector: Technology | |
| SubSector: Semiconductors | |
| MarketCap: 35570 Millions | |
| Recent Price: 54.18 Smart Investing & Trading Score: 57 | |
| Day Percent Change: -0.53% Day Change: -0.29 | |
| Week Change: 6.05% Year-to-date Change: -10.5% | |
| GFS Links: Profile News Message Board | |
| Charts:- Daily , Weekly | |
| Add GFS to Watchlist: View: Get Complete GFS Trend Analysis ➞ | |
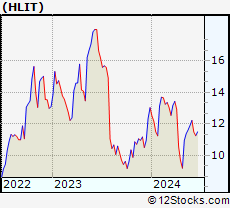 | HLIT Harmonic Inc. |
| Sector: Technology | |
| SubSector: Communication Equipment | |
| MarketCap: 533.539 Millions | |
| Recent Price: 11.67 Smart Investing & Trading Score: 69 | |
| Day Percent Change: 3.27% Day Change: 0.37 | |
| Week Change: 2.46% Year-to-date Change: -10.5% | |
| HLIT Links: Profile News Message Board | |
| Charts:- Daily , Weekly | |
| Add HLIT to Watchlist: View: Get Complete HLIT Trend Analysis ➞ | |
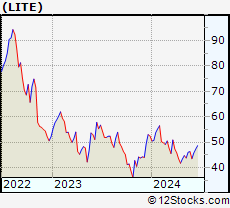 | LITE Lumentum Holdings Inc. |
| Sector: Technology | |
| SubSector: Communication Equipment | |
| MarketCap: 4990.49 Millions | |
| Recent Price: 46.80 Smart Investing & Trading Score: 67 | |
| Day Percent Change: 2.36% Day Change: 1.08 | |
| Week Change: 6.87% Year-to-date Change: -10.7% | |
| LITE Links: Profile News Message Board | |
| Charts:- Daily , Weekly | |
| Add LITE to Watchlist: View: Get Complete LITE Trend Analysis ➞ | |
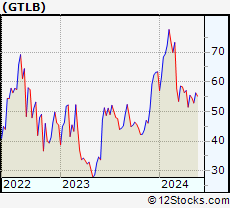 | GTLB GitLab Inc. |
| Sector: Technology | |
| SubSector: Software - Application | |
| MarketCap: 7840 Millions | |
| Recent Price: 56.50 Smart Investing & Trading Score: 64 | |
| Day Percent Change: -1.05% Day Change: -0.60 | |
| Week Change: 6.87% Year-to-date Change: -10.8% | |
| GTLB Links: Profile News Message Board | |
| Charts:- Daily , Weekly | |
| Add GTLB to Watchlist: View: Get Complete GTLB Trend Analysis ➞ | |
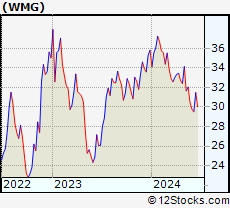 | WMG Warner Music Group Corp. |
| Sector: Technology | |
| SubSector: Entertainment | |
| MarketCap: 17237 Millions | |
| Recent Price: 31.89 Smart Investing & Trading Score: 10 | |
| Day Percent Change: -2.21% Day Change: -0.72 | |
| Week Change: 0.76% Year-to-date Change: -10.9% | |
| WMG Links: Profile News Message Board | |
| Charts:- Daily , Weekly | |
| Add WMG to Watchlist: View: Get Complete WMG Trend Analysis ➞ | |
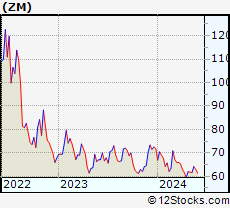 | ZM Zoom Video Communications, Inc. |
| Sector: Technology | |
| SubSector: Application Software | |
| MarketCap: 36358.1 Millions | |
| Recent Price: 63.96 Smart Investing & Trading Score: 62 | |
| Day Percent Change: 0.24% Day Change: 0.15 | |
| Week Change: 3.88% Year-to-date Change: -11.1% | |
| ZM Links: Profile News Message Board | |
| Charts:- Daily , Weekly | |
| Add ZM to Watchlist: View: Get Complete ZM Trend Analysis ➞ | |
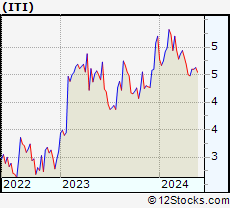 | ITI Iteris, Inc. |
| Sector: Technology | |
| SubSector: Communication Equipment | |
| MarketCap: 129.939 Millions | |
| Recent Price: 4.62 Smart Investing & Trading Score: 57 | |
| Day Percent Change: 2.90% Day Change: 0.13 | |
| Week Change: 0.43% Year-to-date Change: -11.2% | |
| ITI Links: Profile News Message Board | |
| Charts:- Daily , Weekly | |
| Add ITI to Watchlist: View: Get Complete ITI Trend Analysis ➞ | |
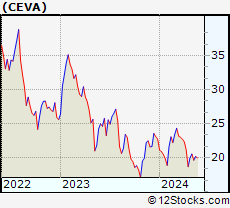 | CEVA CEVA, Inc. |
| Sector: Technology | |
| SubSector: Semiconductor - Specialized | |
| MarketCap: 587.06 Millions | |
| Recent Price: 20.16 Smart Investing & Trading Score: 62 | |
| Day Percent Change: -1.18% Day Change: -0.24 | |
| Week Change: 2.8% Year-to-date Change: -11.2% | |
| CEVA Links: Profile News Message Board | |
| Charts:- Daily , Weekly | |
| Add CEVA to Watchlist: View: Get Complete CEVA Trend Analysis ➞ | |
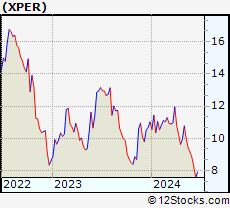 | XPER Xperi Corporation |
| Sector: Technology | |
| SubSector: Semiconductor Equipment & Materials | |
| MarketCap: 631.618 Millions | |
| Recent Price: 9.78 Smart Investing & Trading Score: 8 | |
| Day Percent Change: -2.30% Day Change: -0.23 | |
| Week Change: -2.1% Year-to-date Change: -11.3% | |
| XPER Links: Profile News Message Board | |
| Charts:- Daily , Weekly | |
| Add XPER to Watchlist: View: Get Complete XPER Trend Analysis ➞ | |
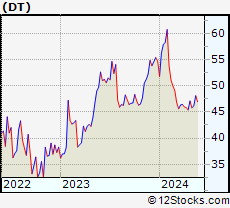 | DT Dynatrace, Inc. |
| Sector: Technology | |
| SubSector: Application Software | |
| MarketCap: 7007.12 Millions | |
| Recent Price: 48.47 Smart Investing & Trading Score: 64 | |
| Day Percent Change: 1.51% Day Change: 0.72 | |
| Week Change: 4.91% Year-to-date Change: -11.4% | |
| DT Links: Profile News Message Board | |
| Charts:- Daily , Weekly | |
| Add DT to Watchlist: View: Get Complete DT Trend Analysis ➞ | |
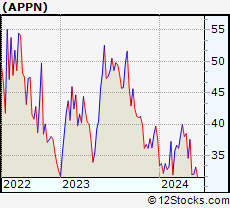 | APPN Appian Corporation |
| Sector: Technology | |
| SubSector: Application Software | |
| MarketCap: 2737.92 Millions | |
| Recent Price: 33.37 Smart Investing & Trading Score: 25 | |
| Day Percent Change: -0.21% Day Change: -0.07 | |
| Week Change: 4.12% Year-to-date Change: -11.4% | |
| APPN Links: Profile News Message Board | |
| Charts:- Daily , Weekly | |
| Add APPN to Watchlist: View: Get Complete APPN Trend Analysis ➞ | |
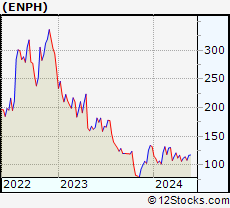 | ENPH Enphase Energy, Inc. |
| Sector: Technology | |
| SubSector: Semiconductor Equipment & Materials | |
| MarketCap: 4047.48 Millions | |
| Recent Price: 116.89 Smart Investing & Trading Score: 74 | |
| Day Percent Change: 1.22% Day Change: 1.41 | |
| Week Change: 7.88% Year-to-date Change: -11.5% | |
| ENPH Links: Profile News Message Board | |
| Charts:- Daily , Weekly | |
| Add ENPH to Watchlist: View: Get Complete ENPH Trend Analysis ➞ | |
| For tabular summary view of above stock list: Summary View ➞ 0 - 25 , 25 - 50 , 50 - 75 , 75 - 100 , 100 - 125 , 125 - 150 , 150 - 175 , 175 - 200 , 200 - 225 , 225 - 250 , 250 - 275 , 275 - 300 , 300 - 325 , 325 - 350 , 350 - 375 , 375 - 400 , 400 - 425 , 425 - 450 , 450 - 475 , 475 - 500 , 500 - 525 , 525 - 550 , 550 - 575 , 575 - 600 , 600 - 625 , 625 - 650 | ||
| Click To Change The Sort Order: By Market Cap or Company Size Performance: Year-to-date, Week and Day | |
| Select Chart Type: | ||
|
Best Stocks Today 12Stocks.com |
© 2024 12Stocks.com Terms & Conditions Privacy Contact Us
All Information Provided Only For Education And Not To Be Used For Investing or Trading. See Terms & Conditions


One More Thing ... Get Best Stocks Delivered Daily!
Never Ever Miss A Move With Our Top Ten Stocks Lists
Find Best Stocks In Any Market - Bull or Bear Market
Take A Peek At Our Top Ten Stocks Lists: Daily, Weekly, Year-to-Date & Top Trends
Find Best Stocks In Any Market - Bull or Bear Market
Take A Peek At Our Top Ten Stocks Lists: Daily, Weekly, Year-to-Date & Top Trends
Technology Stocks With Best Up Trends [0-bearish to 100-bullish]: Orion Energy[100], iQIYI [100], GDS [100], Omnicell [100], Mercury Systems[100], Synchronoss [100], Viomi [100], Marvell [100], Sea [100], Turkcell Iletisim[100], Himax [100]
Best Technology Stocks Year-to-Date:
MicroCloud Hologram[449.64%], Uxin [403.57%], Bakkt [370.4%], MediaCo Holding[256.81%], Smith Micro[224.46%], Super Micro[218.16%], CXApp [147.1%], SoundHound AI[138.79%], MicroStrategy [127.98%], AppLovin [109.15%], CuriosityStream [99.96%] Best Technology Stocks This Week:
Maxeon Solar[49.31%], SunPower [43.04%], Uxin [40.64%], Synchronoss [33.17%], Tigo Energy[32.41%], on [26.45%], LivePerson [25.76%], monday.com [25.66%], Viomi [24.55%], MicroStrategy [21.98%], Agilysys [21.01%] Best Technology Stocks Daily:
Maxeon Solar[26.56%], Orion Energy[16.94%], Comtech Tele[12.92%], iQIYI [12.21%], Extreme Networks[10.52%], NextNav [8.96%], Agora [8.46%], iCAD [7.88%], GDS [7.45%], Omnicell [5.99%], SunPower [5.79%]