
 Login Sign Up


| |||||
 |  | ||||

| 12Stocks.com Market Intelligence |
Best MidCap Stocks
|
| In a hurry? Mid Cap Stocks Lists: Performance Trends Table, Stock Charts
Sort midcap stocks: Daily, Weekly, Year-to-Date, Market Cap & Trends. Filter midcap stocks list by sector: Show all, Tech, Finance, Energy, Staples, Retail, Industrial, Materials, Utilities and HealthCare Filter midcap stocks list by size:All MidCap Large Mid-Range Small |
| 12Stocks.com Mid Cap Stocks Performances & Trends Daily | |||||||||
|
|  The overall Smart Investing & Trading Score is 76 (0-bearish to 100-bullish) which puts Mid Cap index in short term neutral to bullish trend. The Smart Investing & Trading Score from previous trading session is 75 and hence an improvement of trend.
| ||||||||
Here are the Smart Investing & Trading Scores of the most requested mid cap stocks at 12Stocks.com (click stock name for detailed review):
|


| 12Stocks.com: Top Performing Mid Cap Index Stocks | ||||||||||||||||||||||||||||||||||||||||||||||||
 The top performing Mid Cap Index stocks year to date are
Now, more recently, over last week, the top performing Mid Cap Index stocks on the move are


|
||||||||||||||||||||||||||||||||||||||||||||||||
| 12Stocks.com: Investing in Midcap Index with Stocks | |
|
The following table helps investors and traders sort through current performance and trends (as measured by Smart Investing & Trading Score) of various
stocks in the Midcap Index. Quick View: Move mouse or cursor over stock symbol (ticker) to view short-term technical chart and over stock name to view long term chart. Click on  to add stock symbol to your watchlist and to add stock symbol to your watchlist and  to view watchlist. Click on any ticker or stock name for detailed market intelligence report for that stock. to view watchlist. Click on any ticker or stock name for detailed market intelligence report for that stock. |
12Stocks.com Performance of Stocks in Midcap Index
| Ticker | Stock Name | Watchlist | Category | Recent Price | Smart Investing & Trading Score | Change % | YTD Change% |
| AZEK | AZEK |   | Industrials | 46.39 | 7 | 0.30% | 21.28% |
| CARR | Carrier Global | | Industrials | 66.20 | 90 | 0.33% | 15.23% |
| OTIS | Otis Worldwide | | Industrials | 97.33 | 76 | 0.26% | 8.79% |
| RSG | Republic Services | | Industrials | 186.38 | 51 | 0.22% | 13.02% |
| CMI | Cummins | | Industrials | 284.94 | 58 | 0.04% | 18.94% |
| TDG | TransDigm | | Industrials | 1322.39 | 85 | 0.73% | 30.72% |
| AME | AMETEK | | Industrials | 167.78 | 32 | -0.49% | 1.75% |
| ROK | Rockwell Automation | | Industrials | 272.29 | 18 | 0.39% | -12.30% |
| PH | Parker-Hannifin | | Industrials | 546.01 | 73 | -0.36% | 18.52% |
| SWK | Stanley Black | | Industrials | 88.75 | 25 | -0.90% | -9.53% |
| DHI | D.R. Horton | | Industrials | 148.94 | 38 | -0.57% | -2.00% |
| WY | Weyerhaeuser | | Industrials | 30.59 | 10 | -1.02% | -12.01% |
| VMC | Vulcan Materials | | Industrials | 257.20 | 0 | -1.16% | 13.30% |
| XYL | Xylem | | Industrials | 144.65 | 90 | -0.77% | 26.49% |
| LEN | Lennar | | Industrials | 162.21 | 58 | -0.90% | 8.83% |
| DOV | Dover | | Industrials | 184.78 | 58 | -0.16% | 20.14% |
| MLM | Martin Marietta | | Industrials | 573.18 | 0 | -1.70% | 14.89% |
| HEI | HEICO | | Industrials | 215.54 | 73 | 0.25% | 20.50% |
| NVR | NVR | | Industrials | 7629.86 | 28 | -0.62% | 8.99% |
| IEX | IDEX | | Industrials | 217.63 | 0 | -0.98% | 0.24% |
| CNHI | CNH Industrial | | Industrials | 11.14 | 10 | -2.71% | -8.54% |
| IR | Ingersoll Rand | | Industrials | 94.48 | 90 | 0.36% | 22.16% |
| MAS | Masco | | Industrials | 69.64 | 8 | 0.16% | 3.97% |
| GGG | Graco | | Industrials | 82.95 | 32 | -0.73% | -4.39% |
| LII | Lennox | | Industrials | 487.71 | 51 | -0.65% | 8.98% |
| For chart view version of above stock list: Chart View ➞ 0 - 25 , 25 - 50 , 50 - 75 | ||
 | Click To Change The Sort Order: By Market Cap or Company Size Performance: Year-to-date, Week and Day |  |
|
Get the most comprehensive stock market coverage daily at 12Stocks.com ➞ Best Stocks Today ➞ Best Stocks Weekly ➞ Best Stocks Year-to-Date ➞ Best Stocks Trends ➞  Best Stocks Today 12Stocks.com Best Nasdaq Stocks ➞ Best S&P 500 Stocks ➞ Best Tech Stocks ➞ Best Biotech Stocks ➞ |
| Detailed Overview of Midcap Stocks |
| Midcap Technical Overview, Leaders & Laggards, Top Midcap ETF Funds & Detailed Midcap Stocks List, Charts, Trends & More |
| Midcap: Technical Analysis, Trends & YTD Performance | |
| MidCap segment as represented by
MDY, an exchange-traded fund [ETF], holds basket of about four hundred midcap stocks from across all major sectors of the US stock market. The midcap index (contains stocks like Green Mountain Coffee Roasters and Tractor Supply Company) is up by 8.6% and is currently underperforming the overall market by -2.12% year-to-date. Below is a quick view of technical charts and trends: | |
 MDY Weekly Chart |
|
| Long Term Trend: Very Good | |
| Medium Term Trend: Very Good | |
 MDY Daily Chart |
|
| Short Term Trend: Not Good | |
| Overall Trend Score: 76 | |
| YTD Performance: 8.6% | |
| **Trend Scores & Views Are Only For Educational Purposes And Not For Investing | |
| 12Stocks.com: Investing in Midcap Index using Exchange Traded Funds | |
|
The following table shows list of key exchange traded funds (ETF) that
help investors track Midcap index. The following list also includes leveraged ETF funds that track twice or thrice the daily returns of Midcap indices. Short or inverse ETF funds move in the opposite direction to the index they track and are useful during market pullbacks or during bear markets. Quick View: Move mouse or cursor over ETF symbol (ticker) to view short-term technical chart and over ETF name to view long term chart. Click on ticker or stock name for detailed view. Click on to add stock symbol to your watchlist and to view watchlist. |
12Stocks.com List of ETFs that track Midcap Index
| Ticker | ETF Name | Watchlist | Recent Price | Smart Investing & Trading Score | Change % | Week % | Year-to-date % |
| IJH | iShares Core S&P Mid-Cap | | 60.28 | 69 | -0.10 | -0.05 | 8.75% |
| IWR | iShares Russell Mid-Cap | | 83.12 | 69 | -0.29 | -0.2 | 6.93% |
| MDY | SPDR S&P MidCap 400 ETF | | 551.01 | 76 | -0.13 | -0.12 | 8.6% |
| IWP | iShares Russell Mid-Cap Growth | | 111.78 | 56 | -0.46 | -0.21 | 7% |
| IWS | iShares Russell Mid-Cap Value | | 124.42 | 69 | -0.14 | -0.07 | 6.99% |
| MYY | ProShares Short MidCap400 | | 19.99 | 25 | 0.00 | -0.05 | -6.83% |
| UMDD | ProShares UltraPro MidCap400 | | 26.77 | 76 | -0.45 | -0.22 | 19.94% |
| SMDD | ProShares UltraPro Short MidCap400 | | 10.53 | 37 | 0.96 | 0.5 | -21.79% |
| MZZ | ProShares UltraShort MidCap400 | | 10.79 | 20 | -0.21 | -0.21 | -14.17% |
| 12Stocks.com: Charts, Trends, Fundamental Data and Performances of MidCap Stocks | |
|
We now take in-depth look at all MidCap stocks including charts, multi-period performances and overall trends (as measured by Smart Investing & Trading Score). One can sort MidCap stocks (click link to choose) by Daily, Weekly and by Year-to-Date performances. Also, one can sort by size of the company or by market capitalization. |
| Select Your Default Chart Type: | |||||
| |||||
| Click on stock symbol or name for detailed view. Click on to add stock symbol to your watchlist and to view watchlist. Quick View: Move mouse or cursor over "Daily" to quickly view daily technical stock chart and over "Weekly" to view weekly technical stock chart. | |||||

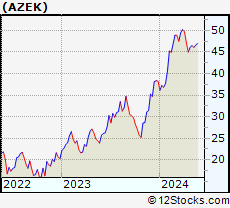 | AZEK The AZEK Company Inc. |
| Sector: Industrials | |
| SubSector: Building Products & Equipment | |
| MarketCap: 55127 Millions | |
| Recent Price: 46.39 Smart Investing & Trading Score: 7 | |
| Day Percent Change: 0.30% Day Change: 0.14 | |
| Week Change: -0.51% Year-to-date Change: 21.3% | |
| AZEK Links: Profile News Message Board | |
| Charts:- Daily , Weekly | |
| Add AZEK to Watchlist: View: Get Complete AZEK Trend Analysis ➞ | |
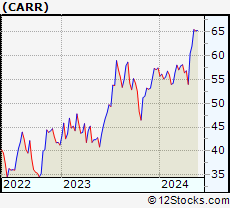 | CARR Carrier Global Corporation |
| Sector: Industrials | |
| SubSector: Building Products & Equipment | |
| MarketCap: 32547 Millions | |
| Recent Price: 66.20 Smart Investing & Trading Score: 90 | |
| Day Percent Change: 0.33% Day Change: 0.22 | |
| Week Change: 1.49% Year-to-date Change: 15.2% | |
| CARR Links: Profile News Message Board | |
| Charts:- Daily , Weekly | |
| Add CARR to Watchlist: View: Get Complete CARR Trend Analysis ➞ | |
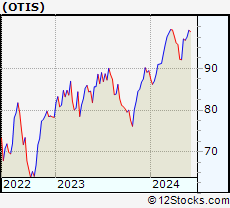 | OTIS Otis Worldwide Corporation |
| Sector: Industrials | |
| SubSector: Specialty Industrial Machinery | |
| MarketCap: 27727 Millions | |
| Recent Price: 97.33 Smart Investing & Trading Score: 76 | |
| Day Percent Change: 0.26% Day Change: 0.25 | |
| Week Change: 0.56% Year-to-date Change: 8.8% | |
| OTIS Links: Profile News Message Board | |
| Charts:- Daily , Weekly | |
| Add OTIS to Watchlist: View: Get Complete OTIS Trend Analysis ➞ | |
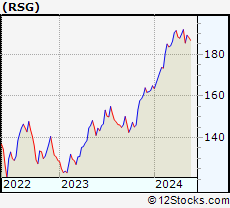 | RSG Republic Services, Inc. |
| Sector: Industrials | |
| SubSector: Waste Management | |
| MarketCap: 26178.6 Millions | |
| Recent Price: 186.38 Smart Investing & Trading Score: 51 | |
| Day Percent Change: 0.22% Day Change: 0.40 | |
| Week Change: -0.95% Year-to-date Change: 13.0% | |
| RSG Links: Profile News Message Board | |
| Charts:- Daily , Weekly | |
| Add RSG to Watchlist: View: Get Complete RSG Trend Analysis ➞ | |
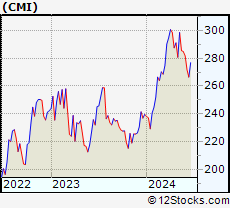 | CMI Cummins Inc. |
| Sector: Industrials | |
| SubSector: Diversified Machinery | |
| MarketCap: 19127.1 Millions | |
| Recent Price: 284.94 Smart Investing & Trading Score: 58 | |
| Day Percent Change: 0.04% Day Change: 0.11 | |
| Week Change: -0.22% Year-to-date Change: 18.9% | |
| CMI Links: Profile News Message Board | |
| Charts:- Daily , Weekly | |
| Add CMI to Watchlist: View: Get Complete CMI Trend Analysis ➞ | |
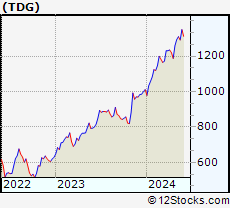 | TDG TransDigm Group Incorporated |
| Sector: Industrials | |
| SubSector: Aerospace/Defense Products & Services | |
| MarketCap: 18441 Millions | |
| Recent Price: 1322.39 Smart Investing & Trading Score: 85 | |
| Day Percent Change: 0.73% Day Change: 9.63 | |
| Week Change: 2.36% Year-to-date Change: 30.7% | |
| TDG Links: Profile News Message Board | |
| Charts:- Daily , Weekly | |
| Add TDG to Watchlist: View: Get Complete TDG Trend Analysis ➞ | |
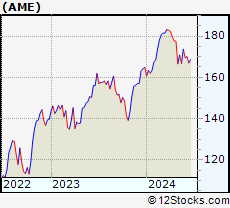 | AME AMETEK, Inc. |
| Sector: Industrials | |
| SubSector: Diversified Machinery | |
| MarketCap: 16611.8 Millions | |
| Recent Price: 167.78 Smart Investing & Trading Score: 32 | |
| Day Percent Change: -0.49% Day Change: -0.82 | |
| Week Change: 0.59% Year-to-date Change: 1.8% | |
| AME Links: Profile News Message Board | |
| Charts:- Daily , Weekly | |
| Add AME to Watchlist: View: Get Complete AME Trend Analysis ➞ | |
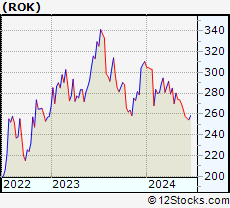 | ROK Rockwell Automation, Inc. |
| Sector: Industrials | |
| SubSector: Diversified Machinery | |
| MarketCap: 15666.1 Millions | |
| Recent Price: 272.29 Smart Investing & Trading Score: 18 | |
| Day Percent Change: 0.39% Day Change: 1.06 | |
| Week Change: 0.94% Year-to-date Change: -12.3% | |
| ROK Links: Profile News Message Board | |
| Charts:- Daily , Weekly | |
| Add ROK to Watchlist: View: Get Complete ROK Trend Analysis ➞ | |
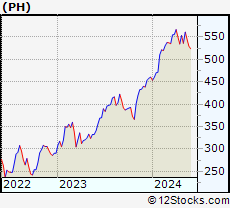 | PH Parker-Hannifin Corporation |
| Sector: Industrials | |
| SubSector: Industrial Equipment & Components | |
| MarketCap: 14888.9 Millions | |
| Recent Price: 546.01 Smart Investing & Trading Score: 73 | |
| Day Percent Change: -0.36% Day Change: -1.99 | |
| Week Change: 0.17% Year-to-date Change: 18.5% | |
| PH Links: Profile News Message Board | |
| Charts:- Daily , Weekly | |
| Add PH to Watchlist: View: Get Complete PH Trend Analysis ➞ | |
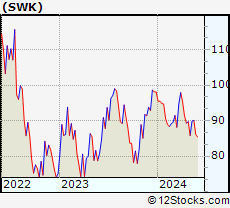 | SWK Stanley Black & Decker, Inc. |
| Sector: Industrials | |
| SubSector: Machine Tools & Accessories | |
| MarketCap: 14274.8 Millions | |
| Recent Price: 88.75 Smart Investing & Trading Score: 25 | |
| Day Percent Change: -0.90% Day Change: -0.81 | |
| Week Change: -1.52% Year-to-date Change: -9.5% | |
| SWK Links: Profile News Message Board | |
| Charts:- Daily , Weekly | |
| Add SWK to Watchlist: View: Get Complete SWK Trend Analysis ➞ | |
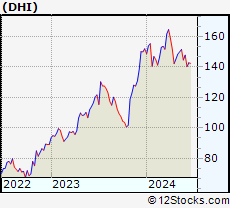 | DHI D.R. Horton, Inc. |
| Sector: Industrials | |
| SubSector: Residential Construction | |
| MarketCap: 13372.6 Millions | |
| Recent Price: 148.94 Smart Investing & Trading Score: 38 | |
| Day Percent Change: -0.57% Day Change: -0.85 | |
| Week Change: -1.69% Year-to-date Change: -2.0% | |
| DHI Links: Profile News Message Board | |
| Charts:- Daily , Weekly | |
| Add DHI to Watchlist: View: Get Complete DHI Trend Analysis ➞ | |
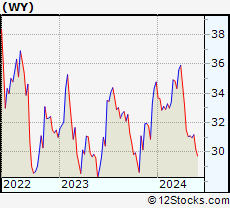 | WY Weyerhaeuser Company |
| Sector: Industrials | |
| SubSector: Lumber, Wood Production | |
| MarketCap: 13244.8 Millions | |
| Recent Price: 30.59 Smart Investing & Trading Score: 10 | |
| Day Percent Change: -1.02% Day Change: -0.32 | |
| Week Change: -1.84% Year-to-date Change: -12.0% | |
| WY Links: Profile News Message Board | |
| Charts:- Daily , Weekly | |
| Add WY to Watchlist: View: Get Complete WY Trend Analysis ➞ | |
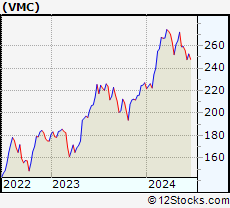 | VMC Vulcan Materials Company |
| Sector: Industrials | |
| SubSector: General Building Materials | |
| MarketCap: 12304.7 Millions | |
| Recent Price: 257.20 Smart Investing & Trading Score: 0 | |
| Day Percent Change: -1.16% Day Change: -3.01 | |
| Week Change: -0.73% Year-to-date Change: 13.3% | |
| VMC Links: Profile News Message Board | |
| Charts:- Daily , Weekly | |
| Add VMC to Watchlist: View: Get Complete VMC Trend Analysis ➞ | |
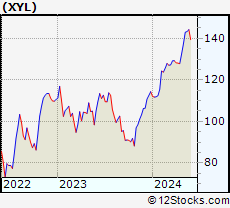 | XYL Xylem Inc. |
| Sector: Industrials | |
| SubSector: Diversified Machinery | |
| MarketCap: 12195.1 Millions | |
| Recent Price: 144.65 Smart Investing & Trading Score: 90 | |
| Day Percent Change: -0.77% Day Change: -1.12 | |
| Week Change: 0.93% Year-to-date Change: 26.5% | |
| XYL Links: Profile News Message Board | |
| Charts:- Daily , Weekly | |
| Add XYL to Watchlist: View: Get Complete XYL Trend Analysis ➞ | |
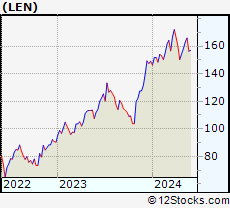 | LEN Lennar Corporation |
| Sector: Industrials | |
| SubSector: Residential Construction | |
| MarketCap: 11926.6 Millions | |
| Recent Price: 162.21 Smart Investing & Trading Score: 58 | |
| Day Percent Change: -0.90% Day Change: -1.46 | |
| Week Change: -2.22% Year-to-date Change: 8.8% | |
| LEN Links: Profile News Message Board | |
| Charts:- Daily , Weekly | |
| Add LEN to Watchlist: View: Get Complete LEN Trend Analysis ➞ | |
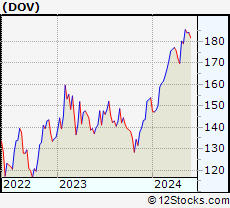 | DOV Dover Corporation |
| Sector: Industrials | |
| SubSector: Diversified Machinery | |
| MarketCap: 10725.6 Millions | |
| Recent Price: 184.78 Smart Investing & Trading Score: 58 | |
| Day Percent Change: -0.16% Day Change: -0.30 | |
| Week Change: 0.37% Year-to-date Change: 20.1% | |
| DOV Links: Profile News Message Board | |
| Charts:- Daily , Weekly | |
| Add DOV to Watchlist: View: Get Complete DOV Trend Analysis ➞ | |
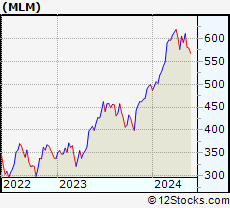 | MLM Martin Marietta Materials, Inc. |
| Sector: Industrials | |
| SubSector: General Building Materials | |
| MarketCap: 10624.3 Millions | |
| Recent Price: 573.18 Smart Investing & Trading Score: 0 | |
| Day Percent Change: -1.70% Day Change: -9.92 | |
| Week Change: -1.3% Year-to-date Change: 14.9% | |
| MLM Links: Profile News Message Board | |
| Charts:- Daily , Weekly | |
| Add MLM to Watchlist: View: Get Complete MLM Trend Analysis ➞ | |
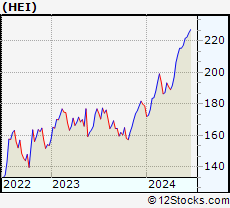 | HEI HEICO Corporation |
| Sector: Industrials | |
| SubSector: Aerospace/Defense Products & Services | |
| MarketCap: 10023.1 Millions | |
| Recent Price: 215.54 Smart Investing & Trading Score: 73 | |
| Day Percent Change: 0.25% Day Change: 0.54 | |
| Week Change: 0% Year-to-date Change: 20.5% | |
| HEI Links: Profile News Message Board | |
| Charts:- Daily , Weekly | |
| Add HEI to Watchlist: View: Get Complete HEI Trend Analysis ➞ | |
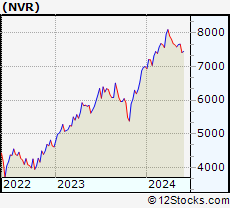 | NVR NVR, Inc. |
| Sector: Industrials | |
| SubSector: Residential Construction | |
| MarketCap: 9912.56 Millions | |
| Recent Price: 7629.86 Smart Investing & Trading Score: 28 | |
| Day Percent Change: -0.62% Day Change: -47.90 | |
| Week Change: -0.51% Year-to-date Change: 9.0% | |
| NVR Links: Profile News Message Board | |
| Charts:- Daily , Weekly | |
| Add NVR to Watchlist: View: Get Complete NVR Trend Analysis ➞ | |
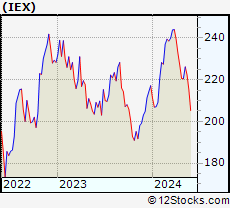 | IEX IDEX Corporation |
| Sector: Industrials | |
| SubSector: Diversified Machinery | |
| MarketCap: 9721.46 Millions | |
| Recent Price: 217.63 Smart Investing & Trading Score: 0 | |
| Day Percent Change: -0.98% Day Change: -2.16 | |
| Week Change: -2.11% Year-to-date Change: 0.2% | |
| IEX Links: Profile News Message Board | |
| Charts:- Daily , Weekly | |
| Add IEX to Watchlist: View: Get Complete IEX Trend Analysis ➞ | |
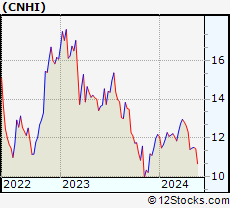 | CNHI CNH Industrial N.V. |
| Sector: Industrials | |
| SubSector: Farm & Construction Machinery | |
| MarketCap: 9366.57 Millions | |
| Recent Price: 11.14 Smart Investing & Trading Score: 10 | |
| Day Percent Change: -2.71% Day Change: -0.31 | |
| Week Change: -2.71% Year-to-date Change: -8.5% | |
| CNHI Links: Profile News Message Board | |
| Charts:- Daily , Weekly | |
| Add CNHI to Watchlist: View: Get Complete CNHI Trend Analysis ➞ | |
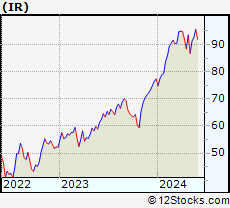 | IR Ingersoll Rand Inc. |
| Sector: Industrials | |
| SubSector: Diversified Machinery | |
| MarketCap: 8970.56 Millions | |
| Recent Price: 94.48 Smart Investing & Trading Score: 90 | |
| Day Percent Change: 0.36% Day Change: 0.34 | |
| Week Change: 1.98% Year-to-date Change: 22.2% | |
| IR Links: Profile News Message Board | |
| Charts:- Daily , Weekly | |
| Add IR to Watchlist: View: Get Complete IR Trend Analysis ➞ | |
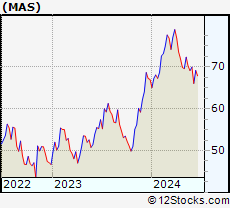 | MAS Masco Corporation |
| Sector: Industrials | |
| SubSector: General Building Materials | |
| MarketCap: 8655.63 Millions | |
| Recent Price: 69.64 Smart Investing & Trading Score: 8 | |
| Day Percent Change: 0.16% Day Change: 0.11 | |
| Week Change: -0.74% Year-to-date Change: 4.0% | |
| MAS Links: Profile News Message Board | |
| Charts:- Daily , Weekly | |
| Add MAS to Watchlist: View: Get Complete MAS Trend Analysis ➞ | |
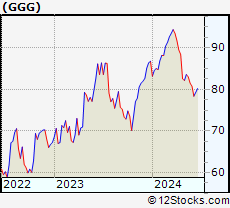 | GGG Graco Inc. |
| Sector: Industrials | |
| SubSector: Diversified Machinery | |
| MarketCap: 7739.76 Millions | |
| Recent Price: 82.95 Smart Investing & Trading Score: 32 | |
| Day Percent Change: -0.73% Day Change: -0.61 | |
| Week Change: -0.08% Year-to-date Change: -4.4% | |
| GGG Links: Profile News Message Board | |
| Charts:- Daily , Weekly | |
| Add GGG to Watchlist: View: Get Complete GGG Trend Analysis ➞ | |
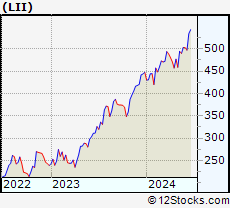 | LII Lennox International Inc. |
| Sector: Industrials | |
| SubSector: Diversified Machinery | |
| MarketCap: 7720.66 Millions | |
| Recent Price: 487.71 Smart Investing & Trading Score: 51 | |
| Day Percent Change: -0.65% Day Change: -3.21 | |
| Week Change: -0.44% Year-to-date Change: 9.0% | |
| LII Links: Profile News Message Board | |
| Charts:- Daily , Weekly | |
| Add LII to Watchlist: View: Get Complete LII Trend Analysis ➞ | |
| For tabular summary view of above stock list: Summary View ➞ 0 - 25 , 25 - 50 , 50 - 75 | ||
| Click To Change The Sort Order: By Market Cap or Company Size Performance: Year-to-date, Week and Day | |
| Select Chart Type: | ||
|
Best Stocks Today 12Stocks.com |
© 2024 12Stocks.com Terms & Conditions Privacy Contact Us
All Information Provided Only For Education And Not To Be Used For Investing or Trading. See Terms & Conditions


One More Thing ... Get Best Stocks Delivered Daily!
Never Ever Miss A Move With Our Top Ten Stocks Lists
Find Best Stocks In Any Market - Bull or Bear Market
Take A Peek At Our Top Ten Stocks Lists: Daily, Weekly, Year-to-Date & Top Trends
Find Best Stocks In Any Market - Bull or Bear Market
Take A Peek At Our Top Ten Stocks Lists: Daily, Weekly, Year-to-Date & Top Trends
Midcap Stocks With Best Up Trends [0-bearish to 100-bullish]: Alcoa [100], CAVA [100], Robinhood Markets[100], Arch Capital[100], Nutanix [100], National Oilwell[100], Live Nation[100], CenterPoint Energy[100], Xcel Energy[100], Lazard [100], Generac [100]
Best Midcap Stocks Year-to-Date:
AppLovin [110.72%], CAVA [87.4%], Constellation Energy[86.92%], EMCOR [78.66%], ShockWave Medical[73.37%], Tenet [72.99%], Celsius [72.16%], Natera [70.34%], Tandem Diabetes[69.57%], Pure Storage[67.33%], Maravai LifeSciences[66.18%] Best Midcap Stocks This Week:
AMC Entertainment[10.34%], Tandem Diabetes[8.41%], Alcoa [7.41%], Norwegian Cruise[7.33%], Exact Sciences[7.13%], Coinbase Global[6.55%], Carnival [6.43%], NovoCure [5.78%], Teradyne [5.53%], CAVA [5.43%], Generac [4.73%] Best Midcap Stocks Daily:
Coinbase Global[7.21%], Tandem Diabetes[6.20%], Exact Sciences[5.82%], First Solar[4.58%], Alcoa [4.10%], CAVA [3.55%], Constellation Energy[2.89%], Crocs [2.87%], Robinhood Markets[2.56%], Sunrun [2.23%], Spectrum [1.95%]