
 Login Sign Up


| |||||
 |  | ||||

| 12Stocks.com Market Intelligence |
Best MidCap Stocks
|
| In a hurry? Mid Cap Stocks Lists: Performance Trends Table, Stock Charts
Sort midcap stocks: Daily, Weekly, Year-to-Date, Market Cap & Trends. Filter midcap stocks list by sector: Show all, Tech, Finance, Energy, Staples, Retail, Industrial, Materials, Utilities and HealthCare Filter midcap stocks list by size:All MidCap Large Mid-Range Small |
| 12Stocks.com Mid Cap Stocks Performances & Trends Daily | |||||||||
|
|  The overall Smart Investing & Trading Score is 83 (0-bearish to 100-bullish) which puts Mid Cap index in short term bullish trend. The Smart Investing & Trading Score from previous trading session is 56 and hence an improvement of trend.
| ||||||||
Here are the Smart Investing & Trading Scores of the most requested mid cap stocks at 12Stocks.com (click stock name for detailed review):
|


| 12Stocks.com: Top Performing Mid Cap Index Stocks | ||||||||||||||||||||||||||||||||||||||||||||||||
 The top performing Mid Cap Index stocks year to date are
Now, more recently, over last week, the top performing Mid Cap Index stocks on the move are


|
||||||||||||||||||||||||||||||||||||||||||||||||
| 12Stocks.com: Investing in Midcap Index with Stocks | |
|
The following table helps investors and traders sort through current performance and trends (as measured by Smart Investing & Trading Score) of various
stocks in the Midcap Index. Quick View: Move mouse or cursor over stock symbol (ticker) to view short-term technical chart and over stock name to view long term chart. Click on  to add stock symbol to your watchlist and to add stock symbol to your watchlist and  to view watchlist. Click on any ticker or stock name for detailed market intelligence report for that stock. to view watchlist. Click on any ticker or stock name for detailed market intelligence report for that stock. |
12Stocks.com Performance of Stocks in Midcap Index
| Ticker | Stock Name | Watchlist | Category | Recent Price | Smart Investing & Trading Score | Change % | YTD Change% |
| VTR | Ventas |   | Financials | 50.26 | 100 | 2.57% | 0.84% |
| JKHY | Jack Henry | | Technology | 164.68 | 40 | 2.19% | 0.78% |
| TPX | Tempur Sealy | | Consumer Staples | 51.36 | 32 | 1.68% | 0.77% |
| RNG | RingCentral | | Technology | 34.20 | 51 | -0.26% | 0.74% |
| PTC | PTC | | Technology | 176.24 | 15 | 1.37% | 0.73% |
| MORN | Morningstar | | Technology | 288.25 | 7 | 0.29% | 0.70% |
| PFGC | Performance Food | | Services & Goods | 69.60 | 32 | 2.28% | 0.65% |
| RPM | RPM | | Materials | 112.10 | 57 | 1.94% | 0.42% |
| LNT | Alliant Energy | | Utilities | 51.49 | 68 | 2.65% | 0.37% |
| CF | CF Industries | | Materials | 79.73 | 74 | 3.57% | 0.29% |
| AMH | American Homes | | Financials | 36.04 | 47 | 1.09% | 0.22% |
| LYV | Live Nation | | Services & Goods | 93.74 | 0 | 0.45% | 0.15% |
| TECH | Bio-Techne | | Health Care | 77.19 | 51 | -0.08% | 0.04% |
| ATO | Atmos Energy | | Utilities | 115.92 | 58 | 2.96% | 0.02% |
| FNB | F.N.B | | Financials | 13.77 | 61 | 1.03% | 0.00% |
| CHRW | C.H. Robinson | | Transports | 86.37 | 93 | 1.74% | -0.02% |
| CHH | Choice Hotels | | Services & Goods | 113.19 | 58 | 2.30% | -0.10% |
| RF | Regions Financial | | Financials | 19.35 | 68 | 1.84% | -0.15% |
| OMF | OneMain | | Financials | 49.12 | 58 | 1.36% | -0.16% |
| NTRS | Northern Trust | | Financials | 84.24 | 68 | 1.62% | -0.17% |
| KEY | KeyCorp | | Financials | 14.37 | 45 | 2.72% | -0.21% |
| COO | Cooper | | Health Care | 94.31 | 75 | 4.52% | -0.32% |
| OLN | Olin | | Materials | 53.76 | 48 | 0.86% | -0.35% |
| TTWO | Take-Two Interactive | | Technology | 160.36 | 95 | 0.36% | -0.37% |
| QGEN | QIAGEN N.V | | Services & Goods | 43.26 | 76 | 1.45% | -0.39% |
| For chart view version of above stock list: Chart View ➞ 0 - 25 , 25 - 50 , 50 - 75 , 75 - 100 , 100 - 125 , 125 - 150 , 150 - 175 , 175 - 200 , 200 - 225 , 225 - 250 , 250 - 275 , 275 - 300 , 300 - 325 , 325 - 350 , 350 - 375 , 375 - 400 , 400 - 425 , 425 - 450 , 450 - 475 , 475 - 500 , 500 - 525 , 525 - 550 , 550 - 575 , 575 - 600 , 600 - 625 , 625 - 650 , 650 - 675 , 675 - 700 , 700 - 725 , 725 - 750 , 750 - 775 | ||
 | Click To Change The Sort Order: By Market Cap or Company Size Performance: Year-to-date, Week and Day |  |
|
Get the most comprehensive stock market coverage daily at 12Stocks.com ➞ Best Stocks Today ➞ Best Stocks Weekly ➞ Best Stocks Year-to-Date ➞ Best Stocks Trends ➞  Best Stocks Today 12Stocks.com Best Nasdaq Stocks ➞ Best S&P 500 Stocks ➞ Best Tech Stocks ➞ Best Biotech Stocks ➞ |
| Detailed Overview of Midcap Stocks |
| Midcap Technical Overview, Leaders & Laggards, Top Midcap ETF Funds & Detailed Midcap Stocks List, Charts, Trends & More |
| Midcap: Technical Analysis, Trends & YTD Performance | |
| MidCap segment as represented by
MDY, an exchange-traded fund [ETF], holds basket of about four hundred midcap stocks from across all major sectors of the US stock market. The midcap index (contains stocks like Green Mountain Coffee Roasters and Tractor Supply Company) is up by 7.65% and is currently underperforming the overall market by -2.14% year-to-date. Below is a quick view of technical charts and trends: | |
 MDY Weekly Chart |
|
| Long Term Trend: Very Good | |
| Medium Term Trend: Good | |
 MDY Daily Chart |
|
| Short Term Trend: Very Good | |
| Overall Trend Score: 83 | |
| YTD Performance: 7.65% | |
| **Trend Scores & Views Are Only For Educational Purposes And Not For Investing | |
| 12Stocks.com: Investing in Midcap Index using Exchange Traded Funds | |
|
The following table shows list of key exchange traded funds (ETF) that
help investors track Midcap index. The following list also includes leveraged ETF funds that track twice or thrice the daily returns of Midcap indices. Short or inverse ETF funds move in the opposite direction to the index they track and are useful during market pullbacks or during bear markets. Quick View: Move mouse or cursor over ETF symbol (ticker) to view short-term technical chart and over ETF name to view long term chart. Click on ticker or stock name for detailed view. Click on to add stock symbol to your watchlist and to view watchlist. |
12Stocks.com List of ETFs that track Midcap Index
| Ticker | ETF Name | Watchlist | Recent Price | Smart Investing & Trading Score | Change % | Week % | Year-to-date % |
| IJH | iShares Core S&P Mid-Cap | | 59.68 | 83 | 1.31 | 0.27 | 7.67% |
| MDY | SPDR S&P MidCap 400 ETF | | 546.18 | 83 | 1.32 | 0.29 | 7.65% |
| IWR | iShares Russell Mid-Cap | | 81.91 | 71 | 0.91 | -0.65 | 5.38% |
| IWP | iShares Russell Mid-Cap Growth | | 108.67 | 8 | 0.21 | -2.18 | 4.03% |
| IWS | iShares Russell Mid-Cap Value | | 123.18 | 83 | 1.27 | -0.02 | 5.92% |
| IJK | iShares S&P Mid-Cap 400 Growth | | 88.41 | 46 | -0.32 | -1.5 | 11.6% |
| UMDD | ProShares UltraPro MidCap400 | | 25.80 | 83 | 3.74 | 0.49 | 15.59% |
| IJJ | iShares S&P Mid-Cap 400 Value | | 114.94 | 63 | 0.45 | -0.39 | 0.79% |
| MYY | ProShares Short MidCap400 | | 20.24 | 25 | -1.20 | -0.26 | -5.64% |
| SMDD | ProShares UltraPro Short MidCap400 | | 10.84 | 17 | -3.99 | -0.66 | -19.49% |
| XMLV | PowerShares S&P MidCap Low Volatil ETF | | 55.65 | 61 | 0.67 | -0.47 | 4.64% |
| MVV | ProShares Ultra MidCap400 | | 63.30 | 63 | 0.08 | -2.01 | 9.35% |
| MZZ | ProShares UltraShort MidCap400 | | 11.08 | 27 | -2.35 | -0.36 | -11.83% |
| 12Stocks.com: Charts, Trends, Fundamental Data and Performances of MidCap Stocks | |
|
We now take in-depth look at all MidCap stocks including charts, multi-period performances and overall trends (as measured by Smart Investing & Trading Score). One can sort MidCap stocks (click link to choose) by Daily, Weekly and by Year-to-Date performances. Also, one can sort by size of the company or by market capitalization. |
| Select Your Default Chart Type: | |||||
| |||||
| Click on stock symbol or name for detailed view. Click on to add stock symbol to your watchlist and to view watchlist. Quick View: Move mouse or cursor over "Daily" to quickly view daily technical stock chart and over "Weekly" to view weekly technical stock chart. | |||||

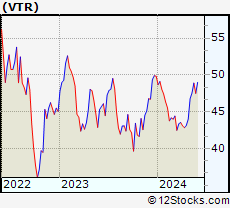 | VTR Ventas, Inc. |
| Sector: Financials | |
| SubSector: REIT - Healthcare Facilities | |
| MarketCap: 11180.4 Millions | |
| Recent Price: 50.26 Smart Investing & Trading Score: 100 | |
| Day Percent Change: 2.57% Day Change: 1.26 | |
| Week Change: 5.81% Year-to-date Change: 0.8% | |
| VTR Links: Profile News Message Board | |
| Charts:- Daily , Weekly | |
| Add VTR to Watchlist: View: Get Complete VTR Trend Analysis ➞ | |
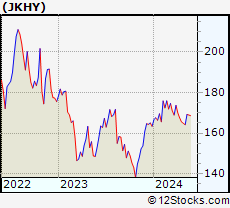 | JKHY Jack Henry & Associates, Inc. |
| Sector: Technology | |
| SubSector: Information Technology Services | |
| MarketCap: 10695.4 Millions | |
| Recent Price: 164.68 Smart Investing & Trading Score: 40 | |
| Day Percent Change: 2.19% Day Change: 3.53 | |
| Week Change: -2.33% Year-to-date Change: 0.8% | |
| JKHY Links: Profile News Message Board | |
| Charts:- Daily , Weekly | |
| Add JKHY to Watchlist: View: Get Complete JKHY Trend Analysis ➞ | |
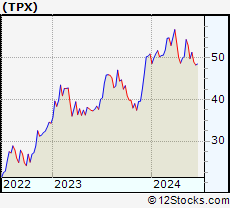 | TPX Tempur Sealy International, Inc. |
| Sector: Consumer Staples | |
| SubSector: Home Furnishings & Fixtures | |
| MarketCap: 1984.35 Millions | |
| Recent Price: 51.36 Smart Investing & Trading Score: 32 | |
| Day Percent Change: 1.68% Day Change: 0.85 | |
| Week Change: 3.03% Year-to-date Change: 0.8% | |
| TPX Links: Profile News Message Board | |
| Charts:- Daily , Weekly | |
| Add TPX to Watchlist: View: Get Complete TPX Trend Analysis ➞ | |
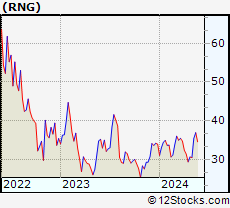 | RNG RingCentral, Inc. |
| Sector: Technology | |
| SubSector: Application Software | |
| MarketCap: 17755.3 Millions | |
| Recent Price: 34.20 Smart Investing & Trading Score: 51 | |
| Day Percent Change: -0.26% Day Change: -0.09 | |
| Week Change: -0.98% Year-to-date Change: 0.7% | |
| RNG Links: Profile News Message Board | |
| Charts:- Daily , Weekly | |
| Add RNG to Watchlist: View: Get Complete RNG Trend Analysis ➞ | |
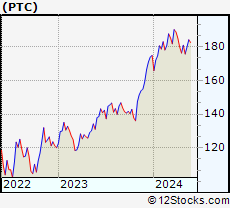 | PTC PTC Inc. |
| Sector: Technology | |
| SubSector: Technical & System Software | |
| MarketCap: 6166.7 Millions | |
| Recent Price: 176.24 Smart Investing & Trading Score: 15 | |
| Day Percent Change: 1.37% Day Change: 2.38 | |
| Week Change: -3.69% Year-to-date Change: 0.7% | |
| PTC Links: Profile News Message Board | |
| Charts:- Daily , Weekly | |
| Add PTC to Watchlist: View: Get Complete PTC Trend Analysis ➞ | |
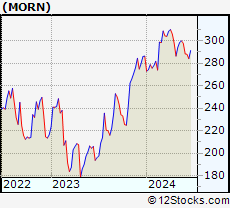 | MORN Morningstar, Inc. |
| Sector: Technology | |
| SubSector: Information & Delivery Services | |
| MarketCap: 4997.87 Millions | |
| Recent Price: 288.25 Smart Investing & Trading Score: 7 | |
| Day Percent Change: 0.29% Day Change: 0.82 | |
| Week Change: -3.14% Year-to-date Change: 0.7% | |
| MORN Links: Profile News Message Board | |
| Charts:- Daily , Weekly | |
| Add MORN to Watchlist: View: Get Complete MORN Trend Analysis ➞ | |
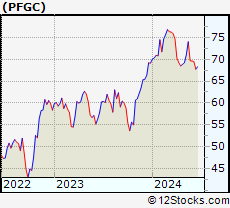 | PFGC Performance Food Group Company |
| Sector: Services & Goods | |
| SubSector: Restaurants | |
| MarketCap: 2457.5 Millions | |
| Recent Price: 69.60 Smart Investing & Trading Score: 32 | |
| Day Percent Change: 2.28% Day Change: 1.55 | |
| Week Change: -0.1% Year-to-date Change: 0.7% | |
| PFGC Links: Profile News Message Board | |
| Charts:- Daily , Weekly | |
| Add PFGC to Watchlist: View: Get Complete PFGC Trend Analysis ➞ | |
 | RPM RPM International Inc. |
| Sector: Materials | |
| SubSector: Specialty Chemicals | |
| MarketCap: 6814.87 Millions | |
| Recent Price: 112.10 Smart Investing & Trading Score: 57 | |
| Day Percent Change: 1.94% Day Change: 2.13 | |
| Week Change: -0.81% Year-to-date Change: 0.4% | |
| RPM Links: Profile News Message Board | |
| Charts:- Daily , Weekly | |
| Add RPM to Watchlist: View: Get Complete RPM Trend Analysis ➞ | |
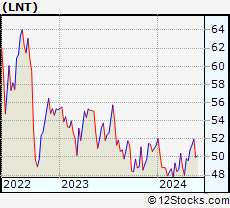 | LNT Alliant Energy Corporation |
| Sector: Utilities | |
| SubSector: Electric Utilities | |
| MarketCap: 10678.4 Millions | |
| Recent Price: 51.49 Smart Investing & Trading Score: 68 | |
| Day Percent Change: 2.65% Day Change: 1.33 | |
| Week Change: 3.08% Year-to-date Change: 0.4% | |
| LNT Links: Profile News Message Board | |
| Charts:- Daily , Weekly | |
| Add LNT to Watchlist: View: Get Complete LNT Trend Analysis ➞ | |
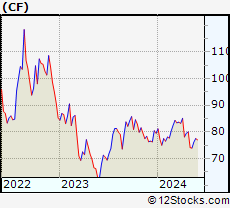 | CF CF Industries Holdings, Inc. |
| Sector: Materials | |
| SubSector: Agricultural Chemicals | |
| MarketCap: 5581.89 Millions | |
| Recent Price: 79.73 Smart Investing & Trading Score: 74 | |
| Day Percent Change: 3.57% Day Change: 2.75 | |
| Week Change: 2.86% Year-to-date Change: 0.3% | |
| CF Links: Profile News Message Board | |
| Charts:- Daily , Weekly | |
| Add CF to Watchlist: View: Get Complete CF Trend Analysis ➞ | |
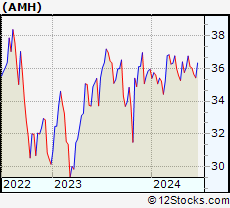 | AMH American Homes 4 Rent |
| Sector: Financials | |
| SubSector: REIT - Residential | |
| MarketCap: 6135.31 Millions | |
| Recent Price: 36.04 Smart Investing & Trading Score: 47 | |
| Day Percent Change: 1.09% Day Change: 0.39 | |
| Week Change: -0.25% Year-to-date Change: 0.2% | |
| AMH Links: Profile News Message Board | |
| Charts:- Daily , Weekly | |
| Add AMH to Watchlist: View: Get Complete AMH Trend Analysis ➞ | |
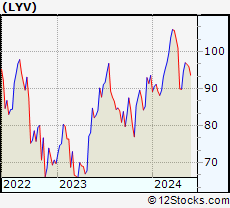 | LYV Live Nation Entertainment, Inc. |
| Sector: Services & Goods | |
| SubSector: Entertainment - Diversified | |
| MarketCap: 8457.17 Millions | |
| Recent Price: 93.74 Smart Investing & Trading Score: 0 | |
| Day Percent Change: 0.45% Day Change: 0.42 | |
| Week Change: -2.34% Year-to-date Change: 0.2% | |
| LYV Links: Profile News Message Board | |
| Charts:- Daily , Weekly | |
| Add LYV to Watchlist: View: Get Complete LYV Trend Analysis ➞ | |
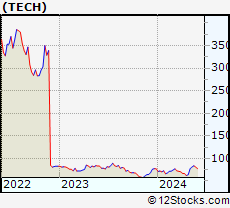 | TECH Bio-Techne Corporation |
| Sector: Health Care | |
| SubSector: Biotechnology | |
| MarketCap: 6958.05 Millions | |
| Recent Price: 77.19 Smart Investing & Trading Score: 51 | |
| Day Percent Change: -0.08% Day Change: -0.06 | |
| Week Change: -4.46% Year-to-date Change: 0.0% | |
| TECH Links: Profile News Message Board | |
| Charts:- Daily , Weekly | |
| Add TECH to Watchlist: View: Get Complete TECH Trend Analysis ➞ | |
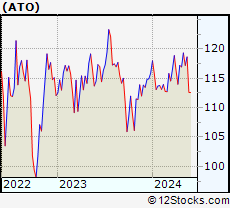 | ATO Atmos Energy Corporation |
| Sector: Utilities | |
| SubSector: Gas Utilities | |
| MarketCap: 11449 Millions | |
| Recent Price: 115.92 Smart Investing & Trading Score: 58 | |
| Day Percent Change: 2.96% Day Change: 3.33 | |
| Week Change: 2.94% Year-to-date Change: 0.0% | |
| ATO Links: Profile News Message Board | |
| Charts:- Daily , Weekly | |
| Add ATO to Watchlist: View: Get Complete ATO Trend Analysis ➞ | |
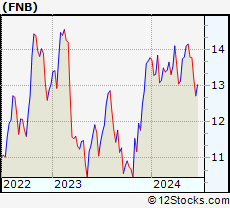 | FNB F.N.B. Corporation |
| Sector: Financials | |
| SubSector: Regional - Southeast Banks | |
| MarketCap: 2445.55 Millions | |
| Recent Price: 13.77 Smart Investing & Trading Score: 61 | |
| Day Percent Change: 1.03% Day Change: 0.14 | |
| Week Change: -0.15% Year-to-date Change: 0.0% | |
| FNB Links: Profile News Message Board | |
| Charts:- Daily , Weekly | |
| Add FNB to Watchlist: View: Get Complete FNB Trend Analysis ➞ | |
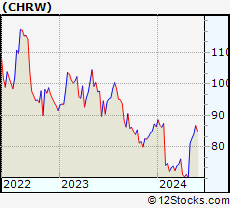 | CHRW C.H. Robinson Worldwide, Inc. |
| Sector: Transports | |
| SubSector: Air Delivery & Freight Services | |
| MarketCap: 9194.78 Millions | |
| Recent Price: 86.37 Smart Investing & Trading Score: 93 | |
| Day Percent Change: 1.74% Day Change: 1.48 | |
| Week Change: -0.4% Year-to-date Change: 0.0% | |
| CHRW Links: Profile News Message Board | |
| Charts:- Daily , Weekly | |
| Add CHRW to Watchlist: View: Get Complete CHRW Trend Analysis ➞ | |
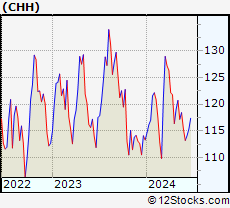 | CHH Choice Hotels International, Inc. |
| Sector: Services & Goods | |
| SubSector: Lodging | |
| MarketCap: 3427.56 Millions | |
| Recent Price: 113.19 Smart Investing & Trading Score: 58 | |
| Day Percent Change: 2.30% Day Change: 2.55 | |
| Week Change: -1.93% Year-to-date Change: -0.1% | |
| CHH Links: Profile News Message Board | |
| Charts:- Daily , Weekly | |
| Add CHH to Watchlist: View: Get Complete CHH Trend Analysis ➞ | |
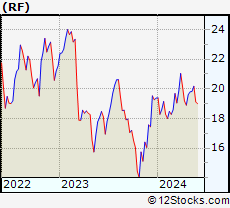 | RF Regions Financial Corporation |
| Sector: Financials | |
| SubSector: Regional - Southeast Banks | |
| MarketCap: 8936.25 Millions | |
| Recent Price: 19.35 Smart Investing & Trading Score: 68 | |
| Day Percent Change: 1.84% Day Change: 0.35 | |
| Week Change: 1.2% Year-to-date Change: -0.2% | |
| RF Links: Profile News Message Board | |
| Charts:- Daily , Weekly | |
| Add RF to Watchlist: View: Get Complete RF Trend Analysis ➞ | |
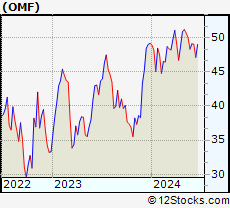 | OMF OneMain Holdings, Inc. |
| Sector: Financials | |
| SubSector: Credit Services | |
| MarketCap: 2753.38 Millions | |
| Recent Price: 49.12 Smart Investing & Trading Score: 58 | |
| Day Percent Change: 1.36% Day Change: 0.66 | |
| Week Change: 1.59% Year-to-date Change: -0.2% | |
| OMF Links: Profile News Message Board | |
| Charts:- Daily , Weekly | |
| Add OMF to Watchlist: View: Get Complete OMF Trend Analysis ➞ | |
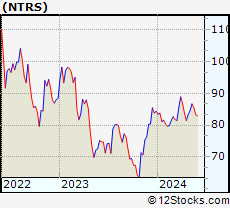 | NTRS Northern Trust Corporation |
| Sector: Financials | |
| SubSector: Asset Management | |
| MarketCap: 15316.8 Millions | |
| Recent Price: 84.24 Smart Investing & Trading Score: 68 | |
| Day Percent Change: 1.62% Day Change: 1.34 | |
| Week Change: 1.12% Year-to-date Change: -0.2% | |
| NTRS Links: Profile News Message Board | |
| Charts:- Daily , Weekly | |
| Add NTRS to Watchlist: View: Get Complete NTRS Trend Analysis ➞ | |
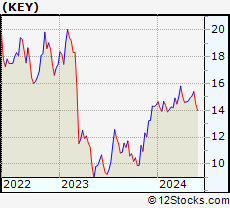 | KEY KeyCorp |
| Sector: Financials | |
| SubSector: Regional - Midwest Banks | |
| MarketCap: 10045 Millions | |
| Recent Price: 14.37 Smart Investing & Trading Score: 45 | |
| Day Percent Change: 2.72% Day Change: 0.38 | |
| Week Change: -0.76% Year-to-date Change: -0.2% | |
| KEY Links: Profile News Message Board | |
| Charts:- Daily , Weekly | |
| Add KEY to Watchlist: View: Get Complete KEY Trend Analysis ➞ | |
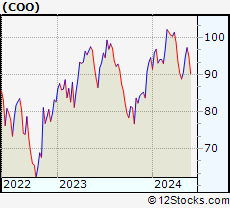 | COO The Cooper Companies, Inc. |
| Sector: Health Care | |
| SubSector: Medical Instruments & Supplies | |
| MarketCap: 15460 Millions | |
| Recent Price: 94.31 Smart Investing & Trading Score: 75 | |
| Day Percent Change: 4.52% Day Change: 4.08 | |
| Week Change: -0.61% Year-to-date Change: -0.3% | |
| COO Links: Profile News Message Board | |
| Charts:- Daily , Weekly | |
| Add COO to Watchlist: View: Get Complete COO Trend Analysis ➞ | |
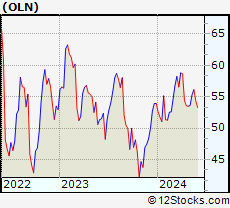 | OLN Olin Corporation |
| Sector: Materials | |
| SubSector: Specialty Chemicals | |
| MarketCap: 2126.87 Millions | |
| Recent Price: 53.76 Smart Investing & Trading Score: 48 | |
| Day Percent Change: 0.86% Day Change: 0.46 | |
| Week Change: -1.18% Year-to-date Change: -0.4% | |
| OLN Links: Profile News Message Board | |
| Charts:- Daily , Weekly | |
| Add OLN to Watchlist: View: Get Complete OLN Trend Analysis ➞ | |
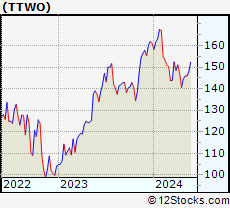 | TTWO Take-Two Interactive Software, Inc. |
| Sector: Technology | |
| SubSector: Multimedia & Graphics Software | |
| MarketCap: 12479.6 Millions | |
| Recent Price: 160.36 Smart Investing & Trading Score: 95 | |
| Day Percent Change: 0.36% Day Change: 0.58 | |
| Week Change: 3.73% Year-to-date Change: -0.4% | |
| TTWO Links: Profile News Message Board | |
| Charts:- Daily , Weekly | |
| Add TTWO to Watchlist: View: Get Complete TTWO Trend Analysis ➞ | |
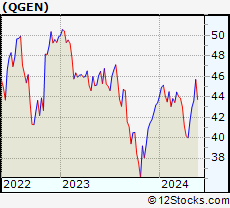 | QGEN QIAGEN N.V. |
| Sector: Services & Goods | |
| SubSector: Research Services | |
| MarketCap: 8698.94 Millions | |
| Recent Price: 43.26 Smart Investing & Trading Score: 76 | |
| Day Percent Change: 1.45% Day Change: 0.62 | |
| Week Change: -1.07% Year-to-date Change: -0.4% | |
| QGEN Links: Profile News Message Board | |
| Charts:- Daily , Weekly | |
| Add QGEN to Watchlist: View: Get Complete QGEN Trend Analysis ➞ | |
| For tabular summary view of above stock list: Summary View ➞ 0 - 25 , 25 - 50 , 50 - 75 , 75 - 100 , 100 - 125 , 125 - 150 , 150 - 175 , 175 - 200 , 200 - 225 , 225 - 250 , 250 - 275 , 275 - 300 , 300 - 325 , 325 - 350 , 350 - 375 , 375 - 400 , 400 - 425 , 425 - 450 , 450 - 475 , 475 - 500 , 500 - 525 , 525 - 550 , 550 - 575 , 575 - 600 , 600 - 625 , 625 - 650 , 650 - 675 , 675 - 700 , 700 - 725 , 725 - 750 , 750 - 775 | ||
| Click To Change The Sort Order: By Market Cap or Company Size Performance: Year-to-date, Week and Day | |
| Select Chart Type: | ||
|
Best Stocks Today 12Stocks.com |
© 2024 12Stocks.com Terms & Conditions Privacy Contact Us
All Information Provided Only For Education And Not To Be Used For Investing or Trading. See Terms & Conditions


One More Thing ... Get Best Stocks Delivered Daily!
Never Ever Miss A Move With Our Top Ten Stocks Lists
Find Best Stocks In Any Market - Bull or Bear Market
Take A Peek At Our Top Ten Stocks Lists: Daily, Weekly, Year-to-Date & Top Trends
Find Best Stocks In Any Market - Bull or Bear Market
Take A Peek At Our Top Ten Stocks Lists: Daily, Weekly, Year-to-Date & Top Trends
Midcap Stocks With Best Up Trends [0-bearish to 100-bullish]: Gap [100], Boston Beer[100], Nordstrom [100], Best Buy[100], NetApp [100], HEICO [100], Edison [100], Otis Worldwide[100], Clearway Energy[100], CenterPoint Energy[100], Ventas [100]
Best Midcap Stocks Year-to-Date:
Vistra Energy[157.22%], CAVA [112.86%], AppLovin [104.75%], Constellation Energy[85.51%], EMCOR [80.41%], Tenet [78.93%], ShockWave Medical[75.67%], Tandem Diabetes[73.23%], Natera [70.07%], Pure Storage[69.07%], Crocs [66.62%] Best Midcap Stocks This Week:
Gap [38.04%], GameStop [21.79%], Boston Beer[20.3%], DICK S[19.83%], Burlington Stores[19.8%], Best Buy[18.63%], Peloton Interactive[15.56%], Olaplex [13.38%], Marathon Oil[13.3%], CAVA [11.6%], HP [11.45%] Best Midcap Stocks Daily:
Gap [28.60%], Boston Beer[22.33%], Penn National[19.62%], Elastic N.V[11.67%], Caesars Entertainment[11.65%], Olaplex [9.88%], Zscaler [8.50%], V.F [7.70%], Medical Properties[7.20%], Kohl s[6.52%], Victorias Secret[5.56%]