
 Login Sign Up


| |||||
 |  | ||||

| 12Stocks.com Market Intelligence |
Best Materials Stocks
| In a hurry? Materials Stocks Lists: Performance Trends Table, Stock Charts
Sort Materials stocks: Daily, Weekly, Year-to-Date, Market Cap & Trends. Filter Materials stocks list by size: All Materials Large Mid-Range Small |
| 12Stocks.com Materials Stocks Performances & Trends Daily | |||||||||
|
|  The overall Smart Investing & Trading Score is 88 (0-bearish to 100-bullish) which puts Materials sector in short term bullish trend. The Smart Investing & Trading Score from previous trading session is 66 and hence an improvement of trend.
| ||||||||
Here are the Smart Investing & Trading Scores of the most requested Materials stocks at 12Stocks.com (click stock name for detailed review):
|


| Consider signing up for our daily 12Stocks.com "Best Stocks Newsletter". You will never ever miss a big stock move again! |
| 12Stocks.com: Investing in Materials sector with Stocks | |
|
The following table helps investors and traders sort through current performance and trends (as measured by Smart Investing & Trading Score) of various
stocks in the Materials sector. Quick View: Move mouse or cursor over stock symbol (ticker) to view short-term Technical chart and over stock name to view long term chart. Click on  to add stock symbol to your watchlist and to add stock symbol to your watchlist and  to view watchlist. Click on any ticker or stock name for detailed market intelligence report for that stock. to view watchlist. Click on any ticker or stock name for detailed market intelligence report for that stock. |
12Stocks.com Performance of Stocks in Materials Sector
| Ticker | Stock Name | Watchlist | Category | Recent Price | Smart Investing & Trading Score | Change % | YTD Change% |
| UUUU | Energy Fuels |   | Metals/Minerals | 6.68 | 100 | 7.40% | -7.09% |
| BTU | Peabody Energy | | Metals/Minerals | 22.53 | 35 | -0.13% | -7.36% |
| OEC | Orion Engineered | | Chemicals | 25.69 | 95 | -0.16% | -7.36% |
| MP | MP | | Other Industrial Metals & Mining | 18.25 | 85 | 0.94% | -8.06% |
| BTG | B2Gold | | Gold | 2.90 | 100 | 2.84% | -8.23% |
| CC | Chemours | | Chemicals | 28.89 | 83 | 0.07% | -8.40% |
| KWR | Quaker Chemical | | Chemicals | 194.71 | 64 | 2.23% | -8.77% |
| ALB | Albemarle | | Chemicals | 131.12 | 49 | 1.49% | -9.25% |
| CENTA | Central Garden | | Chemicals | 39.73 | 76 | 0.33% | -9.79% |
| CEIX | CONSOL Energy | | Metals/Minerals | 90.69 | 83 | 2.95% | -9.79% |
| BHP | BHP | | Metals/Minerals | 61.47 | 100 | 2.42% | -10.01% |
| MTRN | Materion | | Metals/Minerals | 117.00 | 49 | 1.62% | -10.09% |
| PPG | PPG Industries | | Chemicals | 134.44 | 40 | -0.25% | -10.10% |
| CLF | Cleveland-Cliffs | | Metals/Minerals | 17.51 | 12 | -0.91% | -14.25% |
| MOS | Mosaic | | Chemicals | 30.61 | 74 | -0.52% | -14.33% |
| BAK | Braskem S.A | | Chemicals | 7.54 | 22 | 0.27% | -14.51% |
| IIIN | Insteel Industries | | Steel & Iron | 32.66 | 15 | -0.64% | -14.70% |
| ACET | Aceto | | Chemicals | 1.60 | 57 | 1.91% | -15.34% |
| KOP | Koppers | | Chemicals | 43.27 | 18 | -3.74% | -15.52% |
| AVD | American Vanguard | | Chemicals | 9.10 | 42 | 3.88% | -17.05% |
| ASIX | AdvanSix | | Chemicals | 24.85 | 44 | 0.12% | -17.06% |
| METCB | Ramaco | | Coking Coal | 10.90 | 25 | -1.45% | -17.74% |
| FF | FutureFuel | | Chemicals | 5.00 | 25 | 0.00% | -17.76% |
| VALE | Vale S.A | | Metals/Minerals | 12.99 | 74 | 2.61% | -18.10% |
| ASTL | Algoma Steel | | Steel | 7.95 | 57 | 2.51% | -20.34% |
| For chart view version of above stock list: Chart View ➞ 0 - 25 , 25 - 50 , 50 - 75 , 75 - 100 , 100 - 125 , 125 - 150 , 150 - 175 | ||
 | Click To Change The Sort Order: By Market Cap or Company Size Performance: Year-to-date, Week and Day |  |
|
Get the most comprehensive stock market coverage daily at 12Stocks.com ➞ Best Stocks Today ➞ Best Stocks Weekly ➞ Best Stocks Year-to-Date ➞ Best Stocks Trends ➞  Best Stocks Today 12Stocks.com Best Nasdaq Stocks ➞ Best S&P 500 Stocks ➞ Best Tech Stocks ➞ Best Biotech Stocks ➞ |
| Detailed Overview of Materials Stocks |
| Materials Technical Overview, Leaders & Laggards, Top Materials ETF Funds & Detailed Materials Stocks List, Charts, Trends & More |
| Materials Sector: Technical Analysis, Trends & YTD Performance | |
| Materials sector is composed of stocks
from mining, metals, agricultural, precious metals
and chemical subsectors. Materials sector, as represented by XLB, an exchange-traded fund [ETF] that holds basket of Materials stocks (e.g, Dow Chemical, Newmont Mining) is up by 7.73% and is currently underperforming the overall market by -2.84% year-to-date. Below is a quick view of Technical charts and trends: |
|
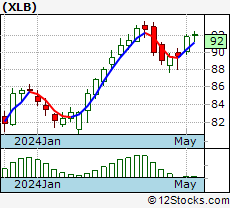 XLB Weekly Chart |
|
| Long Term Trend: Very Good | |
| Medium Term Trend: Very Good | |
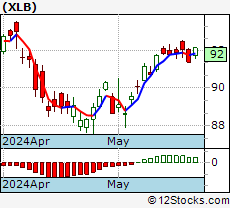 XLB Daily Chart |
|
| Short Term Trend: Good | |
| Overall Trend Score: 88 | |
| YTD Performance: 7.73% | |
| **Trend Scores & Views Are Only For Educational Purposes And Not For Investing | |
| 12Stocks.com: Top Performing Materials Sector Stocks | ||||||||||||||||||||||||||||||||||||||||||||||||
 The top performing Materials sector stocks year to date are
Now, more recently, over last week, the top performing Materials sector stocks on the move are


|
||||||||||||||||||||||||||||||||||||||||||||||||
| 12Stocks.com: Investing in Materials Sector using Exchange Traded Funds | |
|
The following table shows list of key exchange traded funds (ETF) that
help investors track Materials Index. For detailed view, check out our ETF Funds section of our website. Quick View: Move mouse or cursor over ETF symbol (ticker) to view short-term Technical chart and over ETF name to view long term chart. Click on ticker or stock name for detailed view. Click on to add stock symbol to your watchlist and to view watchlist. |
12Stocks.com List of ETFs that track Materials Index
| Ticker | ETF Name | Watchlist | Recent Price | Smart Investing & Trading Score | Change % | Week % | Year-to-date % |
| XLB | Materials | | 92.15 | 88 | 0.85 | 0.34 | 7.73% |
| IYM | Basic Materials | | 147.05 | 100 | 1.08 | 1.12 | 6.43% |
| VAW | Materials | | 203.42 | 88 | 0.86 | 0.56 | 7.1% |
| GDX | Gold Miners | | 36.87 | 100 | 3.39 | 4.6 | 18.9% |
| UYM | Basic Materials | | 28.22 | 83 | 1.62 | 0.34 | 13.16% |
| XME | Metals and Mining | | 64.00 | 100 | 1.86 | 3.91 | 6.97% |
| MOO | Agribusiness | | 74.35 | 76 | -0.12 | -0.24 | -2.4% |
| DBA | Agriculture | | 23.49 | 36 | -0.04 | -4.78 | 13.26% |
| GLD | Gold | | 223.66 | 95 | 1.65 | 2.26 | 17% |
| SLV | Silver | | 28.79 | 100 | 6.39 | 11.72 | 32.19% |
| SLX | Steel | | 72.90 | 95 | 0.11 | 2.4 | -1.16% |
| COPX | Copper Miners | | 51.67 | 100 | 4.68 | 7.69 | 37.79% |
| SIL | Silver Miners | | 35.23 | 100 | 4.88 | 6.82 | 24.18% |
| MXI | Global Materials | | 91.58 | 100 | 1.22 | 1.86 | 4.95% |
| GDXJ | Junior Gold Miners | | 46.35 | 100 | 5.10 | 6.7 | 22.26% |
| PSCM | SmallCap Materials | | 79.63 | 95 | -0.03 | 1.18 | 7.91% |
| 12Stocks.com: Charts, Trends, Fundamental Data and Performances of Materials Stocks | |
|
We now take in-depth look at all Materials stocks including charts, multi-period performances and overall trends (as measured by Smart Investing & Trading Score). One can sort Materials stocks (click link to choose) by Daily, Weekly and by Year-to-Date performances. Also, one can sort by size of the company or by market capitalization. |
| Select Your Default Chart Type: | |||||
| |||||
| Click on stock symbol or name for detailed view. Click on to add stock symbol to your watchlist and to view watchlist. Quick View: Move mouse or cursor over "Daily" to quickly view daily Technical stock chart and over "Weekly" to view weekly Technical stock chart. | |||||
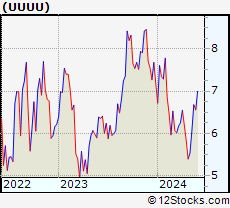 | UUUU Energy Fuels Inc. |
| Sector: Materials | |
| SubSector: Industrial Metals & Minerals | |
| MarketCap: 107.61 Millions | |
| Recent Price: 6.68 Smart Investing & Trading Score: 100 | |
| Day Percent Change: 7.40% Day Change: 0.46 | |
| Week Change: 9.87% Year-to-date Change: -7.1% | |
| UUUU Links: Profile News Message Board | |
| Charts:- Daily , Weekly | |
| Add UUUU to Watchlist: View: Get Complete UUUU Trend Analysis ➞ | |
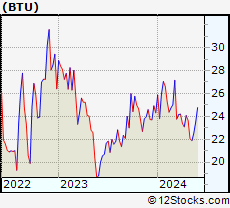 | BTU Peabody Energy Corporation |
| Sector: Materials | |
| SubSector: Industrial Metals & Minerals | |
| MarketCap: 355.11 Millions | |
| Recent Price: 22.53 Smart Investing & Trading Score: 35 | |
| Day Percent Change: -0.13% Day Change: -0.03 | |
| Week Change: 2.97% Year-to-date Change: -7.4% | |
| BTU Links: Profile News Message Board | |
| Charts:- Daily , Weekly | |
| Add BTU to Watchlist: View: Get Complete BTU Trend Analysis ➞ | |
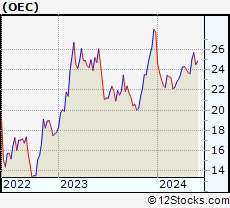 | OEC Orion Engineered Carbons S.A. |
| Sector: Materials | |
| SubSector: Specialty Chemicals | |
| MarketCap: 493.457 Millions | |
| Recent Price: 25.69 Smart Investing & Trading Score: 95 | |
| Day Percent Change: -0.16% Day Change: -0.04 | |
| Week Change: 2.47% Year-to-date Change: -7.4% | |
| OEC Links: Profile News Message Board | |
| Charts:- Daily , Weekly | |
| Add OEC to Watchlist: View: Get Complete OEC Trend Analysis ➞ | |
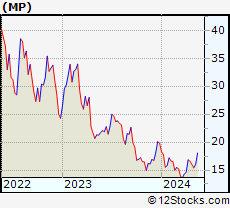 | MP MP Materials Corp. |
| Sector: Materials | |
| SubSector: Other Industrial Metals & Mining | |
| MarketCap: 41237 Millions | |
| Recent Price: 18.25 Smart Investing & Trading Score: 85 | |
| Day Percent Change: 0.94% Day Change: 0.17 | |
| Week Change: 13.14% Year-to-date Change: -8.1% | |
| MP Links: Profile News Message Board | |
| Charts:- Daily , Weekly | |
| Add MP to Watchlist: View: Get Complete MP Trend Analysis ➞ | |
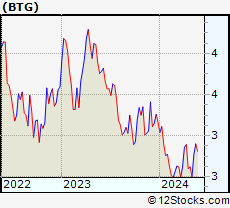 | BTG B2Gold Corp. |
| Sector: Materials | |
| SubSector: Gold | |
| MarketCap: 2792.39 Millions | |
| Recent Price: 2.90 Smart Investing & Trading Score: 100 | |
| Day Percent Change: 2.84% Day Change: 0.08 | |
| Week Change: 4.69% Year-to-date Change: -8.2% | |
| BTG Links: Profile News Message Board | |
| Charts:- Daily , Weekly | |
| Add BTG to Watchlist: View: Get Complete BTG Trend Analysis ➞ | |
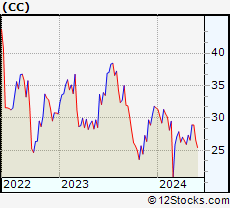 | CC The Chemours Company |
| Sector: Materials | |
| SubSector: Specialty Chemicals | |
| MarketCap: 1718.17 Millions | |
| Recent Price: 28.89 Smart Investing & Trading Score: 83 | |
| Day Percent Change: 0.07% Day Change: 0.02 | |
| Week Change: -0.03% Year-to-date Change: -8.4% | |
| CC Links: Profile News Message Board | |
| Charts:- Daily , Weekly | |
| Add CC to Watchlist: View: Get Complete CC Trend Analysis ➞ | |
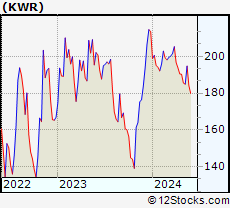 | KWR Quaker Chemical Corporation |
| Sector: Materials | |
| SubSector: Specialty Chemicals | |
| MarketCap: 2411.67 Millions | |
| Recent Price: 194.71 Smart Investing & Trading Score: 64 | |
| Day Percent Change: 2.23% Day Change: 4.24 | |
| Week Change: 5.32% Year-to-date Change: -8.8% | |
| KWR Links: Profile News Message Board | |
| Charts:- Daily , Weekly | |
| Add KWR to Watchlist: View: Get Complete KWR Trend Analysis ➞ | |
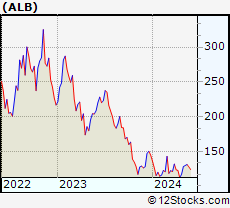 | ALB Albemarle Corporation |
| Sector: Materials | |
| SubSector: Specialty Chemicals | |
| MarketCap: 6139.27 Millions | |
| Recent Price: 131.12 Smart Investing & Trading Score: 49 | |
| Day Percent Change: 1.49% Day Change: 1.93 | |
| Week Change: 1.16% Year-to-date Change: -9.3% | |
| ALB Links: Profile News Message Board | |
| Charts:- Daily , Weekly | |
| Add ALB to Watchlist: View: Get Complete ALB Trend Analysis ➞ | |
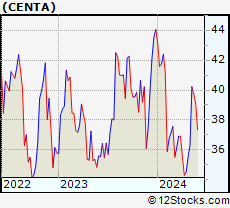 | CENTA Central Garden & Pet Company |
| Sector: Materials | |
| SubSector: Agricultural Chemicals | |
| MarketCap: 953 Millions | |
| Recent Price: 39.73 Smart Investing & Trading Score: 76 | |
| Day Percent Change: 0.33% Day Change: 0.13 | |
| Week Change: -1.24% Year-to-date Change: -9.8% | |
| CENTA Links: Profile News Message Board | |
| Charts:- Daily , Weekly | |
| Add CENTA to Watchlist: View: Get Complete CENTA Trend Analysis ➞ | |
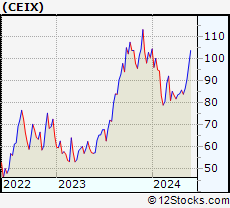 | CEIX CONSOL Energy Inc. |
| Sector: Materials | |
| SubSector: Industrial Metals & Minerals | |
| MarketCap: 196.81 Millions | |
| Recent Price: 90.69 Smart Investing & Trading Score: 83 | |
| Day Percent Change: 2.95% Day Change: 2.60 | |
| Week Change: 4.83% Year-to-date Change: -9.8% | |
| CEIX Links: Profile News Message Board | |
| Charts:- Daily , Weekly | |
| Add CEIX to Watchlist: View: Get Complete CEIX Trend Analysis ➞ | |
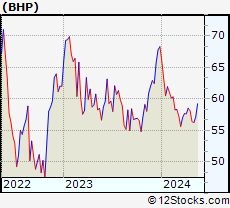 | BHP BHP Group |
| Sector: Materials | |
| SubSector: Industrial Metals & Minerals | |
| MarketCap: 86605.2 Millions | |
| Recent Price: 61.47 Smart Investing & Trading Score: 100 | |
| Day Percent Change: 2.42% Day Change: 1.45 | |
| Week Change: 7.48% Year-to-date Change: -10.0% | |
| BHP Links: Profile News Message Board | |
| Charts:- Daily , Weekly | |
| Add BHP to Watchlist: View: Get Complete BHP Trend Analysis ➞ | |
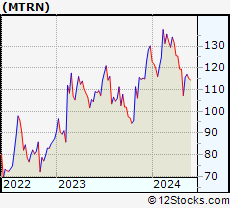 | MTRN Materion Corporation |
| Sector: Materials | |
| SubSector: Industrial Metals & Minerals | |
| MarketCap: 703.71 Millions | |
| Recent Price: 117.00 Smart Investing & Trading Score: 49 | |
| Day Percent Change: 1.62% Day Change: 1.86 | |
| Week Change: 1.11% Year-to-date Change: -10.1% | |
| MTRN Links: Profile News Message Board | |
| Charts:- Daily , Weekly | |
| Add MTRN to Watchlist: View: Get Complete MTRN Trend Analysis ➞ | |
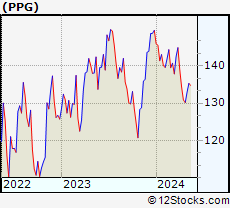 | PPG PPG Industries, Inc. |
| Sector: Materials | |
| SubSector: Specialty Chemicals | |
| MarketCap: 20285.5 Millions | |
| Recent Price: 134.44 Smart Investing & Trading Score: 40 | |
| Day Percent Change: -0.25% Day Change: -0.34 | |
| Week Change: -0.66% Year-to-date Change: -10.1% | |
| PPG Links: Profile News Message Board | |
| Charts:- Daily , Weekly | |
| Add PPG to Watchlist: View: Get Complete PPG Trend Analysis ➞ | |
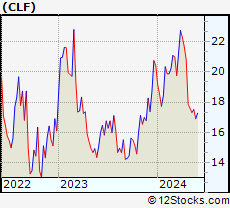 | CLF Cleveland-Cliffs Inc. |
| Sector: Materials | |
| SubSector: Industrial Metals & Minerals | |
| MarketCap: 957.61 Millions | |
| Recent Price: 17.51 Smart Investing & Trading Score: 12 | |
| Day Percent Change: -0.91% Day Change: -0.16 | |
| Week Change: 1.1% Year-to-date Change: -14.3% | |
| CLF Links: Profile News Message Board | |
| Charts:- Daily , Weekly | |
| Add CLF to Watchlist: View: Get Complete CLF Trend Analysis ➞ | |
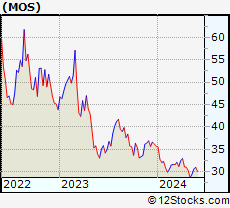 | MOS The Mosaic Company |
| Sector: Materials | |
| SubSector: Agricultural Chemicals | |
| MarketCap: 4299.59 Millions | |
| Recent Price: 30.61 Smart Investing & Trading Score: 74 | |
| Day Percent Change: -0.52% Day Change: -0.16 | |
| Week Change: 4.01% Year-to-date Change: -14.3% | |
| MOS Links: Profile News Message Board | |
| Charts:- Daily , Weekly | |
| Add MOS to Watchlist: View: Get Complete MOS Trend Analysis ➞ | |
 | BAK Braskem S.A. |
| Sector: Materials | |
| SubSector: Chemicals - Major Diversified | |
| MarketCap: 2715.86 Millions | |
| Recent Price: 7.54 Smart Investing & Trading Score: 22 | |
| Day Percent Change: 0.27% Day Change: 0.02 | |
| Week Change: 2.45% Year-to-date Change: -14.5% | |
| BAK Links: Profile News Message Board | |
| Charts:- Daily , Weekly | |
| Add BAK to Watchlist: View: Get Complete BAK Trend Analysis ➞ | |
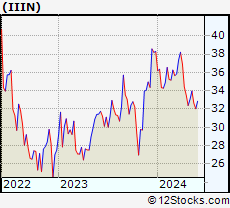 | IIIN Insteel Industries, Inc. |
| Sector: Materials | |
| SubSector: Steel & Iron | |
| MarketCap: 269.488 Millions | |
| Recent Price: 32.66 Smart Investing & Trading Score: 15 | |
| Day Percent Change: -0.64% Day Change: -0.21 | |
| Week Change: -3.88% Year-to-date Change: -14.7% | |
| IIIN Links: Profile News Message Board | |
| Charts:- Daily , Weekly | |
| Add IIIN to Watchlist: View: Get Complete IIIN Trend Analysis ➞ | |
 | ACET Aceto Corporation |
| Sector: Materials | |
| SubSector: Chemicals - Major Diversified | |
| MarketCap: 453.16 Millions | |
| Recent Price: 1.60 Smart Investing & Trading Score: 57 | |
| Day Percent Change: 1.91% Day Change: 0.03 | |
| Week Change: 8.84% Year-to-date Change: -15.3% | |
| ACET Links: Profile News Message Board | |
| Charts:- Daily , Weekly | |
| Add ACET to Watchlist: View: Get Complete ACET Trend Analysis ➞ | |
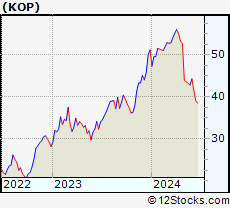 | KOP Koppers Holdings Inc. |
| Sector: Materials | |
| SubSector: Specialty Chemicals | |
| MarketCap: 232.657 Millions | |
| Recent Price: 43.27 Smart Investing & Trading Score: 18 | |
| Day Percent Change: -3.74% Day Change: -1.68 | |
| Week Change: -0.87% Year-to-date Change: -15.5% | |
| KOP Links: Profile News Message Board | |
| Charts:- Daily , Weekly | |
| Add KOP to Watchlist: View: Get Complete KOP Trend Analysis ➞ | |
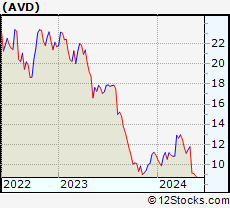 | AVD American Vanguard Corporation |
| Sector: Materials | |
| SubSector: Agricultural Chemicals | |
| MarketCap: 419.329 Millions | |
| Recent Price: 9.10 Smart Investing & Trading Score: 42 | |
| Day Percent Change: 3.88% Day Change: 0.34 | |
| Week Change: -0.44% Year-to-date Change: -17.1% | |
| AVD Links: Profile News Message Board | |
| Charts:- Daily , Weekly | |
| Add AVD to Watchlist: View: Get Complete AVD Trend Analysis ➞ | |
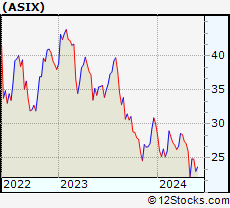 | ASIX AdvanSix Inc. |
| Sector: Materials | |
| SubSector: Chemicals - Major Diversified | |
| MarketCap: 394.136 Millions | |
| Recent Price: 24.85 Smart Investing & Trading Score: 44 | |
| Day Percent Change: 0.12% Day Change: 0.03 | |
| Week Change: -0.12% Year-to-date Change: -17.1% | |
| ASIX Links: Profile News Message Board | |
| Charts:- Daily , Weekly | |
| Add ASIX to Watchlist: View: Get Complete ASIX Trend Analysis ➞ | |
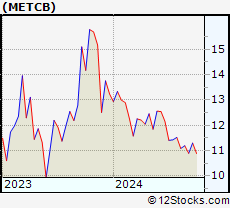 | METCB Ramaco Resources, Inc. |
| Sector: Materials | |
| SubSector: Coking Coal | |
| MarketCap: 469 Millions | |
| Recent Price: 10.90 Smart Investing & Trading Score: 25 | |
| Day Percent Change: -1.45% Day Change: -0.16 | |
| Week Change: -2.68% Year-to-date Change: -17.7% | |
| METCB Links: Profile News Message Board | |
| Charts:- Daily , Weekly | |
| Add METCB to Watchlist: View: Get Complete METCB Trend Analysis ➞ | |
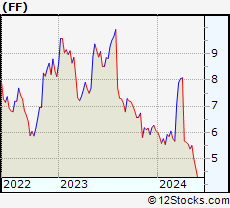 | FF FutureFuel Corp. |
| Sector: Materials | |
| SubSector: Chemicals - Major Diversified | |
| MarketCap: 450.736 Millions | |
| Recent Price: 5.00 Smart Investing & Trading Score: 25 | |
| Day Percent Change: 0.00% Day Change: 0.00 | |
| Week Change: -9.09% Year-to-date Change: -17.8% | |
| FF Links: Profile News Message Board | |
| Charts:- Daily , Weekly | |
| Add FF to Watchlist: View: Get Complete FF Trend Analysis ➞ | |
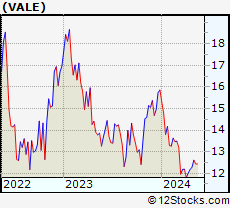 | VALE Vale S.A. |
| Sector: Materials | |
| SubSector: Industrial Metals & Minerals | |
| MarketCap: 43601 Millions | |
| Recent Price: 12.99 Smart Investing & Trading Score: 74 | |
| Day Percent Change: 2.61% Day Change: 0.33 | |
| Week Change: 4.42% Year-to-date Change: -18.1% | |
| VALE Links: Profile News Message Board | |
| Charts:- Daily , Weekly | |
| Add VALE to Watchlist: View: Get Complete VALE Trend Analysis ➞ | |
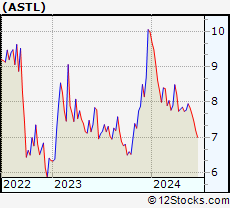 | ASTL Algoma Steel Group Inc. |
| Sector: Materials | |
| SubSector: Steel | |
| MarketCap: 731 Millions | |
| Recent Price: 7.95 Smart Investing & Trading Score: 57 | |
| Day Percent Change: 2.51% Day Change: 0.20 | |
| Week Change: 2.32% Year-to-date Change: -20.3% | |
| ASTL Links: Profile News Message Board | |
| Charts:- Daily , Weekly | |
| Add ASTL to Watchlist: View: Get Complete ASTL Trend Analysis ➞ | |
| For tabular summary view of above stock list: Summary View ➞ 0 - 25 , 25 - 50 , 50 - 75 , 75 - 100 , 100 - 125 , 125 - 150 , 150 - 175 | ||
| Click To Change The Sort Order: By Market Cap or Company Size Performance: Year-to-date, Week and Day | |
| Select Chart Type: | ||
|
Best Stocks Today 12Stocks.com |
© 2024 12Stocks.com Terms & Conditions Privacy Contact Us
All Information Provided Only For Education And Not To Be Used For Investing or Trading. See Terms & Conditions


One More Thing ... Get Best Stocks Delivered Daily!
Never Ever Miss A Move With Our Top Ten Stocks Lists
Find Best Stocks In Any Market - Bull or Bear Market
Take A Peek At Our Top Ten Stocks Lists: Daily, Weekly, Year-to-Date & Top Trends
Find Best Stocks In Any Market - Bull or Bear Market
Take A Peek At Our Top Ten Stocks Lists: Daily, Weekly, Year-to-Date & Top Trends
Materials Stocks With Best Up Trends [0-bearish to 100-bullish]: New Gold[100], Coeur [100], Hecla [100], Endeavour Silver[100], Rayonier Advanced[100], Vox Royalty[100], Silvercorp Metals[100], Fortuna Silver[100], Energy Fuels[100], Gatos Silver[100], First Majestic[100]
Best Materials Stocks Year-to-Date:
TuanChe [942.79%], Endeavour Silver[96.45%], Hudbay Minerals[86.05%], Gatos Silver[81.83%], Coeur [80.37%], IAMGOLD [78.66%], Perimeter [73.45%], Harmony Gold[58.7%], McEwen [57.14%], Fortuna Silver[51.3%], Silvercorp Metals[50.57%] Best Materials Stocks This Week:
NovaGold [22.89%], Trilogy Metals[20.7%], Valhi [18.4%], Hudbay Minerals[16.97%], Endeavour Silver[16.57%], Dakota Gold[14.07%], Hecla [14.02%], MP [13.14%], Benson Hill[12.5%], Gatos Silver[12.46%], Fortuna Silver[12.09%] Best Materials Stocks Daily:
New Gold[12.23%], Coeur [11.57%], Hecla [11.11%], Endeavour Silver[10.57%], Gold Royalty[8.74%], Rayonier Advanced[8.61%], Vox Royalty[7.82%], Silvercorp Metals[7.61%], Fortuna Silver[7.55%], Energy Fuels[7.40%], Gatos Silver[7.30%]