
 Login Sign Up


| |||||
 |  | ||||

| 12Stocks.com Market Intelligence |
Best Materials Stocks
| In a hurry? Materials Stocks Lists: Performance Trends Table, Stock Charts
Sort Materials stocks: Daily, Weekly, Year-to-Date, Market Cap & Trends. Filter Materials stocks list by size: All Materials Large Mid-Range Small |
| 12Stocks.com Materials Stocks Performances & Trends Daily | |||||||||
|
|  The overall Smart Investing & Trading Score is 90 (0-bearish to 100-bullish) which puts Materials sector in short term bullish trend. The Smart Investing & Trading Score from previous trading session is 85 and an improvement of trend continues.
| ||||||||
Here are the Smart Investing & Trading Scores of the most requested Materials stocks at 12Stocks.com (click stock name for detailed review):
|


| Consider signing up for our daily 12Stocks.com "Best Stocks Newsletter". You will never ever miss a big stock move again! |
| 12Stocks.com: Investing in Materials sector with Stocks | |
|
The following table helps investors and traders sort through current performance and trends (as measured by Smart Investing & Trading Score) of various
stocks in the Materials sector. Quick View: Move mouse or cursor over stock symbol (ticker) to view short-term Technical chart and over stock name to view long term chart. Click on  to add stock symbol to your watchlist and to add stock symbol to your watchlist and  to view watchlist. Click on any ticker or stock name for detailed market intelligence report for that stock. to view watchlist. Click on any ticker or stock name for detailed market intelligence report for that stock. |
12Stocks.com Performance of Stocks in Materials Sector
| Ticker | Stock Name | Watchlist | Category | Recent Price | Smart Investing & Trading Score | Change % | YTD Change% |
| TC | TuanChe |   | Metals/Minerals | 2.33 | 100 | 8.37% | NA |
| METCB | Ramaco | | Coking Coal | 12.49 | 100 | 6.39% | -5.74% |
| ODC | Oil-Dri | | Chemicals | 80.49 | 100 | 5.38% | 19.99% |
| KGC | Kinross Gold | | Gold | 7.10 | 100 | 4.87% | 17.36% |
| IFF | Flavors | | Chemicals | 97.23 | 100 | 3.07% | 20.08% |
| IE | Ivanhoe Electric | | Copper | 11.49 | 100 | 2.22% | 13.37% |
| ORGN | Origin | | Chemicals | 1.21 | 100 | 10.00% | 43.55% |
| AVD | American Vanguard | | Chemicals | 12.46 | 100 | 1.88% | 13.58% |
| SLVM | Sylvamo | | Paper & Paper Products | 67.24 | 100 | 1.62% | 36.92% |
| DOW | Dow | | Chemicals | 58.64 | 100 | 0.48% | 6.93% |
| NTR | Nutrien | | Chemicals | 55.43 | 100 | 0.31% | -1.60% |
| EMN | Eastman Chemical | | Chemicals | 100.76 | 100 | 0.13% | 12.18% |
| CBT | Cabot | | Chemicals | 101.07 | 100 | 0.00% | 21.04% |
| FMC | FMC | | Chemicals | 64.84 | 100 | -2.86% | 2.84% |
| NWPX | Northwest Pipe | | Steel & Iron | 35.61 | 100 | -1.66% | 17.68% |
| OLN | Olin | | Chemicals | 55.39 | 100 | -1.09% | 2.67% |
| OEC | Orion Engineered | | Chemicals | 24.48 | 100 | -0.29% | -11.72% |
| WPM | Wheaton Precious | | Silver | 54.36 | 95 | 0.95% | 10.17% |
| LYB | LyondellBasell Industries | | Chemicals | 102.18 | 95 | 0.72% | 7.47% |
| SXT | Sensient Technologies | | Chemicals | 76.13 | 95 | 0.67% | 15.35% |
| AEM | Agnico Eagle | | Gold | 66.28 | 95 | 0.61% | 20.84% |
| AXTA | Axalta Coating | | Chemicals | 36.33 | 95 | 0.41% | 6.95% |
| CE | Celanese | | Chemicals | 163.27 | 95 | 0.33% | 5.08% |
| FNV | Franco-Nevada | | Gold | 126.34 | 95 | 0.25% | 14.01% |
| ECL | Ecolab | | Chemicals | 233.23 | 95 | 0.13% | 17.59% |
| For chart view version of above stock list: Chart View ➞ 0 - 25 , 25 - 50 , 50 - 75 , 75 - 100 , 100 - 125 , 125 - 150 , 150 - 175 | ||
 | Click To Change The Sort Order: By Market Cap or Company Size Performance: Year-to-date, Week and Day |  |
|
Get the most comprehensive stock market coverage daily at 12Stocks.com ➞ Best Stocks Today ➞ Best Stocks Weekly ➞ Best Stocks Year-to-Date ➞ Best Stocks Trends ➞  Best Stocks Today 12Stocks.com Best Nasdaq Stocks ➞ Best S&P 500 Stocks ➞ Best Tech Stocks ➞ Best Biotech Stocks ➞ |
| Detailed Overview of Materials Stocks |
| Materials Technical Overview, Leaders & Laggards, Top Materials ETF Funds & Detailed Materials Stocks List, Charts, Trends & More |
| Materials Sector: Technical Analysis, Trends & YTD Performance | |
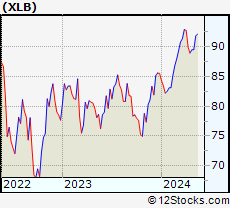
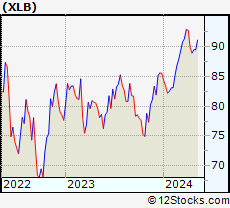
| Materials sector is composed of stocks
from mining, metals, agricultural, precious metals
and chemical subsectors. Materials sector, as represented by XLB, an exchange-traded fund [ETF] that holds basket of Materials stocks (e.g, Dow Chemical, Newmont Mining) is up by 6.06% and is currently underperforming the overall market by -1.98% year-to-date. Below is a quick view of Technical charts and trends: |
|
 XLB Weekly Chart |
|
| Long Term Trend: Very Good | |
| Medium Term Trend: Good | |
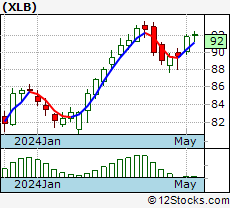
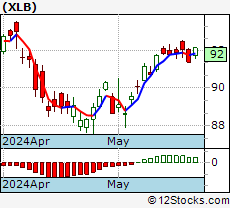 XLB Daily Chart |
|
| Short Term Trend: Very Good | |
| Overall Trend Score: 90 | |
| YTD Performance: 6.06% | |
| **Trend Scores & Views Are Only For Educational Purposes And Not For Investing | |
| 12Stocks.com: Top Performing Materials Sector Stocks | ||||||||||||||||||||||||||||||||||||||||||||||||
 The top performing Materials sector stocks year to date are
Now, more recently, over last week, the top performing Materials sector stocks on the move are


|
||||||||||||||||||||||||||||||||||||||||||||||||
| 12Stocks.com: Investing in Materials Sector using Exchange Traded Funds | |
|
The following table shows list of key exchange traded funds (ETF) that
help investors track Materials Index. For detailed view, check out our ETF Funds section of our website. Quick View: Move mouse or cursor over ETF symbol (ticker) to view short-term Technical chart and over ETF name to view long term chart. Click on ticker or stock name for detailed view. Click on to add stock symbol to your watchlist and to view watchlist. |
12Stocks.com List of ETFs that track Materials Index
| Ticker | ETF Name | Watchlist | Recent Price | Smart Investing & Trading Score | Change % | Week % | Year-to-date % |
| XLB | Materials | | 90.72 | 90 | -0.46 | 1.33 | 6.06% |
| IYM | Basic Materials | | 143.47 | 90 | -0.57 | 1.35 | 3.84% |
| VAW | Materials | | 199.93 | 90 | -0.36 | 1.46 | 5.26% |
| GDX | Gold Miners | | 34.16 | 83 | -0.03 | 2.15 | 10.16% |
| UYM | Basic Materials | | 27.46 | 85 | -1.08 | 2.88 | 10.11% |
| XME | Metals and Mining | | 60.82 | 68 | -0.85 | -0.03 | 1.65% |
| MOO | Agribusiness | | 73.45 | 93 | -0.39 | 1.02 | -3.58% |
| DBA | Agriculture | | 24.43 | 68 | -0.29 | 1.92 | 17.79% |
| GLD | Gold | | 213.58 | 54 | -0.29 | 0.29 | 11.72% |
| SLV | Silver | | 24.95 | 68 | 0.12 | 3.01 | 14.55% |
| SLX | Steel | | 70.64 | 50 | -0.90 | -0.53 | -4.22% |
| COPX | Copper Miners | | 46.80 | 66 | -1.29 | 0.34 | 24.8% |
| SIL | Silver Miners | | 31.83 | 83 | -0.50 | 2.81 | 12.2% |
| MXI | Global Materials | | 88.82 | 81 | -0.69 | 0.65 | 1.79% |
| GDXJ | Junior Gold Miners | | 41.89 | 69 | -0.12 | 2.85 | 10.5% |
| PSCM | SmallCap Materials | | 78.09 | 88 | -0.08 | 1.09 | 5.82% |
| 12Stocks.com: Charts, Trends, Fundamental Data and Performances of Materials Stocks | |
|
We now take in-depth look at all Materials stocks including charts, multi-period performances and overall trends (as measured by Smart Investing & Trading Score). One can sort Materials stocks (click link to choose) by Daily, Weekly and by Year-to-Date performances. Also, one can sort by size of the company or by market capitalization. |
| Select Your Default Chart Type: | |||||
| |||||
| Click on stock symbol or name for detailed view. Click on to add stock symbol to your watchlist and to view watchlist. Quick View: Move mouse or cursor over "Daily" to quickly view daily Technical stock chart and over "Weekly" to view weekly Technical stock chart. | |||||
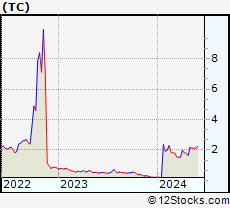 | TC TuanChe Limited |
| Sector: Materials | |
| SubSector: Industrial Metals & Minerals | |
| MarketCap: 107.31 Millions | |
| Recent Price: 2.33 Smart Investing & Trading Score: 100 | |
| Day Percent Change: 8.37% Day Change: 0.18 | |
| Week Change: 6.88% Year-to-date Change: 1,046.1% | |
| TC Links: Profile News Message Board | |
| Charts:- Daily , Weekly | |
| Add TC to Watchlist: View: Get Complete TC Trend Analysis ➞ | |
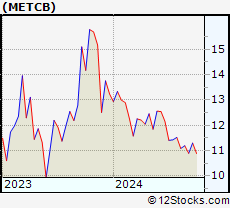 | METCB Ramaco Resources, Inc. |
| Sector: Materials | |
| SubSector: Coking Coal | |
| MarketCap: 469 Millions | |
| Recent Price: 12.49 Smart Investing & Trading Score: 100 | |
| Day Percent Change: 6.39% Day Change: 0.75 | |
| Week Change: 12.62% Year-to-date Change: -5.7% | |
| METCB Links: Profile News Message Board | |
| Charts:- Daily , Weekly | |
| Add METCB to Watchlist: View: Get Complete METCB Trend Analysis ➞ | |
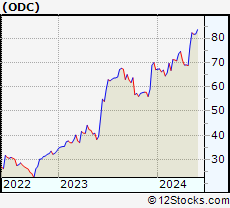 | ODC Oil-Dri Corporation of America |
| Sector: Materials | |
| SubSector: Specialty Chemicals | |
| MarketCap: 249.857 Millions | |
| Recent Price: 80.49 Smart Investing & Trading Score: 100 | |
| Day Percent Change: 5.38% Day Change: 4.11 | |
| Week Change: 4.78% Year-to-date Change: 20.0% | |
| ODC Links: Profile News Message Board | |
| Charts:- Daily , Weekly | |
| Add ODC to Watchlist: View: Get Complete ODC Trend Analysis ➞ | |
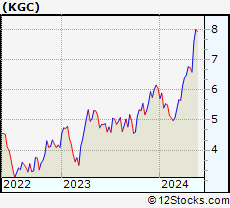 | KGC Kinross Gold Corporation |
| Sector: Materials | |
| SubSector: Gold | |
| MarketCap: 5389.29 Millions | |
| Recent Price: 7.10 Smart Investing & Trading Score: 100 | |
| Day Percent Change: 4.87% Day Change: 0.33 | |
| Week Change: 7.74% Year-to-date Change: 17.4% | |
| KGC Links: Profile News Message Board | |
| Charts:- Daily , Weekly | |
| Add KGC to Watchlist: View: Get Complete KGC Trend Analysis ➞ | |
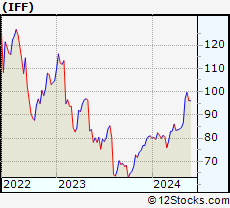 | IFF International Flavors & Fragrances Inc. |
| Sector: Materials | |
| SubSector: Specialty Chemicals | |
| MarketCap: 12178.7 Millions | |
| Recent Price: 97.23 Smart Investing & Trading Score: 100 | |
| Day Percent Change: 3.07% Day Change: 2.90 | |
| Week Change: 12.22% Year-to-date Change: 20.1% | |
| IFF Links: Profile News Message Board | |
| Charts:- Daily , Weekly | |
| Add IFF to Watchlist: View: Get Complete IFF Trend Analysis ➞ | |
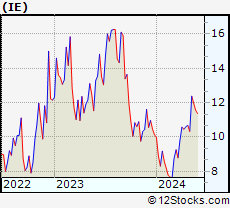 | IE Ivanhoe Electric Inc. |
| Sector: Materials | |
| SubSector: Copper | |
| MarketCap: 1200 Millions | |
| Recent Price: 11.49 Smart Investing & Trading Score: 100 | |
| Day Percent Change: 2.22% Day Change: 0.25 | |
| Week Change: 11.23% Year-to-date Change: 13.4% | |
| IE Links: Profile News Message Board | |
| Charts:- Daily , Weekly | |
| Add IE to Watchlist: View: Get Complete IE Trend Analysis ➞ | |
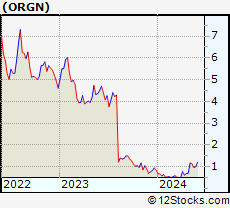 | ORGN Origin Materials, Inc. |
| Sector: Materials | |
| SubSector: Chemicals | |
| MarketCap: 586 Millions | |
| Recent Price: 1.21 Smart Investing & Trading Score: 100 | |
| Day Percent Change: 10.00% Day Change: 0.11 | |
| Week Change: 3.42% Year-to-date Change: 43.6% | |
| ORGN Links: Profile News Message Board | |
| Charts:- Daily , Weekly | |
| Add ORGN to Watchlist: View: Get Complete ORGN Trend Analysis ➞ | |
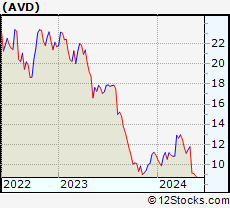 | AVD American Vanguard Corporation |
| Sector: Materials | |
| SubSector: Agricultural Chemicals | |
| MarketCap: 419.329 Millions | |
| Recent Price: 12.46 Smart Investing & Trading Score: 100 | |
| Day Percent Change: 1.88% Day Change: 0.23 | |
| Week Change: 5.86% Year-to-date Change: 13.6% | |
| AVD Links: Profile News Message Board | |
| Charts:- Daily , Weekly | |
| Add AVD to Watchlist: View: Get Complete AVD Trend Analysis ➞ | |
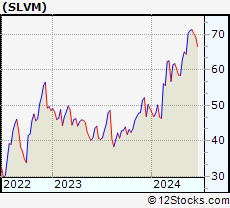 | SLVM Sylvamo Corporation |
| Sector: Materials | |
| SubSector: Paper & Paper Products | |
| MarketCap: 1710 Millions | |
| Recent Price: 67.24 Smart Investing & Trading Score: 100 | |
| Day Percent Change: 1.62% Day Change: 1.07 | |
| Week Change: 3.37% Year-to-date Change: 36.9% | |
| SLVM Links: Profile News Message Board | |
| Charts:- Daily , Weekly | |
| Add SLVM to Watchlist: View: Get Complete SLVM Trend Analysis ➞ | |
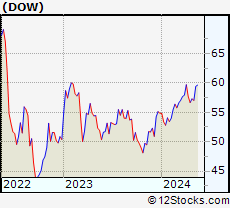 | DOW Dow Inc. |
| Sector: Materials | |
| SubSector: Chemicals - Major Diversified | |
| MarketCap: 24098.6 Millions | |
| Recent Price: 58.64 Smart Investing & Trading Score: 100 | |
| Day Percent Change: 0.48% Day Change: 0.28 | |
| Week Change: 2.81% Year-to-date Change: 6.9% | |
| DOW Links: Profile News Message Board | |
| Charts:- Daily , Weekly | |
| Add DOW to Watchlist: View: Get Complete DOW Trend Analysis ➞ | |
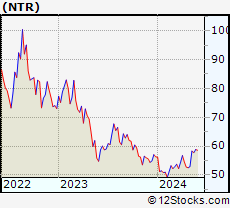 | NTR Nutrien Ltd. |
| Sector: Materials | |
| SubSector: Agricultural Chemicals | |
| MarketCap: 15897.9 Millions | |
| Recent Price: 55.43 Smart Investing & Trading Score: 100 | |
| Day Percent Change: 0.31% Day Change: 0.17 | |
| Week Change: 4.72% Year-to-date Change: -1.6% | |
| NTR Links: Profile News Message Board | |
| Charts:- Daily , Weekly | |
| Add NTR to Watchlist: View: Get Complete NTR Trend Analysis ➞ | |
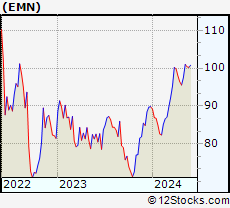 | EMN Eastman Chemical Company |
| Sector: Materials | |
| SubSector: Chemicals - Major Diversified | |
| MarketCap: 6217.06 Millions | |
| Recent Price: 100.76 Smart Investing & Trading Score: 100 | |
| Day Percent Change: 0.13% Day Change: 0.13 | |
| Week Change: 3.34% Year-to-date Change: 12.2% | |
| EMN Links: Profile News Message Board | |
| Charts:- Daily , Weekly | |
| Add EMN to Watchlist: View: Get Complete EMN Trend Analysis ➞ | |
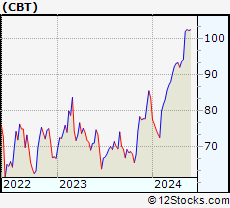 | CBT Cabot Corporation |
| Sector: Materials | |
| SubSector: Specialty Chemicals | |
| MarketCap: 1261.47 Millions | |
| Recent Price: 101.07 Smart Investing & Trading Score: 100 | |
| Day Percent Change: 0.00% Day Change: 0.00 | |
| Week Change: 7.4% Year-to-date Change: 21.0% | |
| CBT Links: Profile News Message Board | |
| Charts:- Daily , Weekly | |
| Add CBT to Watchlist: View: Get Complete CBT Trend Analysis ➞ | |
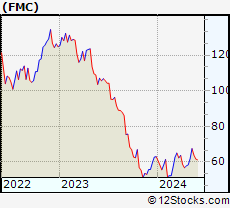 | FMC FMC Corporation |
| Sector: Materials | |
| SubSector: Chemicals - Major Diversified | |
| MarketCap: 9068.36 Millions | |
| Recent Price: 64.84 Smart Investing & Trading Score: 100 | |
| Day Percent Change: -2.86% Day Change: -1.91 | |
| Week Change: 4.83% Year-to-date Change: 2.8% | |
| FMC Links: Profile News Message Board | |
| Charts:- Daily , Weekly | |
| Add FMC to Watchlist: View: Get Complete FMC Trend Analysis ➞ | |
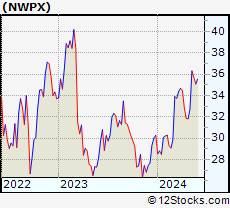 | NWPX Northwest Pipe Company |
| Sector: Materials | |
| SubSector: Steel & Iron | |
| MarketCap: 245.788 Millions | |
| Recent Price: 35.61 Smart Investing & Trading Score: 100 | |
| Day Percent Change: -1.66% Day Change: -0.60 | |
| Week Change: 8.83% Year-to-date Change: 17.7% | |
| NWPX Links: Profile News Message Board | |
| Charts:- Daily , Weekly | |
| Add NWPX to Watchlist: View: Get Complete NWPX Trend Analysis ➞ | |
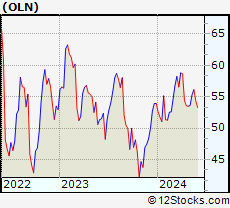 | OLN Olin Corporation |
| Sector: Materials | |
| SubSector: Specialty Chemicals | |
| MarketCap: 2126.87 Millions | |
| Recent Price: 55.39 Smart Investing & Trading Score: 100 | |
| Day Percent Change: -1.09% Day Change: -0.61 | |
| Week Change: 3.28% Year-to-date Change: 2.7% | |
| OLN Links: Profile News Message Board | |
| Charts:- Daily , Weekly | |
| Add OLN to Watchlist: View: Get Complete OLN Trend Analysis ➞ | |
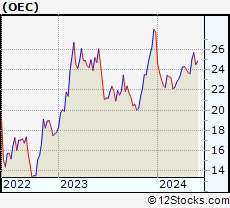 | OEC Orion Engineered Carbons S.A. |
| Sector: Materials | |
| SubSector: Specialty Chemicals | |
| MarketCap: 493.457 Millions | |
| Recent Price: 24.48 Smart Investing & Trading Score: 100 | |
| Day Percent Change: -0.29% Day Change: -0.07 | |
| Week Change: 3.73% Year-to-date Change: -11.7% | |
| OEC Links: Profile News Message Board | |
| Charts:- Daily , Weekly | |
| Add OEC to Watchlist: View: Get Complete OEC Trend Analysis ➞ | |
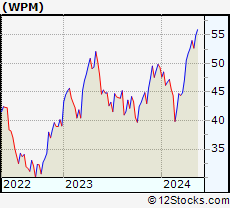 | WPM Wheaton Precious Metals Corp. |
| Sector: Materials | |
| SubSector: Silver | |
| MarketCap: 11349.6 Millions | |
| Recent Price: 54.36 Smart Investing & Trading Score: 95 | |
| Day Percent Change: 0.95% Day Change: 0.51 | |
| Week Change: 3.17% Year-to-date Change: 10.2% | |
| WPM Links: Profile News Message Board | |
| Charts:- Daily , Weekly | |
| Add WPM to Watchlist: View: Get Complete WPM Trend Analysis ➞ | |
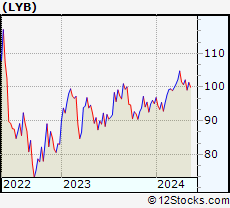 | LYB LyondellBasell Industries N.V. |
| Sector: Materials | |
| SubSector: Specialty Chemicals | |
| MarketCap: 16420.7 Millions | |
| Recent Price: 102.18 Smart Investing & Trading Score: 95 | |
| Day Percent Change: 0.72% Day Change: 0.73 | |
| Week Change: 3.09% Year-to-date Change: 7.5% | |
| LYB Links: Profile News Message Board | |
| Charts:- Daily , Weekly | |
| Add LYB to Watchlist: View: Get Complete LYB Trend Analysis ➞ | |
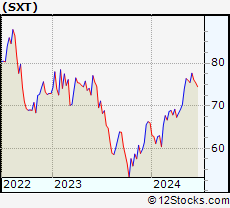 | SXT Sensient Technologies Corporation |
| Sector: Materials | |
| SubSector: Specialty Chemicals | |
| MarketCap: 1961.37 Millions | |
| Recent Price: 76.13 Smart Investing & Trading Score: 95 | |
| Day Percent Change: 0.67% Day Change: 0.51 | |
| Week Change: 2.88% Year-to-date Change: 15.4% | |
| SXT Links: Profile News Message Board | |
| Charts:- Daily , Weekly | |
| Add SXT to Watchlist: View: Get Complete SXT Trend Analysis ➞ | |
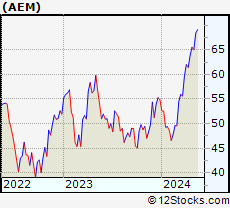 | AEM Agnico Eagle Mines Limited |
| Sector: Materials | |
| SubSector: Gold | |
| MarketCap: 9491.49 Millions | |
| Recent Price: 66.28 Smart Investing & Trading Score: 95 | |
| Day Percent Change: 0.61% Day Change: 0.40 | |
| Week Change: 1.91% Year-to-date Change: 20.8% | |
| AEM Links: Profile News Message Board | |
| Charts:- Daily , Weekly | |
| Add AEM to Watchlist: View: Get Complete AEM Trend Analysis ➞ | |
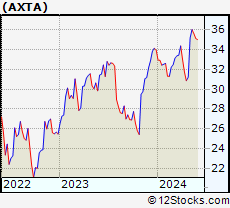 | AXTA Axalta Coating Systems Ltd. |
| Sector: Materials | |
| SubSector: Specialty Chemicals | |
| MarketCap: 3931.17 Millions | |
| Recent Price: 36.33 Smart Investing & Trading Score: 95 | |
| Day Percent Change: 0.41% Day Change: 0.15 | |
| Week Change: 3.21% Year-to-date Change: 7.0% | |
| AXTA Links: Profile News Message Board | |
| Charts:- Daily , Weekly | |
| Add AXTA to Watchlist: View: Get Complete AXTA Trend Analysis ➞ | |
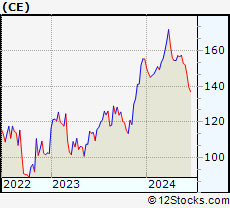 | CE Celanese Corporation |
| Sector: Materials | |
| SubSector: Chemicals - Major Diversified | |
| MarketCap: 8521.06 Millions | |
| Recent Price: 163.27 Smart Investing & Trading Score: 95 | |
| Day Percent Change: 0.33% Day Change: 0.54 | |
| Week Change: 3.88% Year-to-date Change: 5.1% | |
| CE Links: Profile News Message Board | |
| Charts:- Daily , Weekly | |
| Add CE to Watchlist: View: Get Complete CE Trend Analysis ➞ | |
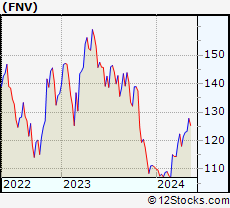 | FNV Franco-Nevada Corporation |
| Sector: Materials | |
| SubSector: Gold | |
| MarketCap: 17703.9 Millions | |
| Recent Price: 126.34 Smart Investing & Trading Score: 95 | |
| Day Percent Change: 0.25% Day Change: 0.31 | |
| Week Change: 2.51% Year-to-date Change: 14.0% | |
| FNV Links: Profile News Message Board | |
| Charts:- Daily , Weekly | |
| Add FNV to Watchlist: View: Get Complete FNV Trend Analysis ➞ | |
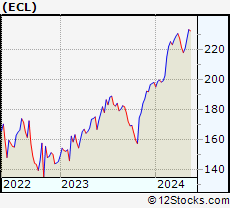 | ECL Ecolab Inc. |
| Sector: Materials | |
| SubSector: Specialty Chemicals | |
| MarketCap: 46215.9 Millions | |
| Recent Price: 233.23 Smart Investing & Trading Score: 95 | |
| Day Percent Change: 0.13% Day Change: 0.31 | |
| Week Change: 2.52% Year-to-date Change: 17.6% | |
| ECL Links: Profile News Message Board | |
| Charts:- Daily , Weekly | |
| Add ECL to Watchlist: View: Get Complete ECL Trend Analysis ➞ | |
| For tabular summary view of above stock list: Summary View ➞ 0 - 25 , 25 - 50 , 50 - 75 , 75 - 100 , 100 - 125 , 125 - 150 , 150 - 175 | ||
| Click To Change The Sort Order: By Market Cap or Company Size Performance: Year-to-date, Week and Day | |
| Select Chart Type: | ||
|
Best Stocks Today 12Stocks.com |
© 2024 12Stocks.com Terms & Conditions Privacy Contact Us
All Information Provided Only For Education And Not To Be Used For Investing or Trading. See Terms & Conditions


One More Thing ... Get Best Stocks Delivered Daily!
Never Ever Miss A Move With Our Top Ten Stocks Lists
Find Best Stocks In Any Market - Bull or Bear Market
Take A Peek At Our Top Ten Stocks Lists: Daily, Weekly, Year-to-Date & Top Trends
Find Best Stocks In Any Market - Bull or Bear Market
Take A Peek At Our Top Ten Stocks Lists: Daily, Weekly, Year-to-Date & Top Trends
Materials Stocks With Best Up Trends [0-bearish to 100-bullish]: Origin [100], TuanChe [100], Ramaco [100], Oil-Dri [100], Kinross Gold[100], Flavors[100], Ivanhoe Electric[100], American Vanguard[100], Sylvamo [100], Dow [100], Nutrien [100]
Best Materials Stocks Year-to-Date:
TuanChe [1046.09%], McEwen [68.93%], Perimeter [66.92%], Gatos Silver[60%], Coeur [56.44%], Hudbay Minerals[52.9%], IAMGOLD [49.41%], Harmony Gold[44.23%], Origin [43.55%], Endeavour Silver[39.09%], Century Aluminum[38.88%] Best Materials Stocks This Week:
Aceto [13.79%], Ramaco [12.62%], Flavors[12.22%], Trinseo S.A[11.67%], Ivanhoe Electric[11.23%], 5E Advanced[11.02%], Gold [9.51%], AdvanSix [8.99%], Northwest Pipe[8.83%], Kinross Gold[7.74%], Cabot [7.4%] Best Materials Stocks Daily:
Origin [10.00%], TuanChe [8.37%], Ramaco [6.39%], Oil-Dri [5.38%], Trinseo S.A[5.02%], Kinross Gold[4.87%], Gold [3.32%], Flavors[3.07%], Ivanhoe Electric[2.22%], 5E Advanced[2.17%], B2Gold [1.95%]