
 Login Sign Up


| |||||
 |  | ||||

| 12Stocks.com Market Intelligence |
Best Healthcare Stocks
 | "Discover best trending healthcare stocks with 12Stocks.com." |
| - Subu Vdaygiri, Founder, 12Stocks.com |
| In a hurry? Healthcare Stocks Lists: Performance Trends Table, Stock Charts
Sort Healthcare stocks: Daily, Weekly, Year-to-Date, Market Cap & Trends. Filter Healthcare stocks list by size:All Healthcare Large Mid-Range Small |
| 12Stocks.com Healthcare Stocks Performances & Trends Daily | |||||||||
|
|  The overall Smart Investing & Trading Score is 88 (0-bearish to 100-bullish) which puts Healthcare sector in short term bullish trend. The Smart Investing & Trading Score from previous trading session is 95 and hence a deterioration of trend.
| ||||||||
Here are the Smart Investing & Trading Scores of the most requested Healthcare stocks at 12Stocks.com (click stock name for detailed review):
|


| 12Stocks.com: Investing in Healthcare sector with Stocks | |
|
The following table helps investors and traders sort through current performance and trends (as measured by Smart Investing & Trading Score) of various
stocks in the Healthcare sector. Quick View: Move mouse or cursor over stock symbol (ticker) to view short-term Technical chart and over stock name to view long term chart. Click on  to add stock symbol to your watchlist and to add stock symbol to your watchlist and  to view watchlist. Click on any ticker or stock name for detailed market intelligence report for that stock. to view watchlist. Click on any ticker or stock name for detailed market intelligence report for that stock. |
12Stocks.com Performance of Stocks in Healthcare Sector
| Ticker | Stock Name | Watchlist | Category | Recent Price | Smart Investing & Trading Score | Change % | Weekly Change% |
| BMRA | Biomerica |   | Instruments | 0.67 | 74 | 9.24% | 13.13% |
| HYPR | Hyperfine | | Medical Devices | 0.89 | 62 | 6.20% | 13.05% |
| PODD | Insulet | | Instruments | 187.27 | 93 | 1.02% | 12.88% |
| EXAI | Exscientia | | Biotechnology | 5.20 | 64 | 1.36% | 12.80% |
| INO | Inovio | | Biotechnology | 12.00 | 68 | -6.18% | 12.68% |
| BYSI | BeyondSpring | | Biotechnology | 2.67 | 63 | -5.64% | 12.63% |
| PHAT | Phathom | | Biotechnology | 10.54 | 55 | -1.40% | 12.61% |
| XERS | Xeris | | Biotechnology | 1.98 | 47 | -1.98% | 12.50% |
| BLFS | BioLife | | Instruments | 21.96 | 68 | -2.31% | 12.38% |
| NEPH | Nephros | | Instruments | 2.36 | 64 | 3.96% | 12.38% |
| ARWR | Arrowhead | | Biotechnology | 24.79 | 50 | -0.86% | 12.27% |
| PETS | PetMed Express | | Delivery | 4.58 | 42 | -0.33% | 12.25% |
| IVA | Inventiva S.A | | Biotechnology | 3.79 | 100 | 3.89% | 12.25% |
| GLYC | GlycoMimetics | | Biotechnology | 0.30 | 32 | 6.44% | 12.23% |
| TWST | Twist Bioscience | | Laboratories | 47.01 | 68 | 1.10% | 11.80% |
| CYH | Community Health | | Hospitals | 3.61 | 68 | -2.70% | 11.76% |
| WRBY | Warby Parker | | Instruments | 16.53 | 95 | 2.42% | 11.76% |
| CHRS | Coherus BioSciences | | Biotechnology | 2.12 | 50 | -2.30% | 11.58% |
| ASRT | Assertio | | Pharmaceutical | 1.07 | 78 | 4.90% | 11.46% |
| WVE | Wave Life | | Biotechnology | 6.26 | 100 | 6.10% | 11.39% |
| LYEL | Lyell Immunopharma | | Biotechnology | 2.74 | 74 | -1.44% | 11.38% |
| GRTX | Galera | | Biotechnology | 0.20 | 64 | 0.36% | 11.30% |
| MRNA | Moderna | | Biotechnology | 132.90 | 95 | 0.17% | 11.23% |
| TNYA | Tenaya | | Biotechnology | 4.66 | 69 | 9.65% | 10.95% |
| CNSP | CNS | | Biotechnology | 0.22 | 67 | -3.51% | 10.94% |
| For chart view version of above stock list: Chart View ➞ 0 - 25 , 25 - 50 , 50 - 75 , 75 - 100 , 100 - 125 , 125 - 150 , 150 - 175 , 175 - 200 , 200 - 225 , 225 - 250 , 250 - 275 , 275 - 300 , 300 - 325 , 325 - 350 , 350 - 375 , 375 - 400 , 400 - 425 , 425 - 450 , 450 - 475 , 475 - 500 , 500 - 525 , 525 - 550 , 550 - 575 , 575 - 600 , 600 - 625 , 625 - 650 , 650 - 675 , 675 - 700 , 700 - 725 | ||
 | Click To Change The Sort Order: By Market Cap or Company Size Performance: Year-to-date, Week and Day |  |
|
Get the most comprehensive stock market coverage daily at 12Stocks.com ➞ Best Stocks Today ➞ Best Stocks Weekly ➞ Best Stocks Year-to-Date ➞ Best Stocks Trends ➞  Best Stocks Today 12Stocks.com Best Nasdaq Stocks ➞ Best S&P 500 Stocks ➞ Best Tech Stocks ➞ Best Biotech Stocks ➞ |
| Detailed Overview of Healthcare Stocks |
| Healthcare Technical Overview, Leaders & Laggards, Top Healthcare ETF Funds & Detailed Healthcare Stocks List, Charts, Trends & More |
| Healthcare Sector: Technical Analysis, Trends & YTD Performance | |
| Healthcare sector is composed of stocks
from pharmaceutical, biotech, diagnostics labs, insurance providers
and healthcare services. Healthcare sector, as represented by XLV, an exchange-traded fund [ETF] that holds basket of Healthcare stocks (e.g, Merck, Amgen) is up by 7.28% and is currently underperforming the overall market by -3.29% year-to-date. Below is a quick view of Technical charts and trends: |
|
 XLV Weekly Chart |
|
| Long Term Trend: Very Good | |
| Medium Term Trend: Very Good | |
 XLV Daily Chart |
|
| Short Term Trend: Good | |
| Overall Trend Score: 88 | |
| YTD Performance: 7.28% | |
| **Trend Scores & Views Are Only For Educational Purposes And Not For Investing | |
| 12Stocks.com: Top Performing Healthcare Sector Stocks | ||||||||||||||||||||||||||||||||||||||||||||||||
 The top performing Healthcare sector stocks year to date are
Now, more recently, over last week, the top performing Healthcare sector stocks on the move are


|
||||||||||||||||||||||||||||||||||||||||||||||||
| 12Stocks.com: Investing in Healthcare Sector using Exchange Traded Funds | |
|
The following table shows list of key exchange traded funds (ETF) that
help investors track Healthcare Index. For detailed view, check out our ETF Funds section of our website. Quick View: Move mouse or cursor over ETF symbol (ticker) to view short-term Technical chart and over ETF name to view long term chart. Click on ticker or stock name for detailed view. Click on to add stock symbol to your watchlist and to view watchlist. |
12Stocks.com List of ETFs that track Healthcare Index
| Ticker | ETF Name | Watchlist | Recent Price | Smart Investing & Trading Score | Change % | Week % | Year-to-date % |
| XLV | Health Care | | 146.31 | 88 | 0.19 | 1.89 | 7.28% |
| XBI | Biotech | | 91.18 | 45 | -0.91 | 3.45 | 2.12% |
| IBB | Biotechnology | | 136.69 | 70 | -0.44 | 2.47 | 0.62% |
| BBH | Biotech | | 167.99 | 83 | -0.43 | 2.4 | 1.62% |
| VHT | Health Care | | 267.11 | 75 | 0.00 | 1.88 | 6.55% |
| IYH | Healthcare | | 61.34 | 75 | 0.08 | 1.78 | 7.15% |
| IHF | Healthcare Providers | | 53.91 | 88 | 0.50 | 1.45 | 2.67% |
| IHI | Medical Devices | | 56.69 | 70 | -0.27 | 1.54 | 5.04% |
| BIB | Biotechnology | | 56.96 | 57 | -0.99 | 4.57 | -0.16% |
| BIS | Short Biotech | | 17.59 | 30 | 1.13 | -3.93 | -2.66% |
| XHE | Health Care Equipment | | 87.45 | 88 | -0.30 | 2.45 | 3.79% |
| CURE | Healthcare Bull 3X | | 119.10 | 82 | 0.46 | 5.46 | 17.06% |
| LABU | Biotech Bull 3X | | 111.79 | 47 | -2.79 | 10 | -8.35% |
| LABD | Biotech Bear 3X | | 7.95 | 53 | 2.71 | -9.86 | -17.96% |
| PSCH | SmallCap Health Care | | 43.40 | 71 | -0.31 | 0.99 | 1.39% |
| XHS | Health Care Services | | 91.55 | 76 | -0.22 | 2.24 | 2.92% |
| PTH | DWA Healthcare Momentum | | 42.63 | 52 | -0.46 | 2.03 | 8.92% |
| BTEC | Principal Healthcare Innovators | | 36.48 | 45 | -1.25 | 0.84 | 0.41% |
| RXL | Health Care | | 102.76 | 75 | 0.12 | 3.46 | 12.42% |
| RXD | Short Health Care | | 10.56 | 10 | 0.10 | -3.36 | -11.43% |
| 12Stocks.com: Charts, Trends, Fundamental Data and Performances of Healthcare Stocks | |
|
We now take in-depth look at all Healthcare stocks including charts, multi-period performances and overall trends (as measured by Smart Investing & Trading Score). One can sort Healthcare stocks (click link to choose) by Daily, Weekly and by Year-to-Date performances. Also, one can sort by size of the company or by market capitalization. |
| Select Your Default Chart Type: | |||||
| |||||
| Click on stock symbol or name for detailed view. Click on to add stock symbol to your watchlist and to view watchlist. Quick View: Move mouse or cursor over "Daily" to quickly view daily Technical stock chart and over "Weekly" to view weekly Technical stock chart. | |||||

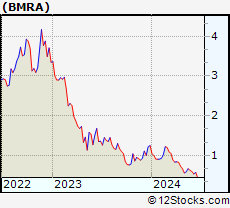 | BMRA Biomerica, Inc. |
| Sector: Health Care | |
| SubSector: Medical Instruments & Supplies | |
| MarketCap: 80.286 Millions | |
| Recent Price: 0.67 Smart Investing & Trading Score: 74 | |
| Day Percent Change: 9.24% Day Change: 0.06 | |
| Week Change: 13.13% Year-to-date Change: -46.8% | |
| BMRA Links: Profile News Message Board | |
| Charts:- Daily , Weekly | |
| Add BMRA to Watchlist: View: Get Complete BMRA Trend Analysis ➞ | |
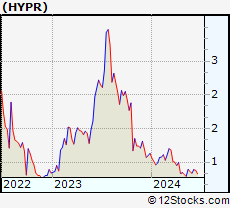 | HYPR Hyperfine, Inc. |
| Sector: Health Care | |
| SubSector: Medical Devices | |
| MarketCap: 154 Millions | |
| Recent Price: 0.89 Smart Investing & Trading Score: 62 | |
| Day Percent Change: 6.20% Day Change: 0.05 | |
| Week Change: 13.05% Year-to-date Change: -21.0% | |
| HYPR Links: Profile News Message Board | |
| Charts:- Daily , Weekly | |
| Add HYPR to Watchlist: View: Get Complete HYPR Trend Analysis ➞ | |
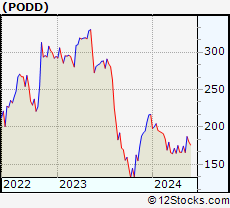 | PODD Insulet Corporation |
| Sector: Health Care | |
| SubSector: Medical Instruments & Supplies | |
| MarketCap: 9313.2 Millions | |
| Recent Price: 187.27 Smart Investing & Trading Score: 93 | |
| Day Percent Change: 1.02% Day Change: 1.89 | |
| Week Change: 12.88% Year-to-date Change: -13.7% | |
| PODD Links: Profile News Message Board | |
| Charts:- Daily , Weekly | |
| Add PODD to Watchlist: View: Get Complete PODD Trend Analysis ➞ | |
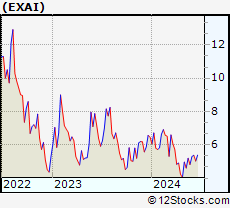 | EXAI Exscientia plc |
| Sector: Health Care | |
| SubSector: Biotechnology | |
| MarketCap: 796 Millions | |
| Recent Price: 5.20 Smart Investing & Trading Score: 64 | |
| Day Percent Change: 1.36% Day Change: 0.07 | |
| Week Change: 12.8% Year-to-date Change: -19.6% | |
| EXAI Links: Profile News Message Board | |
| Charts:- Daily , Weekly | |
| Add EXAI to Watchlist: View: Get Complete EXAI Trend Analysis ➞ | |
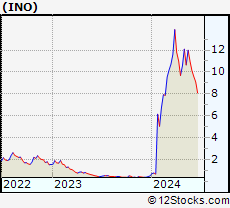 | INO Inovio Pharmaceuticals, Inc. |
| Sector: Health Care | |
| SubSector: Biotechnology | |
| MarketCap: 876.385 Millions | |
| Recent Price: 12.00 Smart Investing & Trading Score: 68 | |
| Day Percent Change: -6.18% Day Change: -0.79 | |
| Week Change: 12.68% Year-to-date Change: 2,252.9% | |
| INO Links: Profile News Message Board | |
| Charts:- Daily , Weekly | |
| Add INO to Watchlist: View: Get Complete INO Trend Analysis ➞ | |
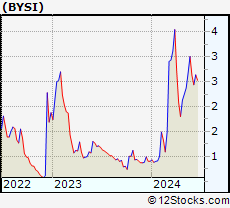 | BYSI BeyondSpring Inc. |
| Sector: Health Care | |
| SubSector: Biotechnology | |
| MarketCap: 432.785 Millions | |
| Recent Price: 2.67 Smart Investing & Trading Score: 63 | |
| Day Percent Change: -5.64% Day Change: -0.16 | |
| Week Change: 12.63% Year-to-date Change: 197.2% | |
| BYSI Links: Profile News Message Board | |
| Charts:- Daily , Weekly | |
| Add BYSI to Watchlist: View: Get Complete BYSI Trend Analysis ➞ | |
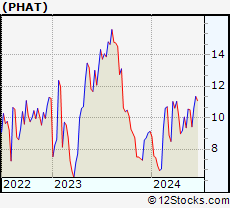 | PHAT Phathom Pharmaceuticals, Inc. |
| Sector: Health Care | |
| SubSector: Biotechnology | |
| MarketCap: 728.785 Millions | |
| Recent Price: 10.54 Smart Investing & Trading Score: 55 | |
| Day Percent Change: -1.40% Day Change: -0.15 | |
| Week Change: 12.61% Year-to-date Change: 15.4% | |
| PHAT Links: Profile News Message Board | |
| Charts:- Daily , Weekly | |
| Add PHAT to Watchlist: View: Get Complete PHAT Trend Analysis ➞ | |
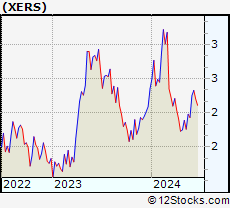 | XERS Xeris Pharmaceuticals, Inc. |
| Sector: Health Care | |
| SubSector: Biotechnology | |
| MarketCap: 74.5785 Millions | |
| Recent Price: 1.98 Smart Investing & Trading Score: 47 | |
| Day Percent Change: -1.98% Day Change: -0.04 | |
| Week Change: 12.5% Year-to-date Change: -15.9% | |
| XERS Links: Profile News Message Board | |
| Charts:- Daily , Weekly | |
| Add XERS to Watchlist: View: Get Complete XERS Trend Analysis ➞ | |
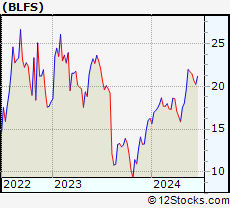 | BLFS BioLife Solutions, Inc. |
| Sector: Health Care | |
| SubSector: Medical Instruments & Supplies | |
| MarketCap: 264.36 Millions | |
| Recent Price: 21.96 Smart Investing & Trading Score: 68 | |
| Day Percent Change: -2.31% Day Change: -0.52 | |
| Week Change: 12.38% Year-to-date Change: 35.1% | |
| BLFS Links: Profile News Message Board | |
| Charts:- Daily , Weekly | |
| Add BLFS to Watchlist: View: Get Complete BLFS Trend Analysis ➞ | |
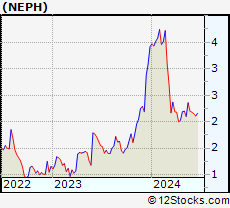 | NEPH Nephros, Inc. |
| Sector: Health Care | |
| SubSector: Medical Instruments & Supplies | |
| MarketCap: 69.486 Millions | |
| Recent Price: 2.36 Smart Investing & Trading Score: 64 | |
| Day Percent Change: 3.96% Day Change: 0.09 | |
| Week Change: 12.38% Year-to-date Change: -31.0% | |
| NEPH Links: Profile News Message Board | |
| Charts:- Daily , Weekly | |
| Add NEPH to Watchlist: View: Get Complete NEPH Trend Analysis ➞ | |
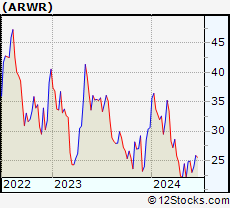 | ARWR Arrowhead Pharmaceuticals, Inc. |
| Sector: Health Care | |
| SubSector: Biotechnology | |
| MarketCap: 3226.15 Millions | |
| Recent Price: 24.79 Smart Investing & Trading Score: 50 | |
| Day Percent Change: -0.86% Day Change: -0.21 | |
| Week Change: 12.27% Year-to-date Change: -19.0% | |
| ARWR Links: Profile News Message Board | |
| Charts:- Daily , Weekly | |
| Add ARWR to Watchlist: View: Get Complete ARWR Trend Analysis ➞ | |
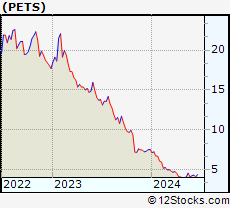 | PETS PetMed Express, Inc. |
| Sector: Health Care | |
| SubSector: Drug Delivery | |
| MarketCap: 528.23 Millions | |
| Recent Price: 4.58 Smart Investing & Trading Score: 42 | |
| Day Percent Change: -0.33% Day Change: -0.01 | |
| Week Change: 12.25% Year-to-date Change: -39.4% | |
| PETS Links: Profile News Message Board | |
| Charts:- Daily , Weekly | |
| Add PETS to Watchlist: View: Get Complete PETS Trend Analysis ➞ | |
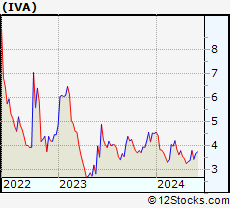 | IVA Inventiva S.A. |
| Sector: Health Care | |
| SubSector: Biotechnology | |
| MarketCap: 46487 Millions | |
| Recent Price: 3.79 Smart Investing & Trading Score: 100 | |
| Day Percent Change: 3.89% Day Change: 0.14 | |
| Week Change: 12.25% Year-to-date Change: -15.9% | |
| IVA Links: Profile News Message Board | |
| Charts:- Daily , Weekly | |
| Add IVA to Watchlist: View: Get Complete IVA Trend Analysis ➞ | |
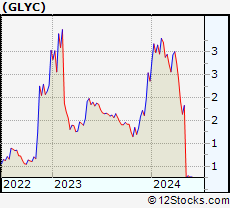 | GLYC GlycoMimetics, Inc. |
| Sector: Health Care | |
| SubSector: Biotechnology | |
| MarketCap: 100.785 Millions | |
| Recent Price: 0.30 Smart Investing & Trading Score: 32 | |
| Day Percent Change: 6.44% Day Change: 0.02 | |
| Week Change: 12.23% Year-to-date Change: -87.3% | |
| GLYC Links: Profile News Message Board | |
| Charts:- Daily , Weekly | |
| Add GLYC to Watchlist: View: Get Complete GLYC Trend Analysis ➞ | |
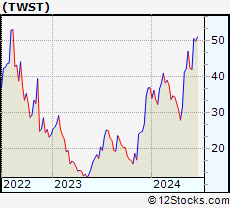 | TWST Twist Bioscience Corporation |
| Sector: Health Care | |
| SubSector: Medical Laboratories & Research | |
| MarketCap: 1065 Millions | |
| Recent Price: 47.01 Smart Investing & Trading Score: 68 | |
| Day Percent Change: 1.10% Day Change: 0.51 | |
| Week Change: 11.8% Year-to-date Change: 27.5% | |
| TWST Links: Profile News Message Board | |
| Charts:- Daily , Weekly | |
| Add TWST to Watchlist: View: Get Complete TWST Trend Analysis ➞ | |
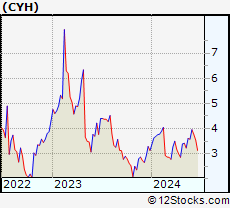 | CYH Community Health Systems, Inc. |
| Sector: Health Care | |
| SubSector: Hospitals | |
| MarketCap: 371.546 Millions | |
| Recent Price: 3.61 Smart Investing & Trading Score: 68 | |
| Day Percent Change: -2.70% Day Change: -0.10 | |
| Week Change: 11.76% Year-to-date Change: 15.3% | |
| CYH Links: Profile News Message Board | |
| Charts:- Daily , Weekly | |
| Add CYH to Watchlist: View: Get Complete CYH Trend Analysis ➞ | |
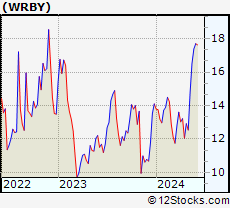 | WRBY Warby Parker Inc. |
| Sector: Health Care | |
| SubSector: Medical Instruments & Supplies | |
| MarketCap: 1380 Millions | |
| Recent Price: 16.53 Smart Investing & Trading Score: 95 | |
| Day Percent Change: 2.42% Day Change: 0.39 | |
| Week Change: 11.76% Year-to-date Change: 17.2% | |
| WRBY Links: Profile News Message Board | |
| Charts:- Daily , Weekly | |
| Add WRBY to Watchlist: View: Get Complete WRBY Trend Analysis ➞ | |
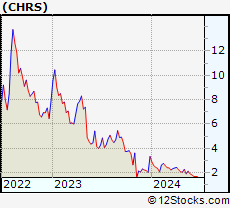 | CHRS Coherus BioSciences, Inc. |
| Sector: Health Care | |
| SubSector: Biotechnology | |
| MarketCap: 1073.45 Millions | |
| Recent Price: 2.12 Smart Investing & Trading Score: 50 | |
| Day Percent Change: -2.30% Day Change: -0.05 | |
| Week Change: 11.58% Year-to-date Change: -36.3% | |
| CHRS Links: Profile News Message Board | |
| Charts:- Daily , Weekly | |
| Add CHRS to Watchlist: View: Get Complete CHRS Trend Analysis ➞ | |
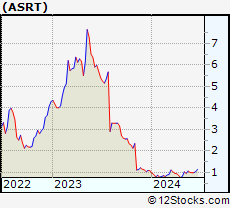 | ASRT Assertio Therapeutics, Inc. |
| Sector: Health Care | |
| SubSector: Drugs - Generic | |
| MarketCap: 65.8185 Millions | |
| Recent Price: 1.07 Smart Investing & Trading Score: 78 | |
| Day Percent Change: 4.90% Day Change: 0.05 | |
| Week Change: 11.46% Year-to-date Change: -0.9% | |
| ASRT Links: Profile News Message Board | |
| Charts:- Daily , Weekly | |
| Add ASRT to Watchlist: View: Get Complete ASRT Trend Analysis ➞ | |
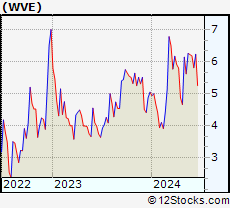 | WVE Wave Life Sciences Ltd. |
| Sector: Health Care | |
| SubSector: Biotechnology | |
| MarketCap: 452.785 Millions | |
| Recent Price: 6.26 Smart Investing & Trading Score: 100 | |
| Day Percent Change: 6.10% Day Change: 0.36 | |
| Week Change: 11.39% Year-to-date Change: 24.0% | |
| WVE Links: Profile News Message Board | |
| Charts:- Daily , Weekly | |
| Add WVE to Watchlist: View: Get Complete WVE Trend Analysis ➞ | |
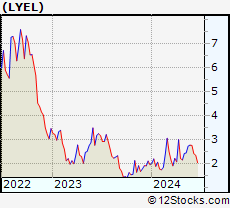 | LYEL Lyell Immunopharma, Inc. |
| Sector: Health Care | |
| SubSector: Biotechnology | |
| MarketCap: 809 Millions | |
| Recent Price: 2.74 Smart Investing & Trading Score: 74 | |
| Day Percent Change: -1.44% Day Change: -0.04 | |
| Week Change: 11.38% Year-to-date Change: 39.4% | |
| LYEL Links: Profile News Message Board | |
| Charts:- Daily , Weekly | |
| Add LYEL to Watchlist: View: Get Complete LYEL Trend Analysis ➞ | |
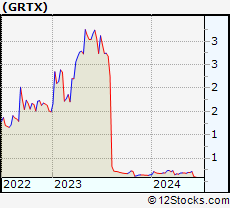 | GRTX Galera Therapeutics, Inc. |
| Sector: Health Care | |
| SubSector: Biotechnology | |
| MarketCap: 277.585 Millions | |
| Recent Price: 0.20 Smart Investing & Trading Score: 64 | |
| Day Percent Change: 0.36% Day Change: 0.00 | |
| Week Change: 11.3% Year-to-date Change: 34.8% | |
| GRTX Links: Profile News Message Board | |
| Charts:- Daily , Weekly | |
| Add GRTX to Watchlist: View: Get Complete GRTX Trend Analysis ➞ | |
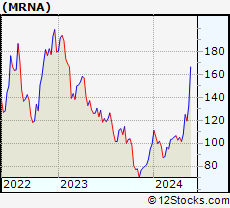 | MRNA Moderna, Inc. |
| Sector: Health Care | |
| SubSector: Biotechnology | |
| MarketCap: 11006.4 Millions | |
| Recent Price: 132.90 Smart Investing & Trading Score: 95 | |
| Day Percent Change: 0.17% Day Change: 0.22 | |
| Week Change: 11.23% Year-to-date Change: 33.6% | |
| MRNA Links: Profile News Message Board | |
| Charts:- Daily , Weekly | |
| Add MRNA to Watchlist: View: Get Complete MRNA Trend Analysis ➞ | |
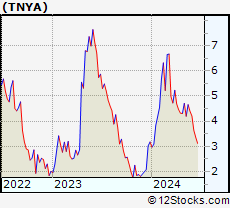 | TNYA Tenaya Therapeutics, Inc. |
| Sector: Health Care | |
| SubSector: Biotechnology | |
| MarketCap: 395 Millions | |
| Recent Price: 4.66 Smart Investing & Trading Score: 69 | |
| Day Percent Change: 9.65% Day Change: 0.41 | |
| Week Change: 10.95% Year-to-date Change: 46.5% | |
| TNYA Links: Profile News Message Board | |
| Charts:- Daily , Weekly | |
| Add TNYA to Watchlist: View: Get Complete TNYA Trend Analysis ➞ | |
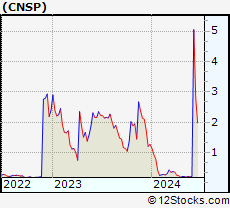 | CNSP CNS Pharmaceuticals, Inc. |
| Sector: Health Care | |
| SubSector: Biotechnology | |
| MarketCap: 53.6785 Millions | |
| Recent Price: 0.22 Smart Investing & Trading Score: 67 | |
| Day Percent Change: -3.51% Day Change: -0.01 | |
| Week Change: 10.94% Year-to-date Change: -82.9% | |
| CNSP Links: Profile News Message Board | |
| Charts:- Daily , Weekly | |
| Add CNSP to Watchlist: View: Get Complete CNSP Trend Analysis ➞ | |
| For tabular summary view of above stock list: Summary View ➞ 0 - 25 , 25 - 50 , 50 - 75 , 75 - 100 , 100 - 125 , 125 - 150 , 150 - 175 , 175 - 200 , 200 - 225 , 225 - 250 , 250 - 275 , 275 - 300 , 300 - 325 , 325 - 350 , 350 - 375 , 375 - 400 , 400 - 425 , 425 - 450 , 450 - 475 , 475 - 500 , 500 - 525 , 525 - 550 , 550 - 575 , 575 - 600 , 600 - 625 , 625 - 650 , 650 - 675 , 675 - 700 , 700 - 725 | ||
| Click To Change The Sort Order: By Market Cap or Company Size Performance: Year-to-date, Week and Day | |
| Select Chart Type: | ||
|
Best Stocks Today 12Stocks.com |
© 2024 12Stocks.com Terms & Conditions Privacy Contact Us
All Information Provided Only For Education And Not To Be Used For Investing or Trading. See Terms & Conditions


One More Thing ... Get Best Stocks Delivered Daily!
Never Ever Miss A Move With Our Top Ten Stocks Lists
Find Best Stocks In Any Market - Bull or Bear Market
Take A Peek At Our Top Ten Stocks Lists: Daily, Weekly, Year-to-Date & Top Trends
Find Best Stocks In Any Market - Bull or Bear Market
Take A Peek At Our Top Ten Stocks Lists: Daily, Weekly, Year-to-Date & Top Trends
Healthcare Stocks With Best Up Trends [0-bearish to 100-bullish]: Nurix [100], Wave Life[100], Innate Pharma[100], Inventiva S.A[100], Harrow Health[100], Arbutus Biopharma[100], Avidity Biosciences[100], Integer [100], Quest Diagnostics[100], BeiGene [100], Zura Bio[100]
Best Healthcare Stocks Year-to-Date:
Pieris [6081.32%], Precision BioSciences[3297.26%], Inovio [2252.94%], Avenue [2216.77%], Assembly Biosciences[1671.74%], Aurora Cannabis[1449.77%], Agenus [1211.75%], NuCana [1106.9%], Adverum Biotechnologies[962.7%], Burning Rock[760.19%], Affimed N.V[738.4%] Best Healthcare Stocks This Week:
Burning Rock[946.66%], Vaxxinity [58.82%], Novavax [46.51%], Vicarious Surgical[45.62%], Harrow Health[44.48%], ProKidney [44.31%], Acutus [43.9%], Annovis Bio[40.13%], InflaRx N.V[38.14%], AC Immune[37.66%], Vaxart [36%] Best Healthcare Stocks Daily:
Vaxxinity [45.95%], Acutus [31.11%], Vicarious Surgical[27.93%], Doximity [18.07%], Orchestra BioMed[12.77%], InflaRx N.V[12.41%], Fortress Biotech[9.66%], Tenaya [9.65%], Sharecare [9.12%], AirSculpt Technologies[7.87%], Autolus [7.86%]