
 Login Sign Up


| |||||
 |  | ||||

| 12Stocks.com Market Intelligence |
Best Healthcare Stocks
 | "Discover best trending healthcare stocks with 12Stocks.com." |
| - Subu Vdaygiri, Founder, 12Stocks.com |
| In a hurry? Healthcare Stocks Lists: Performance Trends Table, Stock Charts
Sort Healthcare stocks: Daily, Weekly, Year-to-Date, Market Cap & Trends. Filter Healthcare stocks list by size:All Healthcare Large Mid-Range Small |
| 12Stocks.com Healthcare Stocks Performances & Trends Daily | |||||||||
|
|  The overall Smart Investing & Trading Score is 88 (0-bearish to 100-bullish) which puts Healthcare sector in short term bullish trend. The Smart Investing & Trading Score from previous trading session is 95 and hence a deterioration of trend.
| ||||||||
Here are the Smart Investing & Trading Scores of the most requested Healthcare stocks at 12Stocks.com (click stock name for detailed review):
|


| 12Stocks.com: Investing in Healthcare sector with Stocks | |
|
The following table helps investors and traders sort through current performance and trends (as measured by Smart Investing & Trading Score) of various
stocks in the Healthcare sector. Quick View: Move mouse or cursor over stock symbol (ticker) to view short-term Technical chart and over stock name to view long term chart. Click on  to add stock symbol to your watchlist and to add stock symbol to your watchlist and  to view watchlist. Click on any ticker or stock name for detailed market intelligence report for that stock. to view watchlist. Click on any ticker or stock name for detailed market intelligence report for that stock. |
12Stocks.com Performance of Stocks in Healthcare Sector
| Ticker | Stock Name | Watchlist | Category | Recent Price | Smart Investing & Trading Score | Change % | Weekly Change% |
| OLMA | Olema |   | Biotechnology | 9.84 | 20 | 1.86% | 5.58% |
| MOR | MorphoSys AG | | Biotechnology | 19.00 | 78 | -1.76% | 5.56% |
| ETON | Eton | | Biotechnology | 3.62 | 32 | -0.82% | 5.54% |
| PRTA | Prothena | | Biotechnology | 22.52 | 62 | -3.72% | 5.53% |
| KPTI | Karyopharm | | Biotechnology | 1.15 | 57 | 1.32% | 5.50% |
| AIH | Aesthetic | | Specialized | 0.50 | 67 | 0.24% | 5.47% |
| GALT | Galectin | | Biotechnology | 3.19 | 68 | 2.40% | 5.45% |
| NERV | Minerva Neurosciences | | Biotechnology | 2.52 | 47 | -1.91% | 5.44% |
| AHCO | AdaptHealth | | Equipment | 9.98 | 42 | 1.32% | 5.44% |
| LQDA | Liquidia Technologies | | Biotechnology | 12.71 | 50 | -0.24% | 5.39% |
| VRTX | Vertex | | Biotechnology | 445.21 | 95 | 1.04% | 5.31% |
| TYRA | Tyra Biosciences | | Biotechnology | 18.26 | 42 | -4.40% | 5.24% |
| CDMO | Avid Bioservices | | Biotechnology | 9.12 | 75 | -0.87% | 5.19% |
| KRYS | Krystal Biotech | | Biotechnology | 164.10 | 78 | 0.20% | 5.17% |
| RVMD | Revolution Medicines | | Biotechnology | 39.41 | 81 | 1.08% | 5.07% |
| AXGN | AxoGen | | Equipment | 6.04 | 42 | 1.17% | 5.04% |
| AXSM | Axsome | | Biotechnology | 76.13 | 25 | -1.69% | 5.01% |
| CNMD | CONMED | | Equipment | 74.72 | 69 | -1.03% | 5.00% |
| PDEX | Pro-Dex | | Instruments | 19.54 | 83 | -3.55% | 5.00% |
| OVID | Ovid | | Biotechnology | 3.15 | 32 | -3.82% | 5.00% |
| CGEN | Compugen | | Biotechnology | 2.11 | 32 | -1.40% | 4.98% |
| PRTC | PureTech Health | | Biotechnology | 28.50 | 88 | -0.63% | 4.97% |
| MBOT | Microbot | | Instruments | 0.97 | 57 | 1.70% | 4.93% |
| USNA | USANA Health | | Pharmaceutical | 48.99 | 95 | 0.97% | 4.88% |
| EGRX | Eagle | | Pharmaceutical | 4.76 | 64 | 0.21% | 4.85% |
| For chart view version of above stock list: Chart View ➞ 0 - 25 , 25 - 50 , 50 - 75 , 75 - 100 , 100 - 125 , 125 - 150 , 150 - 175 , 175 - 200 , 200 - 225 , 225 - 250 , 250 - 275 , 275 - 300 , 300 - 325 , 325 - 350 , 350 - 375 , 375 - 400 , 400 - 425 , 425 - 450 , 450 - 475 , 475 - 500 , 500 - 525 , 525 - 550 , 550 - 575 , 575 - 600 , 600 - 625 , 625 - 650 , 650 - 675 , 675 - 700 , 700 - 725 | ||
 | Click To Change The Sort Order: By Market Cap or Company Size Performance: Year-to-date, Week and Day |  |
|
Get the most comprehensive stock market coverage daily at 12Stocks.com ➞ Best Stocks Today ➞ Best Stocks Weekly ➞ Best Stocks Year-to-Date ➞ Best Stocks Trends ➞  Best Stocks Today 12Stocks.com Best Nasdaq Stocks ➞ Best S&P 500 Stocks ➞ Best Tech Stocks ➞ Best Biotech Stocks ➞ |
| Detailed Overview of Healthcare Stocks |
| Healthcare Technical Overview, Leaders & Laggards, Top Healthcare ETF Funds & Detailed Healthcare Stocks List, Charts, Trends & More |
| Healthcare Sector: Technical Analysis, Trends & YTD Performance | |
| Healthcare sector is composed of stocks
from pharmaceutical, biotech, diagnostics labs, insurance providers
and healthcare services. Healthcare sector, as represented by XLV, an exchange-traded fund [ETF] that holds basket of Healthcare stocks (e.g, Merck, Amgen) is up by 7.28% and is currently underperforming the overall market by -3.29% year-to-date. Below is a quick view of Technical charts and trends: |
|
 XLV Weekly Chart |
|
| Long Term Trend: Very Good | |
| Medium Term Trend: Very Good | |
 XLV Daily Chart |
|
| Short Term Trend: Good | |
| Overall Trend Score: 88 | |
| YTD Performance: 7.28% | |
| **Trend Scores & Views Are Only For Educational Purposes And Not For Investing | |
| 12Stocks.com: Top Performing Healthcare Sector Stocks | ||||||||||||||||||||||||||||||||||||||||||||||||
 The top performing Healthcare sector stocks year to date are
Now, more recently, over last week, the top performing Healthcare sector stocks on the move are


|
||||||||||||||||||||||||||||||||||||||||||||||||
| 12Stocks.com: Investing in Healthcare Sector using Exchange Traded Funds | |
|
The following table shows list of key exchange traded funds (ETF) that
help investors track Healthcare Index. For detailed view, check out our ETF Funds section of our website. Quick View: Move mouse or cursor over ETF symbol (ticker) to view short-term Technical chart and over ETF name to view long term chart. Click on ticker or stock name for detailed view. Click on to add stock symbol to your watchlist and to view watchlist. |
12Stocks.com List of ETFs that track Healthcare Index
| Ticker | ETF Name | Watchlist | Recent Price | Smart Investing & Trading Score | Change % | Week % | Year-to-date % |
| XLV | Health Care | | 146.31 | 88 | 0.19 | 1.89 | 7.28% |
| XBI | Biotech | | 91.18 | 45 | -0.91 | 3.45 | 2.12% |
| IBB | Biotechnology | | 136.69 | 70 | -0.44 | 2.47 | 0.62% |
| BBH | Biotech | | 167.99 | 83 | -0.43 | 2.4 | 1.62% |
| VHT | Health Care | | 267.11 | 75 | 0.00 | 1.88 | 6.55% |
| IYH | Healthcare | | 61.34 | 75 | 0.08 | 1.78 | 7.15% |
| IHF | Healthcare Providers | | 53.91 | 88 | 0.50 | 1.45 | 2.67% |
| IHI | Medical Devices | | 56.69 | 70 | -0.27 | 1.54 | 5.04% |
| BIB | Biotechnology | | 56.96 | 57 | -0.99 | 4.57 | -0.16% |
| BIS | Short Biotech | | 17.59 | 30 | 1.13 | -3.93 | -2.66% |
| XHE | Health Care Equipment | | 87.45 | 88 | -0.30 | 2.45 | 3.79% |
| CURE | Healthcare Bull 3X | | 119.10 | 82 | 0.46 | 5.46 | 17.06% |
| LABU | Biotech Bull 3X | | 111.79 | 47 | -2.79 | 10 | -8.35% |
| LABD | Biotech Bear 3X | | 7.95 | 53 | 2.71 | -9.86 | -17.96% |
| PSCH | SmallCap Health Care | | 43.40 | 71 | -0.31 | 0.99 | 1.39% |
| XHS | Health Care Services | | 91.55 | 76 | -0.22 | 2.24 | 2.92% |
| PTH | DWA Healthcare Momentum | | 42.63 | 52 | -0.46 | 2.03 | 8.92% |
| BTEC | Principal Healthcare Innovators | | 36.48 | 45 | -1.25 | 0.84 | 0.41% |
| RXL | Health Care | | 102.76 | 75 | 0.12 | 3.46 | 12.42% |
| RXD | Short Health Care | | 10.56 | 10 | 0.10 | -3.36 | -11.43% |
| 12Stocks.com: Charts, Trends, Fundamental Data and Performances of Healthcare Stocks | |
|
We now take in-depth look at all Healthcare stocks including charts, multi-period performances and overall trends (as measured by Smart Investing & Trading Score). One can sort Healthcare stocks (click link to choose) by Daily, Weekly and by Year-to-Date performances. Also, one can sort by size of the company or by market capitalization. |
| Select Your Default Chart Type: | |||||
| |||||
| Click on stock symbol or name for detailed view. Click on to add stock symbol to your watchlist and to view watchlist. Quick View: Move mouse or cursor over "Daily" to quickly view daily Technical stock chart and over "Weekly" to view weekly Technical stock chart. | |||||

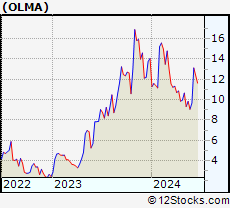 | OLMA Olema Pharmaceuticals, Inc. |
| Sector: Health Care | |
| SubSector: Biotechnology | |
| MarketCap: 17687 Millions | |
| Recent Price: 9.84 Smart Investing & Trading Score: 20 | |
| Day Percent Change: 1.86% Day Change: 0.18 | |
| Week Change: 5.58% Year-to-date Change: -30.0% | |
| OLMA Links: Profile News Message Board | |
| Charts:- Daily , Weekly | |
| Add OLMA to Watchlist: View: Get Complete OLMA Trend Analysis ➞ | |
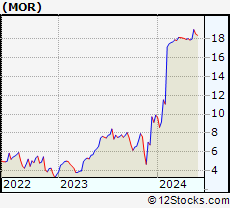 | MOR MorphoSys AG |
| Sector: Health Care | |
| SubSector: Biotechnology | |
| MarketCap: 2636.85 Millions | |
| Recent Price: 19.00 Smart Investing & Trading Score: 78 | |
| Day Percent Change: -1.76% Day Change: -0.34 | |
| Week Change: 5.56% Year-to-date Change: 91.9% | |
| MOR Links: Profile News Message Board | |
| Charts:- Daily , Weekly | |
| Add MOR to Watchlist: View: Get Complete MOR Trend Analysis ➞ | |
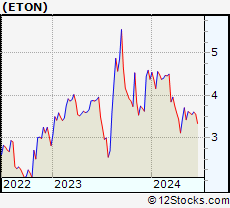 | ETON Eton Pharmaceuticals, Inc. |
| Sector: Health Care | |
| SubSector: Biotechnology | |
| MarketCap: 65.0785 Millions | |
| Recent Price: 3.62 Smart Investing & Trading Score: 32 | |
| Day Percent Change: -0.82% Day Change: -0.03 | |
| Week Change: 5.54% Year-to-date Change: -17.4% | |
| ETON Links: Profile News Message Board | |
| Charts:- Daily , Weekly | |
| Add ETON to Watchlist: View: Get Complete ETON Trend Analysis ➞ | |
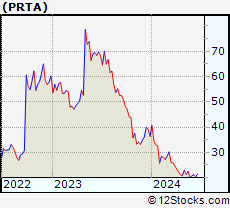 | PRTA Prothena Corporation plc |
| Sector: Health Care | |
| SubSector: Biotechnology | |
| MarketCap: 357.985 Millions | |
| Recent Price: 22.52 Smart Investing & Trading Score: 62 | |
| Day Percent Change: -3.72% Day Change: -0.87 | |
| Week Change: 5.53% Year-to-date Change: -38.0% | |
| PRTA Links: Profile News Message Board | |
| Charts:- Daily , Weekly | |
| Add PRTA to Watchlist: View: Get Complete PRTA Trend Analysis ➞ | |
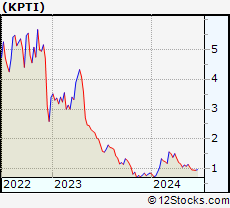 | KPTI Karyopharm Therapeutics Inc. |
| Sector: Health Care | |
| SubSector: Biotechnology | |
| MarketCap: 1471.85 Millions | |
| Recent Price: 1.15 Smart Investing & Trading Score: 57 | |
| Day Percent Change: 1.32% Day Change: 0.01 | |
| Week Change: 5.5% Year-to-date Change: 33.0% | |
| KPTI Links: Profile News Message Board | |
| Charts:- Daily , Weekly | |
| Add KPTI to Watchlist: View: Get Complete KPTI Trend Analysis ➞ | |
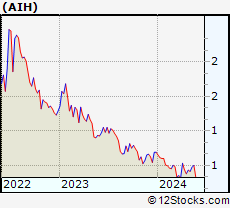 | AIH Aesthetic Medical International Holdings Group Limited |
| Sector: Health Care | |
| SubSector: Specialized Health Services | |
| MarketCap: 205.356 Millions | |
| Recent Price: 0.50 Smart Investing & Trading Score: 67 | |
| Day Percent Change: 0.24% Day Change: 0.00 | |
| Week Change: 5.47% Year-to-date Change: -27.6% | |
| AIH Links: Profile News Message Board | |
| Charts:- Daily , Weekly | |
| Add AIH to Watchlist: View: Get Complete AIH Trend Analysis ➞ | |
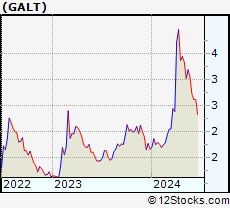 | GALT Galectin Therapeutics, Inc. |
| Sector: Health Care | |
| SubSector: Biotechnology | |
| MarketCap: 114.185 Millions | |
| Recent Price: 3.19 Smart Investing & Trading Score: 68 | |
| Day Percent Change: 2.40% Day Change: 0.07 | |
| Week Change: 5.45% Year-to-date Change: 92.5% | |
| GALT Links: Profile News Message Board | |
| Charts:- Daily , Weekly | |
| Add GALT to Watchlist: View: Get Complete GALT Trend Analysis ➞ | |
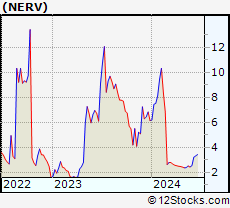 | NERV Minerva Neurosciences, Inc. |
| Sector: Health Care | |
| SubSector: Biotechnology | |
| MarketCap: 223.385 Millions | |
| Recent Price: 2.52 Smart Investing & Trading Score: 47 | |
| Day Percent Change: -1.91% Day Change: -0.05 | |
| Week Change: 5.44% Year-to-date Change: -59.0% | |
| NERV Links: Profile News Message Board | |
| Charts:- Daily , Weekly | |
| Add NERV to Watchlist: View: Get Complete NERV Trend Analysis ➞ | |
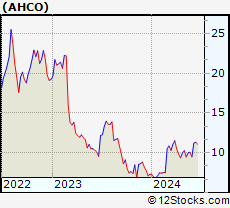 | AHCO AdaptHealth Corp. |
| Sector: Health Care | |
| SubSector: Medical Appliances & Equipment | |
| MarketCap: 1084.8 Millions | |
| Recent Price: 9.98 Smart Investing & Trading Score: 42 | |
| Day Percent Change: 1.32% Day Change: 0.13 | |
| Week Change: 5.44% Year-to-date Change: 36.9% | |
| AHCO Links: Profile News Message Board | |
| Charts:- Daily , Weekly | |
| Add AHCO to Watchlist: View: Get Complete AHCO Trend Analysis ➞ | |
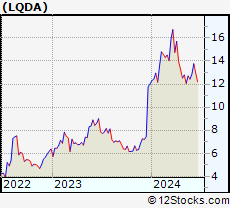 | LQDA Liquidia Technologies, Inc. |
| Sector: Health Care | |
| SubSector: Biotechnology | |
| MarketCap: 80.4785 Millions | |
| Recent Price: 12.71 Smart Investing & Trading Score: 50 | |
| Day Percent Change: -0.24% Day Change: -0.03 | |
| Week Change: 5.39% Year-to-date Change: 5.7% | |
| LQDA Links: Profile News Message Board | |
| Charts:- Daily , Weekly | |
| Add LQDA to Watchlist: View: Get Complete LQDA Trend Analysis ➞ | |
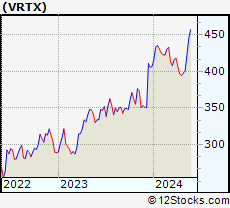 | VRTX Vertex Pharmaceuticals Incorporated |
| Sector: Health Care | |
| SubSector: Biotechnology | |
| MarketCap: 57669.6 Millions | |
| Recent Price: 445.21 Smart Investing & Trading Score: 95 | |
| Day Percent Change: 1.04% Day Change: 4.57 | |
| Week Change: 5.31% Year-to-date Change: 9.4% | |
| VRTX Links: Profile News Message Board | |
| Charts:- Daily , Weekly | |
| Add VRTX to Watchlist: View: Get Complete VRTX Trend Analysis ➞ | |
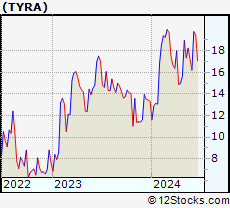 | TYRA Tyra Biosciences, Inc. |
| Sector: Health Care | |
| SubSector: Biotechnology | |
| MarketCap: 732 Millions | |
| Recent Price: 18.26 Smart Investing & Trading Score: 42 | |
| Day Percent Change: -4.40% Day Change: -0.84 | |
| Week Change: 5.24% Year-to-date Change: 37.0% | |
| TYRA Links: Profile News Message Board | |
| Charts:- Daily , Weekly | |
| Add TYRA to Watchlist: View: Get Complete TYRA Trend Analysis ➞ | |
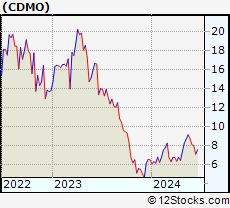 | CDMO Avid Bioservices, Inc. |
| Sector: Health Care | |
| SubSector: Biotechnology | |
| MarketCap: 203.685 Millions | |
| Recent Price: 9.12 Smart Investing & Trading Score: 75 | |
| Day Percent Change: -0.87% Day Change: -0.08 | |
| Week Change: 5.19% Year-to-date Change: 40.3% | |
| CDMO Links: Profile News Message Board | |
| Charts:- Daily , Weekly | |
| Add CDMO to Watchlist: View: Get Complete CDMO Trend Analysis ➞ | |
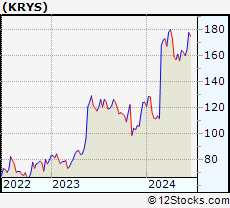 | KRYS Krystal Biotech, Inc. |
| Sector: Health Care | |
| SubSector: Biotechnology | |
| MarketCap: 874.085 Millions | |
| Recent Price: 164.10 Smart Investing & Trading Score: 78 | |
| Day Percent Change: 0.20% Day Change: 0.32 | |
| Week Change: 5.17% Year-to-date Change: 32.3% | |
| KRYS Links: Profile News Message Board | |
| Charts:- Daily , Weekly | |
| Add KRYS to Watchlist: View: Get Complete KRYS Trend Analysis ➞ | |
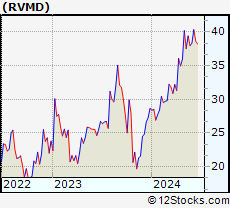 | RVMD Revolution Medicines, Inc. |
| Sector: Health Care | |
| SubSector: Biotechnology | |
| MarketCap: 28087 Millions | |
| Recent Price: 39.41 Smart Investing & Trading Score: 81 | |
| Day Percent Change: 1.08% Day Change: 0.42 | |
| Week Change: 5.07% Year-to-date Change: 37.4% | |
| RVMD Links: Profile News Message Board | |
| Charts:- Daily , Weekly | |
| Add RVMD to Watchlist: View: Get Complete RVMD Trend Analysis ➞ | |
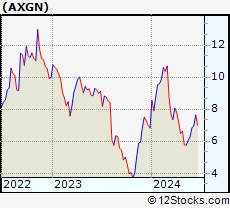 | AXGN AxoGen, Inc. |
| Sector: Health Care | |
| SubSector: Medical Appliances & Equipment | |
| MarketCap: 349.28 Millions | |
| Recent Price: 6.04 Smart Investing & Trading Score: 42 | |
| Day Percent Change: 1.17% Day Change: 0.07 | |
| Week Change: 5.04% Year-to-date Change: -11.6% | |
| AXGN Links: Profile News Message Board | |
| Charts:- Daily , Weekly | |
| Add AXGN to Watchlist: View: Get Complete AXGN Trend Analysis ➞ | |
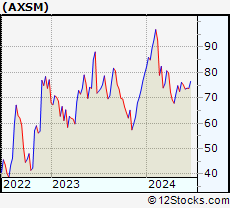 | AXSM Axsome Therapeutics, Inc. |
| Sector: Health Care | |
| SubSector: Biotechnology | |
| MarketCap: 2284.25 Millions | |
| Recent Price: 76.13 Smart Investing & Trading Score: 25 | |
| Day Percent Change: -1.69% Day Change: -1.31 | |
| Week Change: 5.01% Year-to-date Change: -4.4% | |
| AXSM Links: Profile News Message Board | |
| Charts:- Daily , Weekly | |
| Add AXSM to Watchlist: View: Get Complete AXSM Trend Analysis ➞ | |
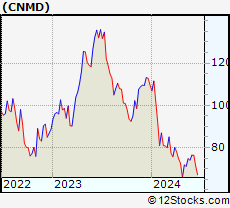 | CNMD CONMED Corporation |
| Sector: Health Care | |
| SubSector: Medical Appliances & Equipment | |
| MarketCap: 1589.2 Millions | |
| Recent Price: 74.72 Smart Investing & Trading Score: 69 | |
| Day Percent Change: -1.03% Day Change: -0.78 | |
| Week Change: 5% Year-to-date Change: -31.8% | |
| CNMD Links: Profile News Message Board | |
| Charts:- Daily , Weekly | |
| Add CNMD to Watchlist: View: Get Complete CNMD Trend Analysis ➞ | |
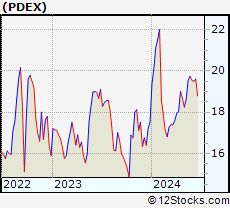 | PDEX Pro-Dex, Inc. |
| Sector: Health Care | |
| SubSector: Medical Instruments & Supplies | |
| MarketCap: 57.486 Millions | |
| Recent Price: 19.54 Smart Investing & Trading Score: 83 | |
| Day Percent Change: -3.55% Day Change: -0.72 | |
| Week Change: 5% Year-to-date Change: 11.5% | |
| PDEX Links: Profile News Message Board | |
| Charts:- Daily , Weekly | |
| Add PDEX to Watchlist: View: Get Complete PDEX Trend Analysis ➞ | |
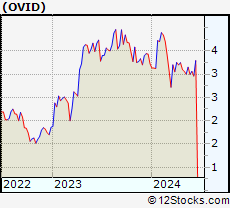 | OVID Ovid Therapeutics Inc. |
| Sector: Health Care | |
| SubSector: Biotechnology | |
| MarketCap: 130.385 Millions | |
| Recent Price: 3.15 Smart Investing & Trading Score: 32 | |
| Day Percent Change: -3.82% Day Change: -0.13 | |
| Week Change: 5% Year-to-date Change: -2.2% | |
| OVID Links: Profile News Message Board | |
| Charts:- Daily , Weekly | |
| Add OVID to Watchlist: View: Get Complete OVID Trend Analysis ➞ | |
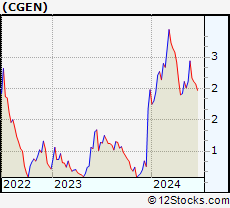 | CGEN Compugen Ltd. |
| Sector: Health Care | |
| SubSector: Biotechnology | |
| MarketCap: 634.285 Millions | |
| Recent Price: 2.11 Smart Investing & Trading Score: 32 | |
| Day Percent Change: -1.40% Day Change: -0.03 | |
| Week Change: 4.98% Year-to-date Change: 6.6% | |
| CGEN Links: Profile News Message Board | |
| Charts:- Daily , Weekly | |
| Add CGEN to Watchlist: View: Get Complete CGEN Trend Analysis ➞ | |
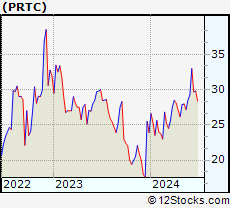 | PRTC PureTech Health plc |
| Sector: Health Care | |
| SubSector: Biotechnology | |
| MarketCap: 819 Millions | |
| Recent Price: 28.50 Smart Investing & Trading Score: 88 | |
| Day Percent Change: -0.63% Day Change: -0.18 | |
| Week Change: 4.97% Year-to-date Change: 19.2% | |
| PRTC Links: Profile News Message Board | |
| Charts:- Daily , Weekly | |
| Add PRTC to Watchlist: View: Get Complete PRTC Trend Analysis ➞ | |
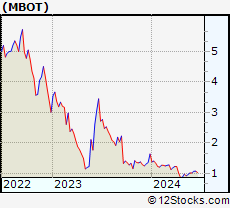 | MBOT Microbot Medical Inc. |
| Sector: Health Care | |
| SubSector: Medical Instruments & Supplies | |
| MarketCap: 51.986 Millions | |
| Recent Price: 0.97 Smart Investing & Trading Score: 57 | |
| Day Percent Change: 1.70% Day Change: 0.02 | |
| Week Change: 4.93% Year-to-date Change: -40.9% | |
| MBOT Links: Profile News Message Board | |
| Charts:- Daily , Weekly | |
| Add MBOT to Watchlist: View: Get Complete MBOT Trend Analysis ➞ | |
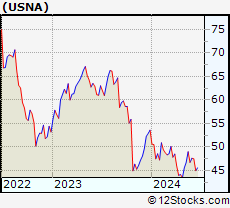 | USNA USANA Health Sciences, Inc. |
| Sector: Health Care | |
| SubSector: Drug Related Products | |
| MarketCap: 1185.13 Millions | |
| Recent Price: 48.99 Smart Investing & Trading Score: 95 | |
| Day Percent Change: 0.97% Day Change: 0.47 | |
| Week Change: 4.88% Year-to-date Change: -8.6% | |
| USNA Links: Profile News Message Board | |
| Charts:- Daily , Weekly | |
| Add USNA to Watchlist: View: Get Complete USNA Trend Analysis ➞ | |
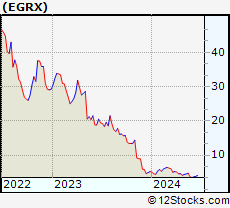 | EGRX Eagle Pharmaceuticals, Inc. |
| Sector: Health Care | |
| SubSector: Drugs - Generic | |
| MarketCap: 573.385 Millions | |
| Recent Price: 4.76 Smart Investing & Trading Score: 64 | |
| Day Percent Change: 0.21% Day Change: 0.01 | |
| Week Change: 4.85% Year-to-date Change: -9.0% | |
| EGRX Links: Profile News Message Board | |
| Charts:- Daily , Weekly | |
| Add EGRX to Watchlist: View: Get Complete EGRX Trend Analysis ➞ | |
| For tabular summary view of above stock list: Summary View ➞ 0 - 25 , 25 - 50 , 50 - 75 , 75 - 100 , 100 - 125 , 125 - 150 , 150 - 175 , 175 - 200 , 200 - 225 , 225 - 250 , 250 - 275 , 275 - 300 , 300 - 325 , 325 - 350 , 350 - 375 , 375 - 400 , 400 - 425 , 425 - 450 , 450 - 475 , 475 - 500 , 500 - 525 , 525 - 550 , 550 - 575 , 575 - 600 , 600 - 625 , 625 - 650 , 650 - 675 , 675 - 700 , 700 - 725 | ||
| Click To Change The Sort Order: By Market Cap or Company Size Performance: Year-to-date, Week and Day | |
| Select Chart Type: | ||
|
Best Stocks Today 12Stocks.com |
© 2024 12Stocks.com Terms & Conditions Privacy Contact Us
All Information Provided Only For Education And Not To Be Used For Investing or Trading. See Terms & Conditions


One More Thing ... Get Best Stocks Delivered Daily!
Never Ever Miss A Move With Our Top Ten Stocks Lists
Find Best Stocks In Any Market - Bull or Bear Market
Take A Peek At Our Top Ten Stocks Lists: Daily, Weekly, Year-to-Date & Top Trends
Find Best Stocks In Any Market - Bull or Bear Market
Take A Peek At Our Top Ten Stocks Lists: Daily, Weekly, Year-to-Date & Top Trends
Healthcare Stocks With Best Up Trends [0-bearish to 100-bullish]: Nurix [100], Wave Life[100], Innate Pharma[100], Inventiva S.A[100], Harrow Health[100], Arbutus Biopharma[100], Avidity Biosciences[100], Integer [100], Quest Diagnostics[100], BeiGene [100], Zura Bio[100]
Best Healthcare Stocks Year-to-Date:
Pieris [6081.32%], Precision BioSciences[3297.26%], Inovio [2252.94%], Avenue [2216.77%], Assembly Biosciences[1671.74%], Aurora Cannabis[1449.77%], Agenus [1211.75%], NuCana [1106.9%], Adverum Biotechnologies[962.7%], Burning Rock[760.19%], Affimed N.V[738.4%] Best Healthcare Stocks This Week:
Burning Rock[946.66%], Vaxxinity [58.82%], Novavax [46.51%], Vicarious Surgical[45.62%], Harrow Health[44.48%], ProKidney [44.31%], Acutus [43.9%], Annovis Bio[40.13%], InflaRx N.V[38.14%], AC Immune[37.66%], Vaxart [36%] Best Healthcare Stocks Daily:
Vaxxinity [45.95%], Acutus [31.11%], Vicarious Surgical[27.93%], Doximity [18.07%], Orchestra BioMed[12.77%], InflaRx N.V[12.41%], Fortress Biotech[9.66%], Tenaya [9.65%], Sharecare [9.12%], AirSculpt Technologies[7.87%], Autolus [7.86%]