
 Login Sign Up


| |||||
 |  | ||||

| 12Stocks.com Market Intelligence |
Best Healthcare Stocks
 | "Discover best trending healthcare stocks with 12Stocks.com." |
| - Subu Vdaygiri, Founder, 12Stocks.com |
| In a hurry? Healthcare Stocks Lists: Performance Trends Table, Stock Charts
Sort Healthcare stocks: Daily, Weekly, Year-to-Date, Market Cap & Trends. Filter Healthcare stocks list by size:All Healthcare Large Mid-Range Small |
| 12Stocks.com Healthcare Stocks Performances & Trends Daily | |||||||||
|
|  The overall Smart Investing & Trading Score is 55 (0-bearish to 100-bullish) which puts Healthcare sector in short term neutral trend. The Smart Investing & Trading Score from previous trading session is 15 and hence an improvement of trend.
| ||||||||
Here are the Smart Investing & Trading Scores of the most requested Healthcare stocks at 12Stocks.com (click stock name for detailed review):
|


| 12Stocks.com: Investing in Healthcare sector with Stocks | |
|
The following table helps investors and traders sort through current performance and trends (as measured by Smart Investing & Trading Score) of various
stocks in the Healthcare sector. Quick View: Move mouse or cursor over stock symbol (ticker) to view short-term Technical chart and over stock name to view long term chart. Click on  to add stock symbol to your watchlist and to add stock symbol to your watchlist and  to view watchlist. Click on any ticker or stock name for detailed market intelligence report for that stock. to view watchlist. Click on any ticker or stock name for detailed market intelligence report for that stock. |
12Stocks.com Performance of Stocks in Healthcare Sector
| Ticker | Stock Name | Watchlist | Category | Recent Price | Smart Investing & Trading Score | Change % | Weekly Change% |
| LFST | LifeStance Health |   | Medical Care Facilities | 5.57 | 10 | 0.00% | -2.28% |
| VNDA | Vanda | | Biotechnology | 5.11 | 83 | 2.00% | -2.29% |
| MNKD | MannKind | | Biotechnology | 4.67 | 83 | 3.78% | -2.30% |
| MRSN | Mersana | | Biotechnology | 2.33 | 10 | -2.92% | -2.31% |
| GEHC | GE | | Health Information | 78.00 | 0 | -0.73% | -2.32% |
| ESTA | Establishment Labs | | Equipment | 52.23 | 53 | 1.22% | -2.37% |
| BDSX | Biodesix | | Diagnostics & Research | 1.43 | 25 | 5.93% | -2.39% |
| MTEM | Molecular Templates | | Biotechnology | 1.22 | 27 | 0.00% | -2.40% |
| TGTX | TG | | Biotechnology | 16.30 | 35 | -3.49% | -2.45% |
| OSUR | OraSure Technologies | | Instruments | 4.73 | 27 | 0.64% | -2.47% |
| TRVN | Trevena | | Biotechnology | 0.39 | 42 | -2.74% | -2.50% |
| PRFX | PainReform | | Drug Manufacturers Specialty & Generic | 0.71 | 30 | 0.00% | -2.50% |
| UNH | UnitedHealth | | Insurance | 495.37 | 48 | 2.85% | -2.52% |
| STXS | Stereotaxis | | Instruments | 1.93 | 15 | -3.98% | -2.53% |
| BGNE | BeiGene | | Biotechnology | 148.85 | 10 | -3.50% | -2.53% |
| ALKS | Alkermes | | Biotechnology | 23.40 | 27 | 0.82% | -2.58% |
| QTRX | Quanterix | | Biotechnology | 15.97 | 10 | -2.14% | -2.62% |
| ANNX | Annexon | | Biotechnology | 4.83 | 44 | 2.11% | -2.62% |
| VERV | Verve | | Biotechnology | 5.19 | 28 | 0.97% | -2.63% |
| KURA | Kura Oncology | | Biotechnology | 20.61 | 27 | -0.39% | -2.65% |
| VIR | Vir Biotechnology | | Biotechnology | 10.27 | 49 | -1.15% | -2.65% |
| AQB | AquaBounty Technologies | | Biotechnology | 1.80 | 10 | -0.55% | -2.70% |
| IDYA | IDEAYA Biosciences | | Biotechnology | 36.55 | 17 | 2.12% | -2.71% |
| CERS | Cerus | | Biotechnology | 1.79 | 42 | -1.65% | -2.72% |
| NTRA | Natera | | Laboratories | 106.53 | 58 | -3.26% | -2.72% |
| For chart view version of above stock list: Chart View ➞ 0 - 25 , 25 - 50 , 50 - 75 , 75 - 100 , 100 - 125 , 125 - 150 , 150 - 175 , 175 - 200 , 200 - 225 , 225 - 250 , 250 - 275 , 275 - 300 , 300 - 325 , 325 - 350 , 350 - 375 , 375 - 400 , 400 - 425 , 425 - 450 , 450 - 475 , 475 - 500 , 500 - 525 , 525 - 550 , 550 - 575 , 575 - 600 , 600 - 625 , 625 - 650 , 650 - 675 , 675 - 700 , 700 - 725 | ||
 | Click To Change The Sort Order: By Market Cap or Company Size Performance: Year-to-date, Week and Day |  |
|
Get the most comprehensive stock market coverage daily at 12Stocks.com ➞ Best Stocks Today ➞ Best Stocks Weekly ➞ Best Stocks Year-to-Date ➞ Best Stocks Trends ➞  Best Stocks Today 12Stocks.com Best Nasdaq Stocks ➞ Best S&P 500 Stocks ➞ Best Tech Stocks ➞ Best Biotech Stocks ➞ |
| Detailed Overview of Healthcare Stocks |
| Healthcare Technical Overview, Leaders & Laggards, Top Healthcare ETF Funds & Detailed Healthcare Stocks List, Charts, Trends & More |
| Healthcare Sector: Technical Analysis, Trends & YTD Performance | |
| Healthcare sector is composed of stocks
from pharmaceutical, biotech, diagnostics labs, insurance providers
and healthcare services. Healthcare sector, as represented by XLV, an exchange-traded fund [ETF] that holds basket of Healthcare stocks (e.g, Merck, Amgen) is up by 5.37% and is currently underperforming the overall market by -4.42% year-to-date. Below is a quick view of Technical charts and trends: |
|
 XLV Weekly Chart |
|
| Long Term Trend: Not Good | |
| Medium Term Trend: Very Good | |
 XLV Daily Chart |
|
| Short Term Trend: Very Good | |
| Overall Trend Score: 55 | |
| YTD Performance: 5.37% | |
| **Trend Scores & Views Are Only For Educational Purposes And Not For Investing | |
| 12Stocks.com: Top Performing Healthcare Sector Stocks | ||||||||||||||||||||||||||||||||||||||||||||||||
 The top performing Healthcare sector stocks year to date are
Now, more recently, over last week, the top performing Healthcare sector stocks on the move are


|
||||||||||||||||||||||||||||||||||||||||||||||||
| 12Stocks.com: Investing in Healthcare Sector using Exchange Traded Funds | |
|
The following table shows list of key exchange traded funds (ETF) that
help investors track Healthcare Index. For detailed view, check out our ETF Funds section of our website. Quick View: Move mouse or cursor over ETF symbol (ticker) to view short-term Technical chart and over ETF name to view long term chart. Click on ticker or stock name for detailed view. Click on to add stock symbol to your watchlist and to view watchlist. |
12Stocks.com List of ETFs that track Healthcare Index
| Ticker | ETF Name | Watchlist | Recent Price | Smart Investing & Trading Score | Change % | Week % | Year-to-date % |
| XLV | Health Care | | 143.70 | 55 | 1.46 | -0.5 | 5.37% |
| XBI | Biotech | | 89.13 | 35 | 0.19 | 0.34 | -0.18% |
| IBB | Biotechnology | | 133.88 | 50 | 0.40 | -1.32 | -1.45% |
| BBH | Biotech | | 164.59 | 86 | 0.39 | -2.06 | -0.44% |
| VHT | Health Care | | 260.81 | 50 | 0.73 | -1.02 | 4.03% |
| IYH | Healthcare | | 59.88 | 50 | 0.73 | -1.19 | 4.6% |
| IHF | Healthcare Providers | | 52.67 | 63 | 2.48 | 0.38 | 0.3% |
| IHI | Medical Devices | | 55.53 | 25 | 0.33 | -0.96 | 2.89% |
| BIB | Biotechnology | | 55.61 | 60 | 0.53 | -1.87 | -2.52% |
| BIS | Short Biotech | | 17.91 | 48 | -1.49 | 1.13 | -0.89% |
| XHE | Health Care Equipment | | 86.31 | 81 | 0.15 | 0.04 | 2.43% |
| CURE | Healthcare Bull 3X | | 111.99 | 62 | 4.17 | -2.02 | 10.07% |
| LABU | Biotech Bull 3X | | 103.29 | 35 | 0.48 | 0.57 | -15.32% |
| LABD | Biotech Bear 3X | | 8.48 | 56 | -0.35 | -1.05 | -12.49% |
| PSCH | SmallCap Health Care | | 43.19 | 76 | 0.84 | 0.35 | 0.91% |
| XHS | Health Care Services | | 91.65 | 93 | 0.45 | 1.33 | 3.04% |
| PTH | DWA Healthcare Momentum | | 41.70 | 42 | 0.12 | -0.67 | 6.54% |
| BTEC | Principal Healthcare Innovators | | 36.06 | 40 | 2.25 | 0.51 | -0.74% |
| RXL | Health Care | | 98.67 | 57 | 2.60 | -1.4 | 7.95% |
| RXD | Short Health Care | | 10.88 | 33 | -3.80 | 0.24 | -8.76% |
| 12Stocks.com: Charts, Trends, Fundamental Data and Performances of Healthcare Stocks | |
|
We now take in-depth look at all Healthcare stocks including charts, multi-period performances and overall trends (as measured by Smart Investing & Trading Score). One can sort Healthcare stocks (click link to choose) by Daily, Weekly and by Year-to-Date performances. Also, one can sort by size of the company or by market capitalization. |
| Select Your Default Chart Type: | |||||
| |||||
| Click on stock symbol or name for detailed view. Click on to add stock symbol to your watchlist and to view watchlist. Quick View: Move mouse or cursor over "Daily" to quickly view daily Technical stock chart and over "Weekly" to view weekly Technical stock chart. | |||||

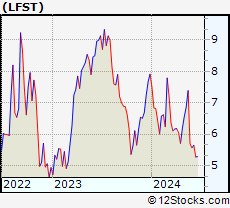 | LFST LifeStance Health Group, Inc. |
| Sector: Health Care | |
| SubSector: Medical Care Facilities | |
| MarketCap: 3460 Millions | |
| Recent Price: 5.57 Smart Investing & Trading Score: 10 | |
| Day Percent Change: 0.00% Day Change: 0.00 | |
| Week Change: -2.28% Year-to-date Change: -29.6% | |
| LFST Links: Profile News Message Board | |
| Charts:- Daily , Weekly | |
| Add LFST to Watchlist: View: Get Complete LFST Trend Analysis ➞ | |
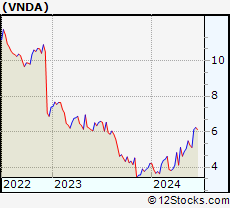 | VNDA Vanda Pharmaceuticals Inc. |
| Sector: Health Care | |
| SubSector: Biotechnology | |
| MarketCap: 464.585 Millions | |
| Recent Price: 5.11 Smart Investing & Trading Score: 83 | |
| Day Percent Change: 2.00% Day Change: 0.10 | |
| Week Change: -2.29% Year-to-date Change: 21.1% | |
| VNDA Links: Profile News Message Board | |
| Charts:- Daily , Weekly | |
| Add VNDA to Watchlist: View: Get Complete VNDA Trend Analysis ➞ | |
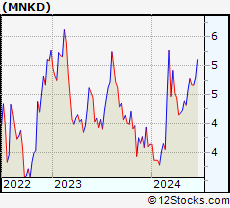 | MNKD MannKind Corporation |
| Sector: Health Care | |
| SubSector: Biotechnology | |
| MarketCap: 250.885 Millions | |
| Recent Price: 4.67 Smart Investing & Trading Score: 83 | |
| Day Percent Change: 3.78% Day Change: 0.17 | |
| Week Change: -2.3% Year-to-date Change: 28.3% | |
| MNKD Links: Profile News Message Board | |
| Charts:- Daily , Weekly | |
| Add MNKD to Watchlist: View: Get Complete MNKD Trend Analysis ➞ | |
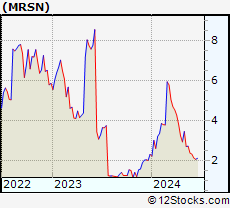 | MRSN Mersana Therapeutics, Inc. |
| Sector: Health Care | |
| SubSector: Biotechnology | |
| MarketCap: 224.385 Millions | |
| Recent Price: 2.33 Smart Investing & Trading Score: 10 | |
| Day Percent Change: -2.92% Day Change: -0.07 | |
| Week Change: -2.31% Year-to-date Change: 0.4% | |
| MRSN Links: Profile News Message Board | |
| Charts:- Daily , Weekly | |
| Add MRSN to Watchlist: View: Get Complete MRSN Trend Analysis ➞ | |
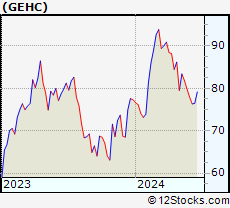 | GEHC GE HealthCare Technologies Inc. |
| Sector: Health Care | |
| SubSector: Health Information Services | |
| MarketCap: 36240 Millions | |
| Recent Price: 78.00 Smart Investing & Trading Score: 0 | |
| Day Percent Change: -0.73% Day Change: -0.57 | |
| Week Change: -2.32% Year-to-date Change: 0.9% | |
| GEHC Links: Profile News Message Board | |
| Charts:- Daily , Weekly | |
| Add GEHC to Watchlist: View: Get Complete GEHC Trend Analysis ➞ | |
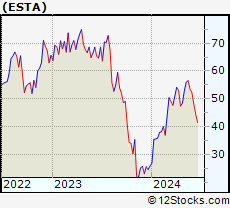 | ESTA Establishment Labs Holdings Inc. |
| Sector: Health Care | |
| SubSector: Medical Appliances & Equipment | |
| MarketCap: 301.78 Millions | |
| Recent Price: 52.23 Smart Investing & Trading Score: 53 | |
| Day Percent Change: 1.22% Day Change: 0.63 | |
| Week Change: -2.37% Year-to-date Change: 101.7% | |
| ESTA Links: Profile News Message Board | |
| Charts:- Daily , Weekly | |
| Add ESTA to Watchlist: View: Get Complete ESTA Trend Analysis ➞ | |
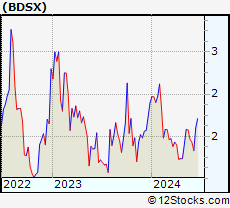 | BDSX Biodesix, Inc. |
| Sector: Health Care | |
| SubSector: Diagnostics & Research | |
| MarketCap: 41487 Millions | |
| Recent Price: 1.43 Smart Investing & Trading Score: 25 | |
| Day Percent Change: 5.93% Day Change: 0.08 | |
| Week Change: -2.39% Year-to-date Change: -24.7% | |
| BDSX Links: Profile News Message Board | |
| Charts:- Daily , Weekly | |
| Add BDSX to Watchlist: View: Get Complete BDSX Trend Analysis ➞ | |
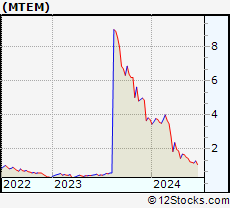 | MTEM Molecular Templates, Inc. |
| Sector: Health Care | |
| SubSector: Biotechnology | |
| MarketCap: 662.785 Millions | |
| Recent Price: 1.22 Smart Investing & Trading Score: 27 | |
| Day Percent Change: 0.00% Day Change: 0.00 | |
| Week Change: -2.4% Year-to-date Change: -67.3% | |
| MTEM Links: Profile News Message Board | |
| Charts:- Daily , Weekly | |
| Add MTEM to Watchlist: View: Get Complete MTEM Trend Analysis ➞ | |
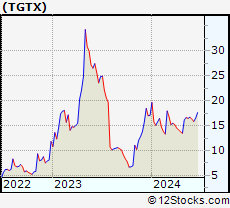 | TGTX TG Therapeutics, Inc. |
| Sector: Health Care | |
| SubSector: Biotechnology | |
| MarketCap: 1022.85 Millions | |
| Recent Price: 16.30 Smart Investing & Trading Score: 35 | |
| Day Percent Change: -3.49% Day Change: -0.59 | |
| Week Change: -2.45% Year-to-date Change: -4.6% | |
| TGTX Links: Profile News Message Board | |
| Charts:- Daily , Weekly | |
| Add TGTX to Watchlist: View: Get Complete TGTX Trend Analysis ➞ | |
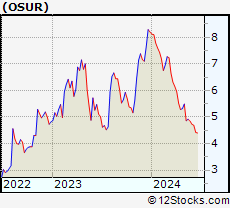 | OSUR OraSure Technologies, Inc. |
| Sector: Health Care | |
| SubSector: Medical Instruments & Supplies | |
| MarketCap: 468.26 Millions | |
| Recent Price: 4.73 Smart Investing & Trading Score: 27 | |
| Day Percent Change: 0.64% Day Change: 0.03 | |
| Week Change: -2.47% Year-to-date Change: -42.3% | |
| OSUR Links: Profile News Message Board | |
| Charts:- Daily , Weekly | |
| Add OSUR to Watchlist: View: Get Complete OSUR Trend Analysis ➞ | |
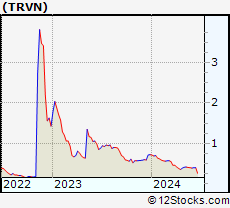 | TRVN Trevena, Inc. |
| Sector: Health Care | |
| SubSector: Biotechnology | |
| MarketCap: 57.7785 Millions | |
| Recent Price: 0.39 Smart Investing & Trading Score: 42 | |
| Day Percent Change: -2.74% Day Change: -0.01 | |
| Week Change: -2.5% Year-to-date Change: -46.0% | |
| TRVN Links: Profile News Message Board | |
| Charts:- Daily , Weekly | |
| Add TRVN to Watchlist: View: Get Complete TRVN Trend Analysis ➞ | |
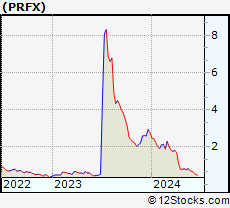 | PRFX PainReform Ltd. |
| Sector: Health Care | |
| SubSector: Drug Manufacturers Specialty & Generic | |
| MarketCap: 41487 Millions | |
| Recent Price: 0.71 Smart Investing & Trading Score: 30 | |
| Day Percent Change: 0.00% Day Change: 0.00 | |
| Week Change: -2.5% Year-to-date Change: -74.3% | |
| PRFX Links: Profile News Message Board | |
| Charts:- Daily , Weekly | |
| Add PRFX to Watchlist: View: Get Complete PRFX Trend Analysis ➞ | |
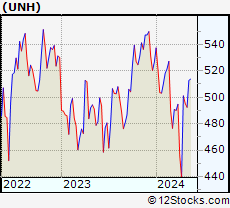 | UNH UnitedHealth Group Incorporated |
| Sector: Health Care | |
| SubSector: Health Care Plans | |
| MarketCap: 217384 Millions | |
| Recent Price: 495.37 Smart Investing & Trading Score: 48 | |
| Day Percent Change: 2.85% Day Change: 13.72 | |
| Week Change: -2.52% Year-to-date Change: -5.9% | |
| UNH Links: Profile News Message Board | |
| Charts:- Daily , Weekly | |
| Add UNH to Watchlist: View: Get Complete UNH Trend Analysis ➞ | |
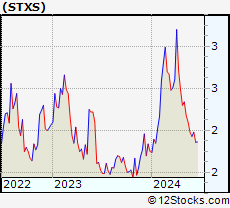 | STXS Stereotaxis, Inc. |
| Sector: Health Care | |
| SubSector: Medical Instruments & Supplies | |
| MarketCap: 232.26 Millions | |
| Recent Price: 1.93 Smart Investing & Trading Score: 15 | |
| Day Percent Change: -3.98% Day Change: -0.08 | |
| Week Change: -2.53% Year-to-date Change: 10.3% | |
| STXS Links: Profile News Message Board | |
| Charts:- Daily , Weekly | |
| Add STXS to Watchlist: View: Get Complete STXS Trend Analysis ➞ | |
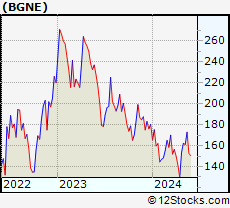 | BGNE BeiGene, Ltd. |
| Sector: Health Care | |
| SubSector: Biotechnology | |
| MarketCap: 10838.5 Millions | |
| Recent Price: 148.85 Smart Investing & Trading Score: 10 | |
| Day Percent Change: -3.50% Day Change: -5.40 | |
| Week Change: -2.53% Year-to-date Change: -17.5% | |
| BGNE Links: Profile News Message Board | |
| Charts:- Daily , Weekly | |
| Add BGNE to Watchlist: View: Get Complete BGNE Trend Analysis ➞ | |
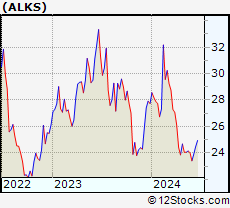 | ALKS Alkermes plc |
| Sector: Health Care | |
| SubSector: Biotechnology | |
| MarketCap: 2311.95 Millions | |
| Recent Price: 23.40 Smart Investing & Trading Score: 27 | |
| Day Percent Change: 0.82% Day Change: 0.19 | |
| Week Change: -2.58% Year-to-date Change: -15.7% | |
| ALKS Links: Profile News Message Board | |
| Charts:- Daily , Weekly | |
| Add ALKS to Watchlist: View: Get Complete ALKS Trend Analysis ➞ | |
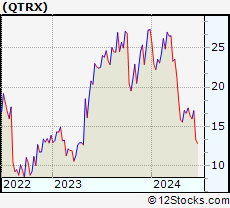 | QTRX Quanterix Corporation |
| Sector: Health Care | |
| SubSector: Biotechnology | |
| MarketCap: 448.685 Millions | |
| Recent Price: 15.97 Smart Investing & Trading Score: 10 | |
| Day Percent Change: -2.14% Day Change: -0.35 | |
| Week Change: -2.62% Year-to-date Change: -41.6% | |
| QTRX Links: Profile News Message Board | |
| Charts:- Daily , Weekly | |
| Add QTRX to Watchlist: View: Get Complete QTRX Trend Analysis ➞ | |
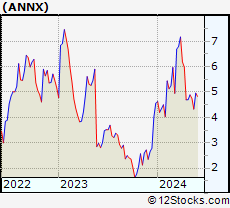 | ANNX Annexon, Inc. |
| Sector: Health Care | |
| SubSector: Biotechnology | |
| MarketCap: 94487 Millions | |
| Recent Price: 4.83 Smart Investing & Trading Score: 44 | |
| Day Percent Change: 2.11% Day Change: 0.10 | |
| Week Change: -2.62% Year-to-date Change: 5.9% | |
| ANNX Links: Profile News Message Board | |
| Charts:- Daily , Weekly | |
| Add ANNX to Watchlist: View: Get Complete ANNX Trend Analysis ➞ | |
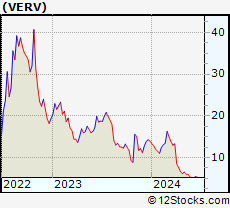 | VERV Verve Therapeutics, Inc. |
| Sector: Health Care | |
| SubSector: Biotechnology | |
| MarketCap: 1200 Millions | |
| Recent Price: 5.19 Smart Investing & Trading Score: 28 | |
| Day Percent Change: 0.97% Day Change: 0.05 | |
| Week Change: -2.63% Year-to-date Change: -62.8% | |
| VERV Links: Profile News Message Board | |
| Charts:- Daily , Weekly | |
| Add VERV to Watchlist: View: Get Complete VERV Trend Analysis ➞ | |
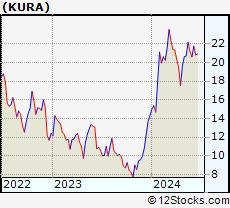 | KURA Kura Oncology, Inc. |
| Sector: Health Care | |
| SubSector: Biotechnology | |
| MarketCap: 401.885 Millions | |
| Recent Price: 20.61 Smart Investing & Trading Score: 27 | |
| Day Percent Change: -0.39% Day Change: -0.08 | |
| Week Change: -2.65% Year-to-date Change: 43.3% | |
| KURA Links: Profile News Message Board | |
| Charts:- Daily , Weekly | |
| Add KURA to Watchlist: View: Get Complete KURA Trend Analysis ➞ | |
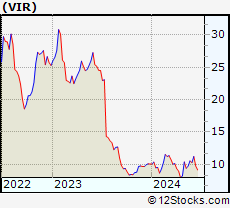 | VIR Vir Biotechnology, Inc. |
| Sector: Health Care | |
| SubSector: Biotechnology | |
| MarketCap: 3916.75 Millions | |
| Recent Price: 10.27 Smart Investing & Trading Score: 49 | |
| Day Percent Change: -1.15% Day Change: -0.12 | |
| Week Change: -2.65% Year-to-date Change: 2.1% | |
| VIR Links: Profile News Message Board | |
| Charts:- Daily , Weekly | |
| Add VIR to Watchlist: View: Get Complete VIR Trend Analysis ➞ | |
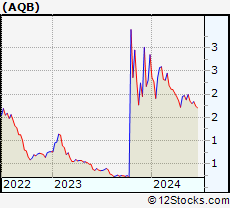 | AQB AquaBounty Technologies, Inc. |
| Sector: Health Care | |
| SubSector: Biotechnology | |
| MarketCap: 55.1785 Millions | |
| Recent Price: 1.80 Smart Investing & Trading Score: 10 | |
| Day Percent Change: -0.55% Day Change: -0.01 | |
| Week Change: -2.7% Year-to-date Change: -36.8% | |
| AQB Links: Profile News Message Board | |
| Charts:- Daily , Weekly | |
| Add AQB to Watchlist: View: Get Complete AQB Trend Analysis ➞ | |
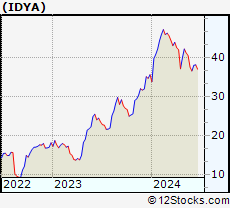 | IDYA IDEAYA Biosciences, Inc. |
| Sector: Health Care | |
| SubSector: Biotechnology | |
| MarketCap: 89.1785 Millions | |
| Recent Price: 36.55 Smart Investing & Trading Score: 17 | |
| Day Percent Change: 2.12% Day Change: 0.76 | |
| Week Change: -2.71% Year-to-date Change: 2.7% | |
| IDYA Links: Profile News Message Board | |
| Charts:- Daily , Weekly | |
| Add IDYA to Watchlist: View: Get Complete IDYA Trend Analysis ➞ | |
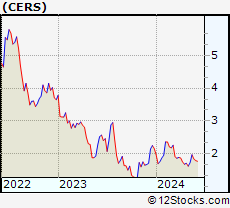 | CERS Cerus Corporation |
| Sector: Health Care | |
| SubSector: Biotechnology | |
| MarketCap: 607.185 Millions | |
| Recent Price: 1.79 Smart Investing & Trading Score: 42 | |
| Day Percent Change: -1.65% Day Change: -0.03 | |
| Week Change: -2.72% Year-to-date Change: -17.1% | |
| CERS Links: Profile News Message Board | |
| Charts:- Daily , Weekly | |
| Add CERS to Watchlist: View: Get Complete CERS Trend Analysis ➞ | |
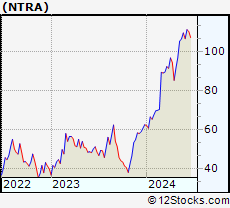 | NTRA Natera, Inc. |
| Sector: Health Care | |
| SubSector: Medical Laboratories & Research | |
| MarketCap: 2152.1 Millions | |
| Recent Price: 106.53 Smart Investing & Trading Score: 58 | |
| Day Percent Change: -3.26% Day Change: -3.59 | |
| Week Change: -2.72% Year-to-date Change: 70.1% | |
| NTRA Links: Profile News Message Board | |
| Charts:- Daily , Weekly | |
| Add NTRA to Watchlist: View: Get Complete NTRA Trend Analysis ➞ | |
| For tabular summary view of above stock list: Summary View ➞ 0 - 25 , 25 - 50 , 50 - 75 , 75 - 100 , 100 - 125 , 125 - 150 , 150 - 175 , 175 - 200 , 200 - 225 , 225 - 250 , 250 - 275 , 275 - 300 , 300 - 325 , 325 - 350 , 350 - 375 , 375 - 400 , 400 - 425 , 425 - 450 , 450 - 475 , 475 - 500 , 500 - 525 , 525 - 550 , 550 - 575 , 575 - 600 , 600 - 625 , 625 - 650 , 650 - 675 , 675 - 700 , 700 - 725 | ||
| Click To Change The Sort Order: By Market Cap or Company Size Performance: Year-to-date, Week and Day | |
| Select Chart Type: | ||
|
Best Stocks Today 12Stocks.com |
© 2024 12Stocks.com Terms & Conditions Privacy Contact Us
All Information Provided Only For Education And Not To Be Used For Investing or Trading. See Terms & Conditions


One More Thing ... Get Best Stocks Delivered Daily!
Never Ever Miss A Move With Our Top Ten Stocks Lists
Find Best Stocks In Any Market - Bull or Bear Market
Take A Peek At Our Top Ten Stocks Lists: Daily, Weekly, Year-to-Date & Top Trends
Find Best Stocks In Any Market - Bull or Bear Market
Take A Peek At Our Top Ten Stocks Lists: Daily, Weekly, Year-to-Date & Top Trends
Healthcare Stocks With Best Up Trends [0-bearish to 100-bullish]: DURECT [100], AC Immune[100], PureTech Health[100], Heron [100], Agenus [100], Calliditas [100], Humana [100], Addus HomeCare[100], Community Health[100], Novartis AG[100], Universal Health[100]
Best Healthcare Stocks Year-to-Date:
Pieris [5277.75%], Precision BioSciences[3434.25%], Avenue [2036.65%], Inovio [1886.27%], Agenus [1795.16%], Assembly Biosciences[1747.34%], Aurora Cannabis[1199.87%], NuCana [1120.42%], Adverum Biotechnologies[952.07%], Burning Rock[641.01%], GeneDx [620.96%] Best Healthcare Stocks This Week:
Summit [156.95%], Insmed [150.23%], Calliditas [82.02%], Ikena Oncology[35.11%], DURECT [32.69%], Orchestra BioMed[32%], AC Immune[31.36%], Bright Green[28.42%], Arcturus [27.58%], Janux [22.4%], Surmodics [22.34%] Best Healthcare Stocks Daily:
DURECT [27.78%], Exicure [26.55%], Bright Green[23.18%], AC Immune[17.13%], Renalytix AI[15.19%], Accuray [12.74%], Emergent Bio[11.98%], Adaptimmune [11.88%], Sol-Gel Technologies[10.96%], Greenwich LifeSciences[10.59%], Taysha Gene[9.58%]