
 Login Sign Up


| |||||
 |  | ||||

| 12Stocks.com Market Intelligence |
Best Healthcare Stocks
 | "Discover best trending healthcare stocks with 12Stocks.com." |
| - Subu Vdaygiri, Founder, 12Stocks.com |
| In a hurry? Healthcare Stocks Lists: Performance Trends Table, Stock Charts
Sort Healthcare stocks: Daily, Weekly, Year-to-Date, Market Cap & Trends. Filter Healthcare stocks list by size:All Healthcare Large Mid-Range Small |
| 12Stocks.com Healthcare Stocks Performances & Trends Daily | |||||||||
|
|  The overall Smart Investing & Trading Score is 55 (0-bearish to 100-bullish) which puts Healthcare sector in short term neutral trend. The Smart Investing & Trading Score from previous trading session is 15 and hence an improvement of trend.
| ||||||||
Here are the Smart Investing & Trading Scores of the most requested Healthcare stocks at 12Stocks.com (click stock name for detailed review):
|


| 12Stocks.com: Investing in Healthcare sector with Stocks | |
|
The following table helps investors and traders sort through current performance and trends (as measured by Smart Investing & Trading Score) of various
stocks in the Healthcare sector. Quick View: Move mouse or cursor over stock symbol (ticker) to view short-term Technical chart and over stock name to view long term chart. Click on  to add stock symbol to your watchlist and to add stock symbol to your watchlist and  to view watchlist. Click on any ticker or stock name for detailed market intelligence report for that stock. to view watchlist. Click on any ticker or stock name for detailed market intelligence report for that stock. |
12Stocks.com Performance of Stocks in Healthcare Sector
| Ticker | Stock Name | Watchlist | Category | Recent Price | Smart Investing & Trading Score | Change % | Weekly Change% |
| NCNA | NuCana |   | Biotechnology | 3.61 | 46 | -3.22% | -1.37% |
| CGEM | Cullinan Oncology | | Biotechnology | 23.50 | 68 | 3.12% | -1.38% |
| AXON | Axovant Sciences | | Biotechnology | 281.67 | 10 | -0.02% | -1.39% |
| MTNB | Matinas BioPharma | | Biotechnology | 0.16 | 25 | 2.12% | -1.39% |
| ALEC | Alector | | Biotechnology | 4.92 | 17 | 0.00% | -1.40% |
| CERE | Cerevel | | Biotechnology | 40.74 | 38 | 0.25% | -1.42% |
| SUPN | Supernus | | Pharmaceutical | 27.12 | 25 | 2.07% | -1.42% |
| ENLV | Enlivex | | Biotechnology | 1.36 | 10 | 0.74% | -1.45% |
| OABI | OmniAb | | Biotechnology | 4.34 | 25 | -3.13% | -1.48% |
| PSNL | Personalis | | Biotechnology | 1.30 | 22 | -0.76% | -1.52% |
| CNTG | Centogene N.V | | Laboratories | 0.37 | 20 | -0.27% | -1.54% |
| LGND | Ligand | | Biotechnology | 85.05 | 68 | 1.30% | -1.56% |
| PODD | Insulet | | Instruments | 177.19 | 93 | 0.70% | -1.60% |
| FBIO | Fortress Biotech | | Biotechnology | 1.84 | 47 | 0.55% | -1.60% |
| CMPS | COMPASS Pathways | | Medical Care Facilities | 7.38 | 10 | -0.54% | -1.60% |
| CVM | CEL-SCI | | Biotechnology | 1.21 | 17 | 0.00% | -1.63% |
| OCUL | Ocular Therapeutix | | Biotechnology | 5.70 | 10 | -1.72% | -1.64% |
| ABT | Abbott | | Equipment | 102.19 | 35 | 0.44% | -1.69% |
| ATHA | Athira Pharma | | Biotechnology | 2.62 | 40 | 3.56% | -1.69% |
| KZR | Kezar Life | | Biotechnology | 0.69 | 28 | 1.40% | -1.71% |
| KRYS | Krystal Biotech | | Biotechnology | 160.05 | 43 | -0.96% | -1.71% |
| HRMY | Harmony Biosciences | | Biotechnology | 29.40 | 38 | 1.84% | -1.77% |
| SHCR | Sharecare | | Health Information | 0.81 | 30 | -3.69% | -1.80% |
| AVTE | Aerovate | | Biotechnology | 17.45 | 32 | -1.19% | -1.86% |
| CTLT | Catalent | | Pharmaceutical | 53.79 | 35 | 0.34% | -1.88% |
| For chart view version of above stock list: Chart View ➞ 0 - 25 , 25 - 50 , 50 - 75 , 75 - 100 , 100 - 125 , 125 - 150 , 150 - 175 , 175 - 200 , 200 - 225 , 225 - 250 , 250 - 275 , 275 - 300 , 300 - 325 , 325 - 350 , 350 - 375 , 375 - 400 , 400 - 425 , 425 - 450 , 450 - 475 , 475 - 500 , 500 - 525 , 525 - 550 , 550 - 575 , 575 - 600 , 600 - 625 , 625 - 650 , 650 - 675 , 675 - 700 , 700 - 725 | ||
 | Click To Change The Sort Order: By Market Cap or Company Size Performance: Year-to-date, Week and Day |  |
|
Get the most comprehensive stock market coverage daily at 12Stocks.com ➞ Best Stocks Today ➞ Best Stocks Weekly ➞ Best Stocks Year-to-Date ➞ Best Stocks Trends ➞  Best Stocks Today 12Stocks.com Best Nasdaq Stocks ➞ Best S&P 500 Stocks ➞ Best Tech Stocks ➞ Best Biotech Stocks ➞ |
| Detailed Overview of Healthcare Stocks |
| Healthcare Technical Overview, Leaders & Laggards, Top Healthcare ETF Funds & Detailed Healthcare Stocks List, Charts, Trends & More |
| Healthcare Sector: Technical Analysis, Trends & YTD Performance | |
| Healthcare sector is composed of stocks
from pharmaceutical, biotech, diagnostics labs, insurance providers
and healthcare services. Healthcare sector, as represented by XLV, an exchange-traded fund [ETF] that holds basket of Healthcare stocks (e.g, Merck, Amgen) is up by 5.37% and is currently underperforming the overall market by -4.42% year-to-date. Below is a quick view of Technical charts and trends: |
|
 XLV Weekly Chart |
|
| Long Term Trend: Not Good | |
| Medium Term Trend: Very Good | |
 XLV Daily Chart |
|
| Short Term Trend: Very Good | |
| Overall Trend Score: 55 | |
| YTD Performance: 5.37% | |
| **Trend Scores & Views Are Only For Educational Purposes And Not For Investing | |
| 12Stocks.com: Top Performing Healthcare Sector Stocks | ||||||||||||||||||||||||||||||||||||||||||||||||
 The top performing Healthcare sector stocks year to date are
Now, more recently, over last week, the top performing Healthcare sector stocks on the move are


|
||||||||||||||||||||||||||||||||||||||||||||||||
| 12Stocks.com: Investing in Healthcare Sector using Exchange Traded Funds | |
|
The following table shows list of key exchange traded funds (ETF) that
help investors track Healthcare Index. For detailed view, check out our ETF Funds section of our website. Quick View: Move mouse or cursor over ETF symbol (ticker) to view short-term Technical chart and over ETF name to view long term chart. Click on ticker or stock name for detailed view. Click on to add stock symbol to your watchlist and to view watchlist. |
12Stocks.com List of ETFs that track Healthcare Index
| Ticker | ETF Name | Watchlist | Recent Price | Smart Investing & Trading Score | Change % | Week % | Year-to-date % |
| XLV | Health Care | | 143.70 | 55 | 1.46 | -0.5 | 5.37% |
| XBI | Biotech | | 89.13 | 35 | 0.19 | 0.34 | -0.18% |
| IBB | Biotechnology | | 133.88 | 50 | 0.40 | -1.32 | -1.45% |
| BBH | Biotech | | 164.59 | 86 | 0.39 | -2.06 | -0.44% |
| VHT | Health Care | | 260.81 | 50 | 0.73 | -1.02 | 4.03% |
| IYH | Healthcare | | 59.88 | 50 | 0.73 | -1.19 | 4.6% |
| IHF | Healthcare Providers | | 52.67 | 63 | 2.48 | 0.38 | 0.3% |
| IHI | Medical Devices | | 55.53 | 25 | 0.33 | -0.96 | 2.89% |
| BIB | Biotechnology | | 55.61 | 60 | 0.53 | -1.87 | -2.52% |
| BIS | Short Biotech | | 17.91 | 48 | -1.49 | 1.13 | -0.89% |
| XHE | Health Care Equipment | | 86.31 | 81 | 0.15 | 0.04 | 2.43% |
| CURE | Healthcare Bull 3X | | 111.99 | 62 | 4.17 | -2.02 | 10.07% |
| LABU | Biotech Bull 3X | | 103.29 | 35 | 0.48 | 0.57 | -15.32% |
| LABD | Biotech Bear 3X | | 8.48 | 56 | -0.35 | -1.05 | -12.49% |
| PSCH | SmallCap Health Care | | 43.19 | 76 | 0.84 | 0.35 | 0.91% |
| XHS | Health Care Services | | 91.65 | 93 | 0.45 | 1.33 | 3.04% |
| PTH | DWA Healthcare Momentum | | 41.70 | 42 | 0.12 | -0.67 | 6.54% |
| BTEC | Principal Healthcare Innovators | | 36.06 | 40 | 2.25 | 0.51 | -0.74% |
| RXL | Health Care | | 98.67 | 57 | 2.60 | -1.4 | 7.95% |
| RXD | Short Health Care | | 10.88 | 33 | -3.80 | 0.24 | -8.76% |
| 12Stocks.com: Charts, Trends, Fundamental Data and Performances of Healthcare Stocks | |
|
We now take in-depth look at all Healthcare stocks including charts, multi-period performances and overall trends (as measured by Smart Investing & Trading Score). One can sort Healthcare stocks (click link to choose) by Daily, Weekly and by Year-to-Date performances. Also, one can sort by size of the company or by market capitalization. |
| Select Your Default Chart Type: | |||||
| |||||
| Click on stock symbol or name for detailed view. Click on to add stock symbol to your watchlist and to view watchlist. Quick View: Move mouse or cursor over "Daily" to quickly view daily Technical stock chart and over "Weekly" to view weekly Technical stock chart. | |||||

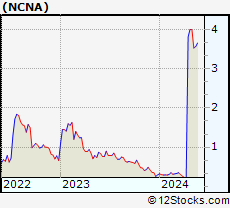 | NCNA NuCana plc |
| Sector: Health Care | |
| SubSector: Biotechnology | |
| MarketCap: 185.785 Millions | |
| Recent Price: 3.61 Smart Investing & Trading Score: 46 | |
| Day Percent Change: -3.22% Day Change: -0.12 | |
| Week Change: -1.37% Year-to-date Change: 1,120.4% | |
| NCNA Links: Profile News Message Board | |
| Charts:- Daily , Weekly | |
| Add NCNA to Watchlist: View: Get Complete NCNA Trend Analysis ➞ | |
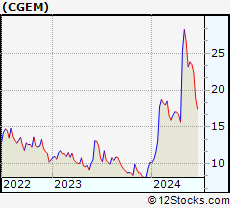 | CGEM Cullinan Oncology, Inc. |
| Sector: Health Care | |
| SubSector: Biotechnology | |
| MarketCap: 433 Millions | |
| Recent Price: 23.50 Smart Investing & Trading Score: 68 | |
| Day Percent Change: 3.12% Day Change: 0.71 | |
| Week Change: -1.38% Year-to-date Change: 130.5% | |
| CGEM Links: Profile News Message Board | |
| Charts:- Daily , Weekly | |
| Add CGEM to Watchlist: View: Get Complete CGEM Trend Analysis ➞ | |
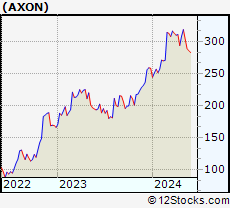 | AXON Axovant Sciences Ltd. |
| Sector: Health Care | |
| SubSector: Biotechnology | |
| MarketCap: 1492.04 Millions | |
| Recent Price: 281.67 Smart Investing & Trading Score: 10 | |
| Day Percent Change: -0.02% Day Change: -0.06 | |
| Week Change: -1.39% Year-to-date Change: 9.0% | |
| AXON Links: Profile News Message Board | |
| Charts:- Daily , Weekly | |
| Add AXON to Watchlist: View: Get Complete AXON Trend Analysis ➞ | |
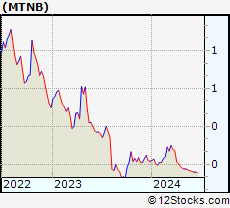 | MTNB Matinas BioPharma Holdings, Inc. |
| Sector: Health Care | |
| SubSector: Biotechnology | |
| MarketCap: 147.085 Millions | |
| Recent Price: 0.16 Smart Investing & Trading Score: 25 | |
| Day Percent Change: 2.12% Day Change: 0.00 | |
| Week Change: -1.39% Year-to-date Change: -24.3% | |
| MTNB Links: Profile News Message Board | |
| Charts:- Daily , Weekly | |
| Add MTNB to Watchlist: View: Get Complete MTNB Trend Analysis ➞ | |
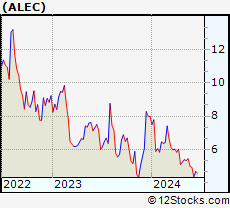 | ALEC Alector, Inc. |
| Sector: Health Care | |
| SubSector: Biotechnology | |
| MarketCap: 2719.35 Millions | |
| Recent Price: 4.92 Smart Investing & Trading Score: 17 | |
| Day Percent Change: 0.00% Day Change: 0.00 | |
| Week Change: -1.4% Year-to-date Change: -38.4% | |
| ALEC Links: Profile News Message Board | |
| Charts:- Daily , Weekly | |
| Add ALEC to Watchlist: View: Get Complete ALEC Trend Analysis ➞ | |
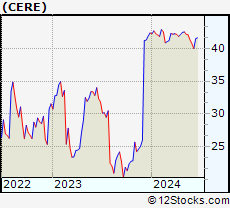 | CERE Cerevel Therapeutics Holdings, Inc. |
| Sector: Health Care | |
| SubSector: Biotechnology | |
| MarketCap: 21587 Millions | |
| Recent Price: 40.74 Smart Investing & Trading Score: 38 | |
| Day Percent Change: 0.25% Day Change: 0.10 | |
| Week Change: -1.42% Year-to-date Change: -3.9% | |
| CERE Links: Profile News Message Board | |
| Charts:- Daily , Weekly | |
| Add CERE to Watchlist: View: Get Complete CERE Trend Analysis ➞ | |
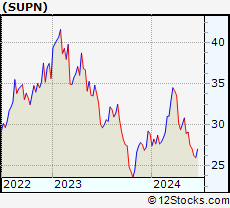 | SUPN Supernus Pharmaceuticals, Inc. |
| Sector: Health Care | |
| SubSector: Drugs - Generic | |
| MarketCap: 833.585 Millions | |
| Recent Price: 27.12 Smart Investing & Trading Score: 25 | |
| Day Percent Change: 2.07% Day Change: 0.55 | |
| Week Change: -1.42% Year-to-date Change: -6.3% | |
| SUPN Links: Profile News Message Board | |
| Charts:- Daily , Weekly | |
| Add SUPN to Watchlist: View: Get Complete SUPN Trend Analysis ➞ | |
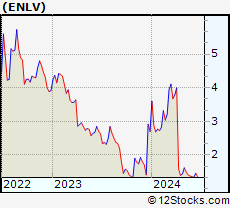 | ENLV Enlivex Therapeutics Ltd. |
| Sector: Health Care | |
| SubSector: Biotechnology | |
| MarketCap: 50.7785 Millions | |
| Recent Price: 1.36 Smart Investing & Trading Score: 10 | |
| Day Percent Change: 0.74% Day Change: 0.01 | |
| Week Change: -1.45% Year-to-date Change: -49.6% | |
| ENLV Links: Profile News Message Board | |
| Charts:- Daily , Weekly | |
| Add ENLV to Watchlist: View: Get Complete ENLV Trend Analysis ➞ | |
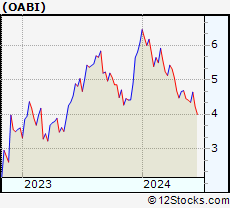 | OABI OmniAb, Inc. |
| Sector: Health Care | |
| SubSector: Biotechnology | |
| MarketCap: 570 Millions | |
| Recent Price: 4.34 Smart Investing & Trading Score: 25 | |
| Day Percent Change: -3.13% Day Change: -0.14 | |
| Week Change: -1.48% Year-to-date Change: -28.4% | |
| OABI Links: Profile News Message Board | |
| Charts:- Daily , Weekly | |
| Add OABI to Watchlist: View: Get Complete OABI Trend Analysis ➞ | |
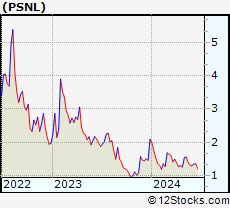 | PSNL Personalis, Inc. |
| Sector: Health Care | |
| SubSector: Biotechnology | |
| MarketCap: 242.385 Millions | |
| Recent Price: 1.30 Smart Investing & Trading Score: 22 | |
| Day Percent Change: -0.76% Day Change: -0.01 | |
| Week Change: -1.52% Year-to-date Change: -38.1% | |
| PSNL Links: Profile News Message Board | |
| Charts:- Daily , Weekly | |
| Add PSNL to Watchlist: View: Get Complete PSNL Trend Analysis ➞ | |
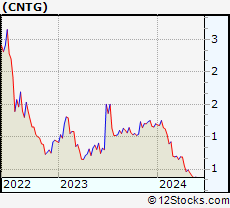 | CNTG Centogene N.V. |
| Sector: Health Care | |
| SubSector: Medical Laboratories & Research | |
| MarketCap: 455.8 Millions | |
| Recent Price: 0.37 Smart Investing & Trading Score: 20 | |
| Day Percent Change: -0.27% Day Change: 0.00 | |
| Week Change: -1.54% Year-to-date Change: -69.1% | |
| CNTG Links: Profile News Message Board | |
| Charts:- Daily , Weekly | |
| Add CNTG to Watchlist: View: Get Complete CNTG Trend Analysis ➞ | |
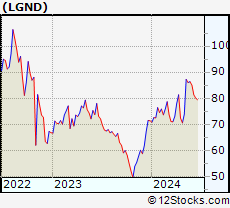 | LGND Ligand Pharmaceuticals Incorporated |
| Sector: Health Care | |
| SubSector: Biotechnology | |
| MarketCap: 1344.45 Millions | |
| Recent Price: 85.05 Smart Investing & Trading Score: 68 | |
| Day Percent Change: 1.30% Day Change: 1.09 | |
| Week Change: -1.56% Year-to-date Change: 19.1% | |
| LGND Links: Profile News Message Board | |
| Charts:- Daily , Weekly | |
| Add LGND to Watchlist: View: Get Complete LGND Trend Analysis ➞ | |
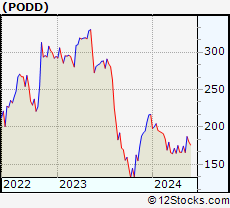 | PODD Insulet Corporation |
| Sector: Health Care | |
| SubSector: Medical Instruments & Supplies | |
| MarketCap: 9313.2 Millions | |
| Recent Price: 177.19 Smart Investing & Trading Score: 93 | |
| Day Percent Change: 0.70% Day Change: 1.24 | |
| Week Change: -1.6% Year-to-date Change: -18.3% | |
| PODD Links: Profile News Message Board | |
| Charts:- Daily , Weekly | |
| Add PODD to Watchlist: View: Get Complete PODD Trend Analysis ➞ | |
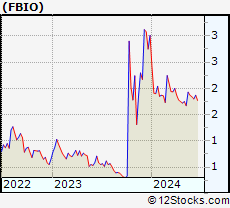 | FBIO Fortress Biotech, Inc. |
| Sector: Health Care | |
| SubSector: Biotechnology | |
| MarketCap: 116.885 Millions | |
| Recent Price: 1.84 Smart Investing & Trading Score: 47 | |
| Day Percent Change: 0.55% Day Change: 0.01 | |
| Week Change: -1.6% Year-to-date Change: -38.9% | |
| FBIO Links: Profile News Message Board | |
| Charts:- Daily , Weekly | |
| Add FBIO to Watchlist: View: Get Complete FBIO Trend Analysis ➞ | |
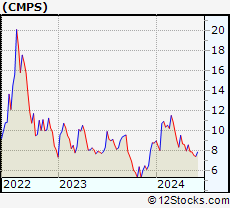 | CMPS COMPASS Pathways plc |
| Sector: Health Care | |
| SubSector: Medical Care Facilities | |
| MarketCap: 19587 Millions | |
| Recent Price: 7.38 Smart Investing & Trading Score: 10 | |
| Day Percent Change: -0.54% Day Change: -0.04 | |
| Week Change: -1.6% Year-to-date Change: -15.6% | |
| CMPS Links: Profile News Message Board | |
| Charts:- Daily , Weekly | |
| Add CMPS to Watchlist: View: Get Complete CMPS Trend Analysis ➞ | |
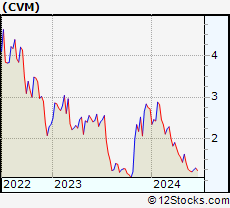 | CVM CEL-SCI Corporation |
| Sector: Health Care | |
| SubSector: Biotechnology | |
| MarketCap: 483.885 Millions | |
| Recent Price: 1.21 Smart Investing & Trading Score: 17 | |
| Day Percent Change: 0.00% Day Change: 0.00 | |
| Week Change: -1.63% Year-to-date Change: -55.5% | |
| CVM Links: Profile News Message Board | |
| Charts:- Daily , Weekly | |
| Add CVM to Watchlist: View: Get Complete CVM Trend Analysis ➞ | |
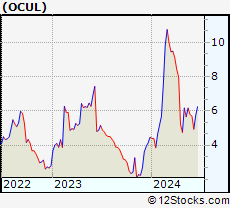 | OCUL Ocular Therapeutix, Inc. |
| Sector: Health Care | |
| SubSector: Biotechnology | |
| MarketCap: 249.985 Millions | |
| Recent Price: 5.70 Smart Investing & Trading Score: 10 | |
| Day Percent Change: -1.72% Day Change: -0.10 | |
| Week Change: -1.64% Year-to-date Change: 27.8% | |
| OCUL Links: Profile News Message Board | |
| Charts:- Daily , Weekly | |
| Add OCUL to Watchlist: View: Get Complete OCUL Trend Analysis ➞ | |
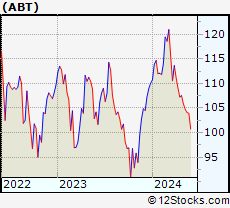 | ABT Abbott Laboratories |
| Sector: Health Care | |
| SubSector: Medical Appliances & Equipment | |
| MarketCap: 125288 Millions | |
| Recent Price: 102.19 Smart Investing & Trading Score: 35 | |
| Day Percent Change: 0.44% Day Change: 0.45 | |
| Week Change: -1.69% Year-to-date Change: -7.2% | |
| ABT Links: Profile News Message Board | |
| Charts:- Daily , Weekly | |
| Add ABT to Watchlist: View: Get Complete ABT Trend Analysis ➞ | |
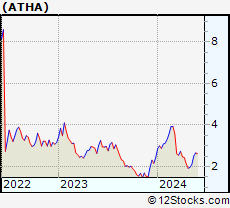 | ATHA Athira Pharma, Inc. |
| Sector: Health Care | |
| SubSector: Biotechnology | |
| MarketCap: 92487 Millions | |
| Recent Price: 2.62 Smart Investing & Trading Score: 40 | |
| Day Percent Change: 3.56% Day Change: 0.09 | |
| Week Change: -1.69% Year-to-date Change: 7.4% | |
| ATHA Links: Profile News Message Board | |
| Charts:- Daily , Weekly | |
| Add ATHA to Watchlist: View: Get Complete ATHA Trend Analysis ➞ | |
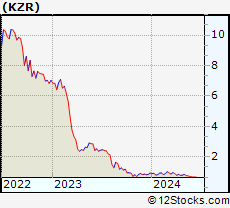 | KZR Kezar Life Sciences, Inc. |
| Sector: Health Care | |
| SubSector: Biotechnology | |
| MarketCap: 174.885 Millions | |
| Recent Price: 0.69 Smart Investing & Trading Score: 28 | |
| Day Percent Change: 1.40% Day Change: 0.01 | |
| Week Change: -1.71% Year-to-date Change: -26.8% | |
| KZR Links: Profile News Message Board | |
| Charts:- Daily , Weekly | |
| Add KZR to Watchlist: View: Get Complete KZR Trend Analysis ➞ | |
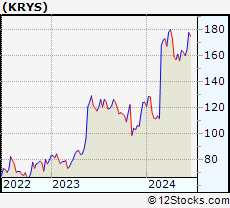 | KRYS Krystal Biotech, Inc. |
| Sector: Health Care | |
| SubSector: Biotechnology | |
| MarketCap: 874.085 Millions | |
| Recent Price: 160.05 Smart Investing & Trading Score: 43 | |
| Day Percent Change: -0.96% Day Change: -1.55 | |
| Week Change: -1.71% Year-to-date Change: 29.0% | |
| KRYS Links: Profile News Message Board | |
| Charts:- Daily , Weekly | |
| Add KRYS to Watchlist: View: Get Complete KRYS Trend Analysis ➞ | |
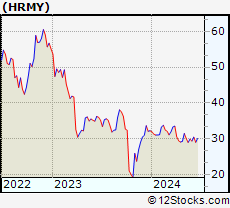 | HRMY Harmony Biosciences Holdings, Inc. |
| Sector: Health Care | |
| SubSector: Biotechnology | |
| MarketCap: 24487 Millions | |
| Recent Price: 29.40 Smart Investing & Trading Score: 38 | |
| Day Percent Change: 1.84% Day Change: 0.53 | |
| Week Change: -1.77% Year-to-date Change: -9.0% | |
| HRMY Links: Profile News Message Board | |
| Charts:- Daily , Weekly | |
| Add HRMY to Watchlist: View: Get Complete HRMY Trend Analysis ➞ | |
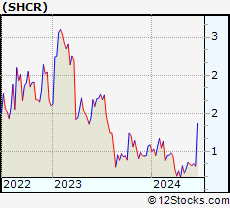 | SHCR Sharecare, Inc. |
| Sector: Health Care | |
| SubSector: Health Information Services | |
| MarketCap: 640 Millions | |
| Recent Price: 0.81 Smart Investing & Trading Score: 30 | |
| Day Percent Change: -3.69% Day Change: -0.03 | |
| Week Change: -1.8% Year-to-date Change: -25.0% | |
| SHCR Links: Profile News Message Board | |
| Charts:- Daily , Weekly | |
| Add SHCR to Watchlist: View: Get Complete SHCR Trend Analysis ➞ | |
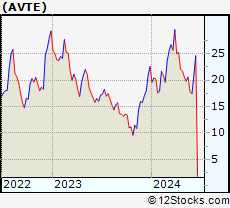 | AVTE Aerovate Therapeutics, Inc. |
| Sector: Health Care | |
| SubSector: Biotechnology | |
| MarketCap: 478 Millions | |
| Recent Price: 17.45 Smart Investing & Trading Score: 32 | |
| Day Percent Change: -1.19% Day Change: -0.21 | |
| Week Change: -1.86% Year-to-date Change: -22.7% | |
| AVTE Links: Profile News Message Board | |
| Charts:- Daily , Weekly | |
| Add AVTE to Watchlist: View: Get Complete AVTE Trend Analysis ➞ | |
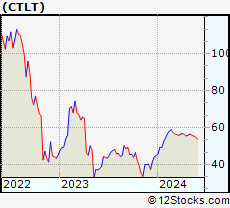 | CTLT Catalent, Inc. |
| Sector: Health Care | |
| SubSector: Drugs - Generic | |
| MarketCap: 6351.95 Millions | |
| Recent Price: 53.79 Smart Investing & Trading Score: 35 | |
| Day Percent Change: 0.34% Day Change: 0.18 | |
| Week Change: -1.88% Year-to-date Change: 19.7% | |
| CTLT Links: Profile News Message Board | |
| Charts:- Daily , Weekly | |
| Add CTLT to Watchlist: View: Get Complete CTLT Trend Analysis ➞ | |
| For tabular summary view of above stock list: Summary View ➞ 0 - 25 , 25 - 50 , 50 - 75 , 75 - 100 , 100 - 125 , 125 - 150 , 150 - 175 , 175 - 200 , 200 - 225 , 225 - 250 , 250 - 275 , 275 - 300 , 300 - 325 , 325 - 350 , 350 - 375 , 375 - 400 , 400 - 425 , 425 - 450 , 450 - 475 , 475 - 500 , 500 - 525 , 525 - 550 , 550 - 575 , 575 - 600 , 600 - 625 , 625 - 650 , 650 - 675 , 675 - 700 , 700 - 725 | ||
| Click To Change The Sort Order: By Market Cap or Company Size Performance: Year-to-date, Week and Day | |
| Select Chart Type: | ||
|
Best Stocks Today 12Stocks.com |
© 2024 12Stocks.com Terms & Conditions Privacy Contact Us
All Information Provided Only For Education And Not To Be Used For Investing or Trading. See Terms & Conditions


One More Thing ... Get Best Stocks Delivered Daily!
Never Ever Miss A Move With Our Top Ten Stocks Lists
Find Best Stocks In Any Market - Bull or Bear Market
Take A Peek At Our Top Ten Stocks Lists: Daily, Weekly, Year-to-Date & Top Trends
Find Best Stocks In Any Market - Bull or Bear Market
Take A Peek At Our Top Ten Stocks Lists: Daily, Weekly, Year-to-Date & Top Trends
Healthcare Stocks With Best Up Trends [0-bearish to 100-bullish]: DURECT [100], AC Immune[100], PureTech Health[100], Heron [100], Agenus [100], Calliditas [100], Humana [100], Addus HomeCare[100], Community Health[100], Novartis AG[100], Universal Health[100]
Best Healthcare Stocks Year-to-Date:
Pieris [5277.75%], Precision BioSciences[3434.25%], Avenue [2036.65%], Inovio [1886.27%], Agenus [1795.16%], Assembly Biosciences[1747.34%], Aurora Cannabis[1199.87%], NuCana [1120.42%], Adverum Biotechnologies[952.07%], Burning Rock[641.01%], GeneDx [620.96%] Best Healthcare Stocks This Week:
Summit [156.95%], Insmed [150.23%], Calliditas [82.02%], Ikena Oncology[35.11%], DURECT [32.69%], Orchestra BioMed[32%], AC Immune[31.36%], Bright Green[28.42%], Arcturus [27.58%], Janux [22.4%], Surmodics [22.34%] Best Healthcare Stocks Daily:
DURECT [27.78%], Exicure [26.55%], Bright Green[23.18%], AC Immune[17.13%], Renalytix AI[15.19%], Accuray [12.74%], Emergent Bio[11.98%], Adaptimmune [11.88%], Sol-Gel Technologies[10.96%], Greenwich LifeSciences[10.59%], Taysha Gene[9.58%]