
 Login Sign Up


| |||||
 |  | ||||

| 12Stocks.com Market Intelligence |
Best Asia Stocks
|
|
| Quick Read: Top Asia Stocks By Performances & Trends: Daily, Weekly, Year-to-Date, Market Cap (Size) & Technical Trends | |||
| Best Asia Views: Quick Browse View, Summary & Slide Show | |||
| 12Stocks.com Asia Stocks Performances & Trends Daily | |||||||||
|
|  The overall market intelligence score is 63 (0-bearish to 100-bullish) which puts Asia index in short term neutral to bullish trend. The market intelligence score from previous trading session is 83 and hence a deterioration of trend.
| ||||||||
Here are the market intelligence trend scores of the most requested Asia stocks at 12Stocks.com (click stock name for detailed review):
|


| Consider signing up for our daily 12Stocks.com "Best Stocks Newsletter". You will never ever miss a big stock move again! |
| 12Stocks.com: Top Performing Asia Index Stocks | ||||||||||||||||||||||||||||||||||||||||||||||||
 The top performing Asia Index stocks year to date are
Now, more recently, over last week, the top performing Asia Index stocks on the move are


|
||||||||||||||||||||||||||||||||||||||||||||||||
| 12Stocks.com: Investing in Asia Index with Stocks | |
|
The following table helps investors and traders sort through current performance and trends (as measured by market intelligence score) of various
stocks in the Asia Index. Quick View: Move mouse or cursor over stock symbol (ticker) to view short-term technical chart and over stock name to view long term chart. Click on  to add stock symbol to your watchlist and to add stock symbol to your watchlist and  to view watchlist. Click on any ticker or stock name for detailed market intelligence report for that stock. to view watchlist. Click on any ticker or stock name for detailed market intelligence report for that stock. |
12Stocks.com Performance of Stocks in Asia Index
| Ticker | Stock Name | Watchlist | Category | Recent Price | Market Intelligence Score | Change % | YTD Change% |
| UCAR | U Power |   | Services & Goods | 5.42 | 43 | 0.00% | NA |
| DTSS | Datasea | | Industrials | 6.58 | 10 | -2.52% | NA |
| CJJD | China Jo-Jo | | Services & Goods | 2.97 | 95 | 0.00% | NA |
| AMBO | Ambow Education | | Services & Goods | 1.50 | 44 | -0.92% | NA |
| DOYU | DouYu | | Technology | 10.05 | 61 | -5.19% | NA |
| BNR | Burning Rock | | Health Care | 7.63 | 68 | -1.93% | 690.76% |
| RCON | Recon | | Energy | 1.67 | 41 | 0.60% | 615.20% |
| CLEU | China Liberal | | Consumer Staples | 1.16 | 47 | 0.00% | 548.77% |
| YSG | Yatsen Holding | | Services & Goods | 4.55 | 83 | 2.02% | 521.92% |
| HOLO | MicroCloud Hologram | | Technology | 1.81 | 24 | -5.22% | 422.30% |
| RETO | ReTo Eco- | | Industrials | 1.62 | 95 | -11.23% | 341.54% |
| UXIN | Uxin | | Technology | 3.06 | 61 | 0.99% | 336.52% |
| ZH | Zhihu | | Services & Goods | 3.92 | 76 | -3.21% | 314.55% |
| ZCMD | Zhongchao | | Health Care | 1.51 | 32 | 0.00% | 313.59% |
| SEED | Origin Agritech | | Consumer Staples | 6.01 | 83 | -0.66% | 167.11% |
| CMCM | Cheetah Mobile | | Technology | 6.09 | 100 | 9.73% | 167.11% |
| CPHI | China Pharma | | Health Care | 0.31 | 43 | -12.49% | 158.18% |
| DOGZ | Dogness () | | Consumer Staples | 11.56 | 100 | 40.63% | 122.74% |
| EM | Smart Share | | Services & Goods | 1.09 | 68 | 0.00% | 111.65% |
| AIHS | Senmiao | | Financials | 0.84 | 42 | -5.92% | 104.88% |
| DUO | Fangdd Network | | Financials | 1.22 | 81 | 4.74% | 80.53% |
| MMYT | MakeMyTrip | | Services & Goods | 81.81 | 68 | -8.81% | 74.14% |
| GCT | GigaCloud | | Technology | 31.47 | 5 | -3.61% | 71.87% |
| TOUR | Tuniu | | Consumer Staples | 1.14 | 100 | 7.55% | 69.90% |
| TME | Tencent Music | | Technology | 14.99 | 61 | -1.83% | 66.37% |
| To view more stocks, click on Next / Previous arrows or select different range: 0 - 25 , 25 - 50 , 50 - 75 , 75 - 100 , 100 - 125 , 125 - 150 , 150 - 175 , 175 - 200 , 200 - 225 | ||
 | Click To Change The Sort Order: By Market Cap or Company Size Performance: Year-to-date, Week and Day |  |
|
Get the most comprehensive stock market coverage daily at 12Stocks.com ➞ Best Stocks Today ➞ Best Stocks Weekly ➞ Best Stocks Year-to-Date ➞ Best Stocks Trends ➞  Best Stocks Today 12Stocks.com Best Nasdaq Stocks ➞ Best S&P 500 Stocks ➞ Best Tech Stocks ➞ Best Biotech Stocks ➞ |
| Detailed Overview of Asia Stocks |
| Asia Technical Overview, Leaders & Laggards, Top Asia ETF Funds & Detailed Asia Stocks List, Charts, Trends & More |
| Asia: Technical Analysis, Trends & YTD Performance | |
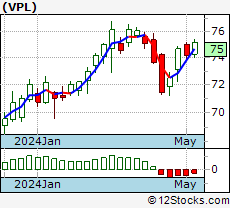 VPL Weekly Chart |
|
| Long Term Trend: Very Good | |
| Medium Term Trend: Very Good | |
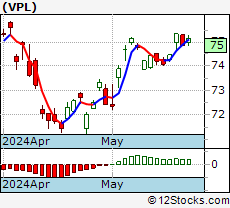 VPL Daily Chart |
|
| Short Term Trend: Good | |
| Overall Trend Score: 63 | |
| YTD Performance: 4.11% | |
| **Trend Scores & Views Are Only For Educational Purposes And Not For Investing | |
| 12Stocks.com: Investing in Asia Index using Exchange Traded Funds | |
|
The following table shows list of key exchange traded funds (ETF) that
help investors play Asia stock market. For detailed view, check out our ETF Funds section of our website. Quick View: Move mouse or cursor over ETF symbol (ticker) to view short-term technical chart and over ETF name to view long term chart. Click on ticker or stock name for detailed view. Click on to add stock symbol to your watchlist and to view watchlist. |
12Stocks.com List of ETFs that track Asia Index
| Ticker | ETF Name | Watchlist | Recent Price | Market Intelligence Score | Change % | Week % | Year-to-date % |
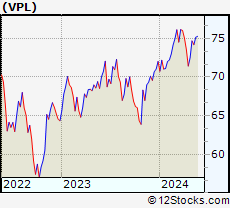
| VPL | Pacific | | 74.99 | 63 | -0.40 | -0.21 | 4.11% |
| EEMA | Emerging Markets Asia | | 72.43 | 66 | -1.07 | -1.38 | 9.56% |
| AIA | Asia 50 | | 67.77 | 61 | 0.00 | -0.7 | 16.91% |
| AAXJ | All Country Asia | | 72.52 | 56 | -0.81 | -1.27 | 8.94% |
| GMF | Emerging Asia Pacific | | 111.61 | 66 | -0.48 | -0.91 | 10.43% |
| EPP | Pacific ex Japan | | 44.88 | 69 | -0.24 | -0.84 | 3.39% |
| ASEA | Southeast Asia | | 15.00 | 59 | -0.86 | -2.22 | -0.54% |
| DVYA | Asia/Pacific Dividend | | 38.56 | 73 | -0.21 | -0.18 | 7.84% |
| IPAC | Core Pacific | | 62.65 | 68 | -0.36 | -0.15 | 5.27% |
| FXI | China Large-Cap | | 28.56 | 63 | -1.55 | -2.63 | 18.85% |
| EWY | South Korea | | 64.85 | 39 | -0.60 | -0.93 | -1.04% |
| EWT | Taiwan | | 50.52 | 68 | -0.61 | -0.9 | 9.75% |
| EWJ | Japan | | 68.82 | 45 | -0.58 | 0.13 | 7.3% |
| EWH | Hong Kong | | 17.65 | 68 | -1.89 | -2.27 | 1.61% |
| EWS | Singapore | | 19.65 | 78 | 0.20 | -0.71 | 5.08% |
| EWM | Malaysia | | 23.29 | 76 | -0.56 | 0.04 | 9.6% |
| EPHE | Philippines | | 25.73 | 17 | -0.89 | -0.73 | -1% |
| EIDO | Indonesia | | 20.58 | 10 | -1.53 | -3.38 | -7.8% |
| THD | Thailand | | 59.28 | 41 | -1.61 | -2.07 | -7.17% |
| VNM | Vietnam | | 12.90 | 37 | -0.54 | -0.39 | -0.15% |
| 12Stocks.com: Charts, Trends, Fundamental Data and Performances of Asia Stocks | |
|
We now take in-depth look at all Asia stocks including charts, multi-period performances and overall trends (as measured by market intelligence score). One can sort Asia stocks (click link to choose) by Daily, Weekly and by Year-to-Date performances. Also, one can sort by size of the company or by market capitalization. |
| Select Your Default Chart Type: | |||||
| |||||
| Click on stock symbol or name for detailed view. Click on to add stock symbol to your watchlist and to view watchlist. Quick View: Move mouse or cursor over "Daily" to quickly view daily technical stock chart and over "Weekly" to view weekly technical stock chart. | |||||
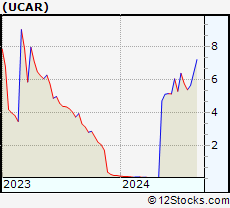 | UCAR U Power Limited |
| Sector: Services & Goods | |
| SubSector: Auto & Truck Dealerships | |
| MarketCap: 372 Millions | |
| Recent Price: 5.42 Market Intelligence Score: 43 | |
| Day Percent Change: 0.00% Day Change: 0.00 | |
| Week Change: -14.91% Year-to-date Change: 2,924.6% | |
| UCAR Links: Profile News Message Board | |
| Charts:- Daily , Weekly | |
| Add UCAR to Watchlist: View: Get Complete UCAR Trend Analysis ➞ | |
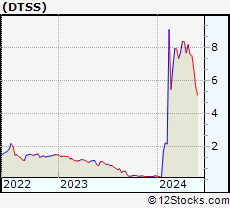 | DTSS Datasea Inc. |
| Sector: Industrials | |
| SubSector: Conglomerates | |
| MarketCap: 36.8848 Millions | |
| Recent Price: 6.58 Market Intelligence Score: 10 | |
| Day Percent Change: -2.52% Day Change: -0.17 | |
| Week Change: -1.72% Year-to-date Change: 2,736.2% | |
| DTSS Links: Profile News Message Board | |
| Charts:- Daily , Weekly | |
| Add DTSS to Watchlist: View: Get Complete DTSS Trend Analysis ➞ | |
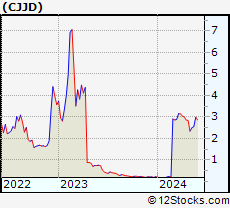 | CJJD China Jo-Jo Drugstores, Inc. |
| Sector: Services & Goods | |
| SubSector: Drug Stores | |
| MarketCap: 57.8351 Millions | |
| Recent Price: 2.97 Market Intelligence Score: 95 | |
| Day Percent Change: 0.00% Day Change: 0.00 | |
| Week Change: 16.63% Year-to-date Change: 1,239.7% | |
| CJJD Links: Profile News Message Board | |
| Charts:- Daily , Weekly | |
| Add CJJD to Watchlist: View: Get Complete CJJD Trend Analysis ➞ | |
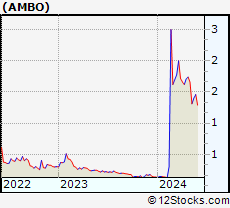 | AMBO Ambow Education Holding Ltd. |
| Sector: Services & Goods | |
| SubSector: Education & Training Services | |
| MarketCap: 44.8006 Millions | |
| Recent Price: 1.50 Market Intelligence Score: 44 | |
| Day Percent Change: -0.92% Day Change: -0.01 | |
| Week Change: 7.14% Year-to-date Change: 990.9% | |
| AMBO Links: Profile News Message Board | |
| Charts:- Daily , Weekly | |
| Add AMBO to Watchlist: View: Get Complete AMBO Trend Analysis ➞ | |
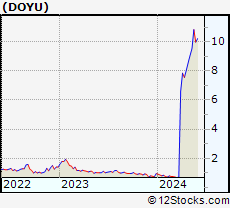 | DOYU DouYu International Holdings Limited |
| Sector: Technology | |
| SubSector: Internet Information Providers | |
| MarketCap: 2483 Millions | |
| Recent Price: 10.05 Market Intelligence Score: 61 | |
| Day Percent Change: -5.19% Day Change: -0.55 | |
| Week Change: -7.2% Year-to-date Change: 957.9% | |
| DOYU Links: Profile News Message Board | |
| Charts:- Daily , Weekly | |
| Add DOYU to Watchlist: View: Get Complete DOYU Trend Analysis ➞ | |
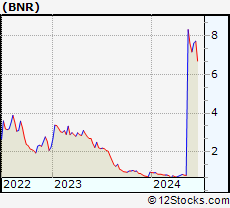 | BNR Burning Rock Biotech Limited |
| Sector: Health Care | |
| SubSector: Diagnostics & Research | |
| MarketCap: 27887 Millions | |
| Recent Price: 7.63 Market Intelligence Score: 68 | |
| Day Percent Change: -1.93% Day Change: -0.15 | |
| Week Change: -8.07% Year-to-date Change: 690.8% | |
| BNR Links: Profile News Message Board | |
| Charts:- Daily , Weekly | |
| Add BNR to Watchlist: View: Get Complete BNR Trend Analysis ➞ | |
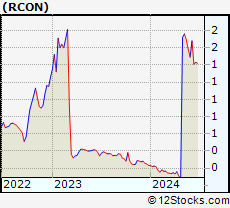 | RCON Recon Technology, Ltd. |
| Sector: Energy | |
| SubSector: Oil & Gas Equipment & Services | |
| MarketCap: 6.85461 Millions | |
| Recent Price: 1.67 Market Intelligence Score: 41 | |
| Day Percent Change: 0.60% Day Change: 0.01 | |
| Week Change: -1.18% Year-to-date Change: 615.2% | |
| RCON Links: Profile News Message Board | |
| Charts:- Daily , Weekly | |
| Add RCON to Watchlist: View: Get Complete RCON Trend Analysis ➞ | |
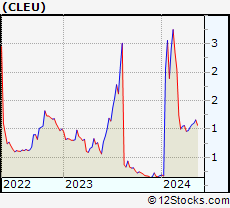 | CLEU China Liberal Education Holdings Limited |
| Sector: Consumer Staples | |
| SubSector: Education & Training Services | |
| MarketCap: 32347 Millions | |
| Recent Price: 1.16 Market Intelligence Score: 47 | |
| Day Percent Change: 0.00% Day Change: 0.00 | |
| Week Change: -4.13% Year-to-date Change: 548.8% | |
| CLEU Links: Profile News Message Board | |
| Charts:- Daily , Weekly | |
| Add CLEU to Watchlist: View: Get Complete CLEU Trend Analysis ➞ | |
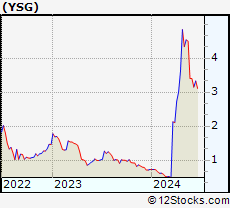 | YSG Yatsen Holding Limited |
| Sector: Services & Goods | |
| SubSector: Specialty Retail | |
| MarketCap: 11827 Millions | |
| Recent Price: 4.55 Market Intelligence Score: 83 | |
| Day Percent Change: 2.02% Day Change: 0.09 | |
| Week Change: 1.11% Year-to-date Change: 521.9% | |
| YSG Links: Profile News Message Board | |
| Charts:- Daily , Weekly | |
| Add YSG to Watchlist: View: Get Complete YSG Trend Analysis ➞ | |
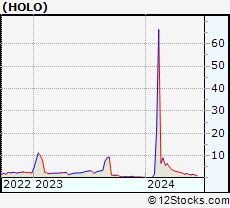 | HOLO MicroCloud Hologram Inc. |
| Sector: Technology | |
| SubSector: Electronic Components | |
| MarketCap: 159 Millions | |
| Recent Price: 1.81 Market Intelligence Score: 24 | |
| Day Percent Change: -5.22% Day Change: -0.10 | |
| Week Change: -12.32% Year-to-date Change: 422.3% | |
| HOLO Links: Profile News Message Board | |
| Charts:- Daily , Weekly | |
| Add HOLO to Watchlist: View: Get Complete HOLO Trend Analysis ➞ | |
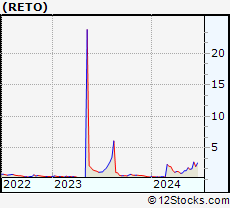 | RETO ReTo Eco-Solutions, Inc. |
| Sector: Industrials | |
| SubSector: General Building Materials | |
| MarketCap: 13.1953 Millions | |
| Recent Price: 1.62 Market Intelligence Score: 95 | |
| Day Percent Change: -11.23% Day Change: -0.20 | |
| Week Change: -11.48% Year-to-date Change: 341.5% | |
| RETO Links: Profile News Message Board | |
| Charts:- Daily , Weekly | |
| Add RETO to Watchlist: View: Get Complete RETO Trend Analysis ➞ | |
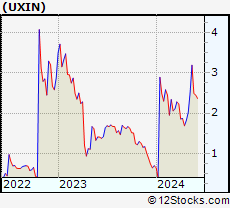 | UXIN Uxin Limited |
| Sector: Technology | |
| SubSector: Internet Information Providers | |
| MarketCap: 414.58 Millions | |
| Recent Price: 3.06 Market Intelligence Score: 61 | |
| Day Percent Change: 0.99% Day Change: 0.03 | |
| Week Change: -4.08% Year-to-date Change: 336.5% | |
| UXIN Links: Profile News Message Board | |
| Charts:- Daily , Weekly | |
| Add UXIN to Watchlist: View: Get Complete UXIN Trend Analysis ➞ | |
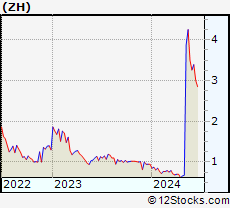 | ZH Zhihu Inc. |
| Sector: Services & Goods | |
| SubSector: Internet Content & Information | |
| MarketCap: 741 Millions | |
| Recent Price: 3.92 Market Intelligence Score: 76 | |
| Day Percent Change: -3.21% Day Change: -0.13 | |
| Week Change: -7.76% Year-to-date Change: 314.6% | |
| ZH Links: Profile News Message Board | |
| Charts:- Daily , Weekly | |
| Add ZH to Watchlist: View: Get Complete ZH Trend Analysis ➞ | |
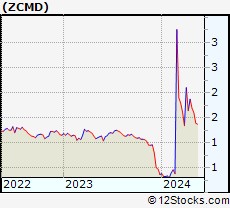 | ZCMD Zhongchao Inc. |
| Sector: Health Care | |
| SubSector: Health Information Services | |
| MarketCap: 41487 Millions | |
| Recent Price: 1.51 Market Intelligence Score: 32 | |
| Day Percent Change: 0.00% Day Change: 0.00 | |
| Week Change: 0% Year-to-date Change: 313.6% | |
| ZCMD Links: Profile News Message Board | |
| Charts:- Daily , Weekly | |
| Add ZCMD to Watchlist: View: Get Complete ZCMD Trend Analysis ➞ | |
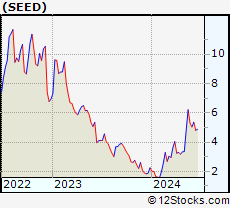 | SEED Origin Agritech Limited |
| Sector: Consumer Staples | |
| SubSector: Farm Products | |
| MarketCap: 21.6087 Millions | |
| Recent Price: 6.01 Market Intelligence Score: 83 | |
| Day Percent Change: -0.66% Day Change: -0.04 | |
| Week Change: -3.22% Year-to-date Change: 167.1% | |
| SEED Links: Profile News Message Board | |
| Charts:- Daily , Weekly | |
| Add SEED to Watchlist: View: Get Complete SEED Trend Analysis ➞ | |
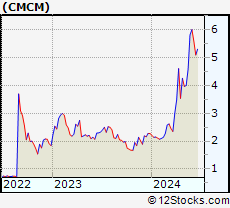 | CMCM Cheetah Mobile Inc. |
| Sector: Technology | |
| SubSector: Application Software | |
| MarketCap: 343.362 Millions | |
| Recent Price: 6.09 Market Intelligence Score: 100 | |
| Day Percent Change: 9.73% Day Change: 0.54 | |
| Week Change: 32.68% Year-to-date Change: 167.1% | |
| CMCM Links: Profile News Message Board | |
| Charts:- Daily , Weekly | |
| Add CMCM to Watchlist: View: Get Complete CMCM Trend Analysis ➞ | |
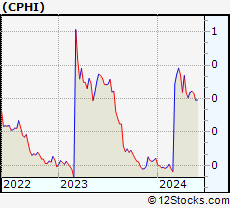 | CPHI China Pharma Holdings, Inc. |
| Sector: Health Care | |
| SubSector: Drug Manufacturers - Major | |
| MarketCap: 29.4543 Millions | |
| Recent Price: 0.31 Market Intelligence Score: 43 | |
| Day Percent Change: -12.49% Day Change: -0.04 | |
| Week Change: -1.14% Year-to-date Change: 158.2% | |
| CPHI Links: Profile News Message Board | |
| Charts:- Daily , Weekly | |
| Add CPHI to Watchlist: View: Get Complete CPHI Trend Analysis ➞ | |
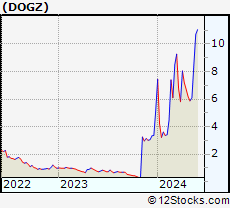 | DOGZ Dogness (International) Corporation |
| Sector: Consumer Staples | |
| SubSector: Personal Products | |
| MarketCap: 36.4985 Millions | |
| Recent Price: 11.56 Market Intelligence Score: 100 | |
| Day Percent Change: 40.63% Day Change: 3.34 | |
| Week Change: 37.29% Year-to-date Change: 122.7% | |
| DOGZ Links: Profile News Message Board | |
| Charts:- Daily , Weekly | |
| Add DOGZ to Watchlist: View: Get Complete DOGZ Trend Analysis ➞ | |
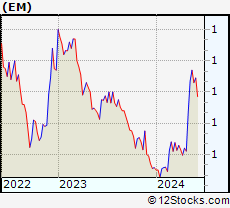 | EM Smart Share Global Limited |
| Sector: Services & Goods | |
| SubSector: Personal Services | |
| MarketCap: 238 Millions | |
| Recent Price: 1.09 Market Intelligence Score: 68 | |
| Day Percent Change: 0.00% Day Change: 0.00 | |
| Week Change: -4.39% Year-to-date Change: 111.7% | |
| EM Links: Profile News Message Board | |
| Charts:- Daily , Weekly | |
| Add EM to Watchlist: View: Get Complete EM Trend Analysis ➞ | |
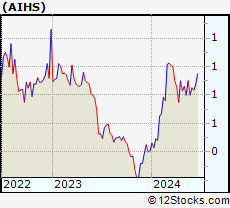 | AIHS Senmiao Technology Limited |
| Sector: Financials | |
| SubSector: Credit Services | |
| MarketCap: 11.8208 Millions | |
| Recent Price: 0.84 Market Intelligence Score: 42 | |
| Day Percent Change: -5.92% Day Change: -0.05 | |
| Week Change: -6.67% Year-to-date Change: 104.9% | |
| AIHS Links: Profile News Message Board | |
| Charts:- Daily , Weekly | |
| Add AIHS to Watchlist: View: Get Complete AIHS Trend Analysis ➞ | |
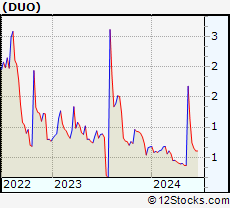 | DUO Fangdd Network Group Ltd. |
| Sector: Financials | |
| SubSector: Property Management | |
| MarketCap: 783.142 Millions | |
| Recent Price: 1.22 Market Intelligence Score: 81 | |
| Day Percent Change: 4.74% Day Change: 0.06 | |
| Week Change: -27.68% Year-to-date Change: 80.5% | |
| DUO Links: Profile News Message Board | |
| Charts:- Daily , Weekly | |
| Add DUO to Watchlist: View: Get Complete DUO Trend Analysis ➞ | |
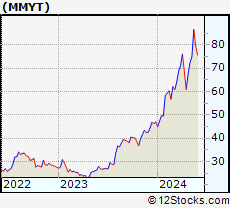 | MMYT MakeMyTrip Limited |
| Sector: Services & Goods | |
| SubSector: General Entertainment | |
| MarketCap: 1429.59 Millions | |
| Recent Price: 81.81 Market Intelligence Score: 68 | |
| Day Percent Change: -8.81% Day Change: -7.90 | |
| Week Change: -5.42% Year-to-date Change: 74.1% | |
| MMYT Links: Profile News Message Board | |
| Charts:- Daily , Weekly | |
| Add MMYT to Watchlist: View: Get Complete MMYT Trend Analysis ➞ | |
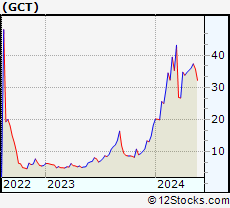 | GCT GigaCloud Technology Inc. |
| Sector: Technology | |
| SubSector: Software - Infrastructure | |
| MarketCap: 240 Millions | |
| Recent Price: 31.47 Market Intelligence Score: 5 | |
| Day Percent Change: -3.61% Day Change: -1.18 | |
| Week Change: -12% Year-to-date Change: 71.9% | |
| GCT Links: Profile News Message Board | |
| Charts:- Daily , Weekly | |
| Add GCT to Watchlist: View: Get Complete GCT Trend Analysis ➞ | |
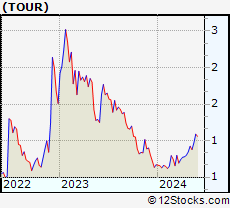 | TOUR Tuniu Corporation |
| Sector: Consumer Staples | |
| SubSector: Recreational Goods, Other | |
| MarketCap: 124.459 Millions | |
| Recent Price: 1.14 Market Intelligence Score: 100 | |
| Day Percent Change: 7.55% Day Change: 0.08 | |
| Week Change: 17.53% Year-to-date Change: 69.9% | |
| TOUR Links: Profile News Message Board | |
| Charts:- Daily , Weekly | |
| Add TOUR to Watchlist: View: Get Complete TOUR Trend Analysis ➞ | |
 | TME Tencent Music Entertainment Group |
| Sector: Technology | |
| SubSector: Internet Information Providers | |
| MarketCap: 16195 Millions | |
| Recent Price: 14.99 Market Intelligence Score: 61 | |
| Day Percent Change: -1.83% Day Change: -0.28 | |
| Week Change: -2.79% Year-to-date Change: 66.4% | |
| TME Links: Profile News Message Board | |
| Charts:- Daily , Weekly | |
| Add TME to Watchlist: View: Get Complete TME Trend Analysis ➞ | |
| To view more stocks, click on Next / Previous arrows or select different range: 0 - 25 , 25 - 50 , 50 - 75 , 75 - 100 , 100 - 125 , 125 - 150 , 150 - 175 , 175 - 200 , 200 - 225 | ||
| Click To Change The Sort Order: By Market Cap or Company Size Performance: Year-to-date, Week and Day | |
| Select Chart Type: | ||
|
Best Stocks Today 12Stocks.com |
© 2024 12Stocks.com Terms & Conditions Privacy Contact Us
All Information Provided Only For Education And Not To Be Used For Investing or Trading. See Terms & Conditions


One More Thing ... Get Best Stocks Delivered Daily!
Never Ever Miss A Move With Our Top Ten Stocks Lists
Find Best Stocks In Any Market - Bull or Bear Market
Take A Peek At Our Top Ten Stocks Lists: Daily, Weekly, Year-to-Date & Top Trends
Find Best Stocks In Any Market - Bull or Bear Market
Take A Peek At Our Top Ten Stocks Lists: Daily, Weekly, Year-to-Date & Top Trends
Asia Stocks With Best Up Trends [0-bearish to 100-bullish]: Cheetah Mobile[100], SunCar [100], Xunlei [100], United Microelectronics[100], ZTO Express[100], Silicon Motion[100], 36Kr [100], ASE [95], Sumitomo Mitsui[95], iHuman [95], Huize Holding[93]
Best Asia Stocks Year-to-Date:
U Power[2924.55%], DouYu [957.89%], Burning Rock[690.76%], China Liberal[548.77%], Yatsen Holding[521.92%], MicroCloud Hologram[422.3%], Uxin [336.52%], Zhihu [314.55%], Zhongchao [313.59%], Cheetah Mobile[167.11%], Smart Share[111.65%] Best Asia Stocks This Week:
Cheetah Mobile[32.68%], Sunlands [10.47%], Xunlei [9.71%], Dingdong (Cayman)[7.82%], AGM [5.99%], 36Kr [5.74%], XPeng [5.66%], SunCar [5.21%], Xiao-I [4.59%], United Microelectronics[3.91%], ASE [3.23%] Best Asia Stocks Daily:
Cheetah Mobile[9.73%], Sunlands [6.70%], XPeng [5.92%], SunCar [5.21%], QuantaSing [5.18%], Boqii Holding[5.12%], Fangdd Network[4.74%], Xiao-I [4.59%], Dingdong (Cayman)[4.32%], ChipMOS [2.88%], OneConnect Financial[2.65%]