
 Login Sign Up


| |||||
 |  | ||||

| 12Stocks.com Market Intelligence |
Best Asia Stocks
|
|
| Quick Read: Top Asia Stocks By Performances & Trends: Daily, Weekly, Year-to-Date, Market Cap (Size) & Technical Trends | |||
| Best Asia Views: Quick Browse View, Summary & Slide Show | |||
| 12Stocks.com Asia Stocks Performances & Trends Daily | |||||||||
|
|  The overall market intelligence score is 83 (0-bearish to 100-bullish) which puts Asia index in short term bullish trend. The market intelligence score from previous trading session is 90 and hence a deterioration of trend.
| ||||||||
Here are the market intelligence trend scores of the most requested Asia stocks at 12Stocks.com (click stock name for detailed review):
|


| Consider signing up for our daily 12Stocks.com "Best Stocks Newsletter". You will never ever miss a big stock move again! |
| 12Stocks.com: Top Performing Asia Index Stocks | ||||||||||||||||||||||||||||||||||||||||||||||||
 The top performing Asia Index stocks year to date are
Now, more recently, over last week, the top performing Asia Index stocks on the move are


|
||||||||||||||||||||||||||||||||||||||||||||||||
| 12Stocks.com: Investing in Asia Index with Stocks | |
|
The following table helps investors and traders sort through current performance and trends (as measured by market intelligence score) of various
stocks in the Asia Index. Quick View: Move mouse or cursor over stock symbol (ticker) to view short-term technical chart and over stock name to view long term chart. Click on  to add stock symbol to your watchlist and to add stock symbol to your watchlist and  to view watchlist. Click on any ticker or stock name for detailed market intelligence report for that stock. to view watchlist. Click on any ticker or stock name for detailed market intelligence report for that stock. |
12Stocks.com Performance of Stocks in Asia Index
| Ticker | Stock Name | Watchlist | Category | Recent Price | Market Intelligence Score | Change % | Weekly Change% |
| CMCM | Cheetah Mobile |   | Technology | 5.55 | 100 | 20.92% | 20.92% |
| CCM | Concord Medical | | Health Care | 0.60 | 71 | 19.24% | 19.24% |
| KRKR | 36Kr | | Technology | 0.49 | 100 | 15.88% | 15.88% |
| TOUR | Tuniu | | Consumer Staples | 1.06 | 100 | 9.28% | 9.28% |
| XNET | Xunlei | | Technology | 1.89 | 100 | 7.71% | 7.71% |
| ZLAB | Zai Lab | | Health Care | 20.84 | 42 | 7.42% | 7.42% |
| BEST | BEST | | Consumer Staples | 2.09 | 49 | 5.03% | 5.03% |
| LANV | Lanvin | | Services & Goods | 1.69 | 74 | 4.32% | 4.32% |
| MMYT | MakeMyTrip | | Services & Goods | 89.71 | 100 | 3.71% | 3.71% |
| AGMH | AGM | | Technology | 1.12 | 64 | 3.59% | 3.59% |
| STG | Sunlands | | Services & Goods | 8.80 | 50 | 3.53% | 3.53% |
| DDL | Dingdong (Cayman) | | Consumer Staples | 1.85 | 51 | 3.35% | 3.35% |
| HUIZ | Huize Holding | | Financials | 0.88 | 100 | 3.26% | 3.26% |
| MLCO | Melco Resorts | | Services & Goods | 8.85 | 95 | 3.15% | 3.15% |
| ASX | ASE | | Technology | 10.85 | 95 | 3.14% | 3.14% |
| MSC | Studio City | | Services & Goods | 8.05 | 93 | 2.94% | 2.94% |
| TUYA | Tuya | | Technology | 2.15 | 95 | 2.87% | 2.87% |
| UMC | United Microelectronics | | Technology | 8.41 | 100 | 2.81% | 2.81% |
| DAO | Youdao | | Technology | 3.81 | 30 | 2.70% | 2.70% |
| GDS | GDS | | Technology | 9.75 | 100 | 2.63% | 2.63% |
| HSAI | Hesai | | Services & Goods | 5.25 | 68 | 2.04% | 2.04% |
| MFG | Mizuho Financial | | Financials | 4.14 | 85 | 1.97% | 1.97% |
| HMC | Honda Motor | | Consumer Staples | 33.86 | 35 | 1.87% | 1.87% |
| EDTK | Skillful Craftsman | | Consumer Staples | 0.94 | 83 | 1.74% | 1.74% |
| SIFY | Sify | | Technology | 1.28 | 74 | 1.59% | 1.59% |
| To view more stocks, click on Next / Previous arrows or select different range: 0 - 25 , 25 - 50 , 50 - 75 , 75 - 100 , 100 - 125 , 125 - 150 , 150 - 175 , 175 - 200 , 200 - 225 | ||
 | Click To Change The Sort Order: By Market Cap or Company Size Performance: Year-to-date, Week and Day |  |
|
Get the most comprehensive stock market coverage daily at 12Stocks.com ➞ Best Stocks Today ➞ Best Stocks Weekly ➞ Best Stocks Year-to-Date ➞ Best Stocks Trends ➞  Best Stocks Today 12Stocks.com Best Nasdaq Stocks ➞ Best S&P 500 Stocks ➞ Best Tech Stocks ➞ Best Biotech Stocks ➞ |
| Detailed Overview of Asia Stocks |
| Asia Technical Overview, Leaders & Laggards, Top Asia ETF Funds & Detailed Asia Stocks List, Charts, Trends & More |
| Asia: Technical Analysis, Trends & YTD Performance | |
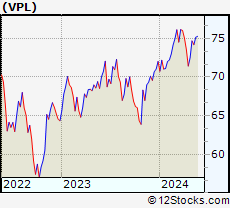
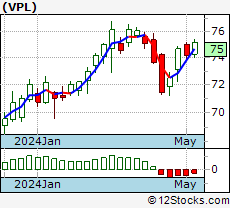 VPL Weekly Chart |
|
| Long Term Trend: Very Good | |
| Medium Term Trend: Very Good | |
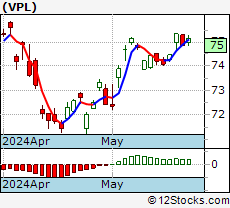 VPL Daily Chart |
|
| Short Term Trend: Not Good | |
| Overall Trend Score: 83 | |
| YTD Performance: 4.53% | |
| **Trend Scores & Views Are Only For Educational Purposes And Not For Investing | |
| 12Stocks.com: Investing in Asia Index using Exchange Traded Funds | |
|
The following table shows list of key exchange traded funds (ETF) that
help investors play Asia stock market. For detailed view, check out our ETF Funds section of our website. Quick View: Move mouse or cursor over ETF symbol (ticker) to view short-term technical chart and over ETF name to view long term chart. Click on ticker or stock name for detailed view. Click on to add stock symbol to your watchlist and to view watchlist. |
12Stocks.com List of ETFs that track Asia Index
| Ticker | ETF Name | Watchlist | Recent Price | Market Intelligence Score | Change % | Week % | Year-to-date % |
| VPL | Pacific | | 75.29 | 83 | 0.19 | 0.19 | 4.53% |
| EEMA | Emerging Markets Asia | | 73.21 | 69 | -0.31 | -0.31 | 10.74% |
| AIA | Asia 50 | | 67.77 | 64 | -0.70 | -0.7 | 16.91% |
| AAXJ | All Country Asia | | 73.11 | 69 | -0.46 | -0.46 | 9.82% |
| GMF | Emerging Asia Pacific | | 112.14 | 76 | -0.43 | -0.43 | 10.96% |
| EPP | Pacific ex Japan | | 44.99 | 76 | -0.60 | -0.6 | 3.64% |
| ASEA | Southeast Asia | | 15.13 | 54 | -1.37 | -1.37 | 0.32% |
| DVYA | Asia/Pacific Dividend | | 38.64 | 95 | 0.03 | 0.03 | 8.06% |
| IPAC | Core Pacific | | 62.87 | 83 | 0.21 | 0.21 | 5.65% |
| FXI | China Large-Cap | | 29.01 | 78 | -1.09 | -1.09 | 20.72% |
| EWY | South Korea | | 65.24 | 56 | -0.34 | -0.34 | -0.44% |
| EWT | Taiwan | | 50.83 | 68 | -0.29 | -0.29 | 10.43% |
| EWJ | Japan | | 69.22 | 62 | 0.71 | 0.71 | 7.92% |
| EWH | Hong Kong | | 17.99 | 90 | -0.39 | -0.39 | 3.57% |
| EWS | Singapore | | 19.61 | 71 | -0.91 | -0.91 | 4.87% |
| EWM | Malaysia | | 23.42 | 100 | 0.60 | 0.6 | 10.21% |
| EPHE | Philippines | | 25.96 | 44 | 0.15 | 0.15 | -0.12% |
| EIDO | Indonesia | | 20.90 | 25 | -1.88 | -1.88 | -6.36% |
| THD | Thailand | | 60.25 | 69 | -0.46 | -0.46 | -5.65% |
| VNM | Vietnam | | 12.97 | 59 | 0.15 | 0.15 | 0.39% |
| 12Stocks.com: Charts, Trends, Fundamental Data and Performances of Asia Stocks | |
|
We now take in-depth look at all Asia stocks including charts, multi-period performances and overall trends (as measured by market intelligence score). One can sort Asia stocks (click link to choose) by Daily, Weekly and by Year-to-Date performances. Also, one can sort by size of the company or by market capitalization. |
| Select Your Default Chart Type: | |||||
| |||||
| Click on stock symbol or name for detailed view. Click on to add stock symbol to your watchlist and to view watchlist. Quick View: Move mouse or cursor over "Daily" to quickly view daily technical stock chart and over "Weekly" to view weekly technical stock chart. | |||||
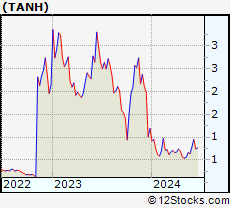 | TANH Tantech Holdings Ltd |
| Sector: Materials | |
| SubSector: Nonmetallic Mineral Mining | |
| MarketCap: 30.55 Millions | |
| Recent Price: 0.97 Market Intelligence Score: 100 | |
| Day Percent Change: 46.88% Day Change: 0.31 | |
| Week Change: 46.88% Year-to-date Change: -18.5% | |
| TANH Links: Profile News Message Board | |
| Charts:- Daily , Weekly | |
| Add TANH to Watchlist: View: Get Complete TANH Trend Analysis ➞ | |
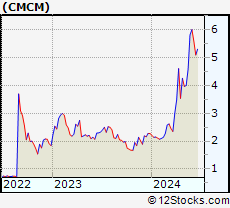 | CMCM Cheetah Mobile Inc. |
| Sector: Technology | |
| SubSector: Application Software | |
| MarketCap: 343.362 Millions | |
| Recent Price: 5.55 Market Intelligence Score: 100 | |
| Day Percent Change: 20.92% Day Change: 0.96 | |
| Week Change: 20.92% Year-to-date Change: 143.4% | |
| CMCM Links: Profile News Message Board | |
| Charts:- Daily , Weekly | |
| Add CMCM to Watchlist: View: Get Complete CMCM Trend Analysis ➞ | |
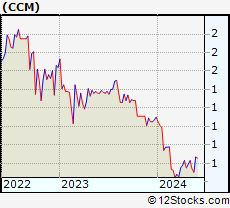 | CCM Concord Medical Services Holdings Limited |
| Sector: Health Care | |
| SubSector: Hospitals | |
| MarketCap: 138.646 Millions | |
| Recent Price: 0.60 Market Intelligence Score: 71 | |
| Day Percent Change: 19.24% Day Change: 0.10 | |
| Week Change: 19.24% Year-to-date Change: -45.5% | |
| CCM Links: Profile News Message Board | |
| Charts:- Daily , Weekly | |
| Add CCM to Watchlist: View: Get Complete CCM Trend Analysis ➞ | |
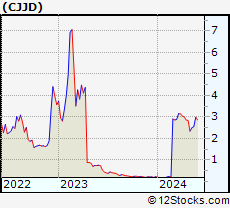 | CJJD China Jo-Jo Drugstores, Inc. |
| Sector: Services & Goods | |
| SubSector: Drug Stores | |
| MarketCap: 57.8351 Millions | |
| Recent Price: 2.97 Market Intelligence Score: 95 | |
| Day Percent Change: 16.63% Day Change: 0.42 | |
| Week Change: 16.63% Year-to-date Change: 1,239.6% | |
| CJJD Links: Profile News Message Board | |
| Charts:- Daily , Weekly | |
| Add CJJD to Watchlist: View: Get Complete CJJD Trend Analysis ➞ | |
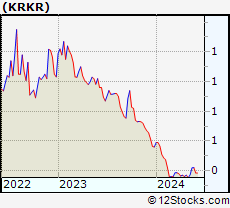 | KRKR 36Kr Holdings Inc. |
| Sector: Technology | |
| SubSector: Internet Information Providers | |
| MarketCap: 173.18 Millions | |
| Recent Price: 0.49 Market Intelligence Score: 100 | |
| Day Percent Change: 15.88% Day Change: 0.07 | |
| Week Change: 15.88% Year-to-date Change: -13.1% | |
| KRKR Links: Profile News Message Board | |
| Charts:- Daily , Weekly | |
| Add KRKR to Watchlist: View: Get Complete KRKR Trend Analysis ➞ | |
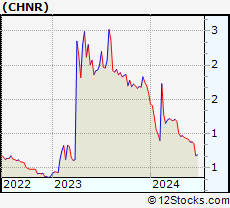 | CHNR China Natural Resources, Inc. |
| Sector: Materials | |
| SubSector: Industrial Metals & Minerals | |
| MarketCap: 21.691 Millions | |
| Recent Price: 1.07 Market Intelligence Score: 64 | |
| Day Percent Change: 15.04% Day Change: 0.14 | |
| Week Change: 15.04% Year-to-date Change: -32.8% | |
| CHNR Links: Profile News Message Board | |
| Charts:- Daily , Weekly | |
| Add CHNR to Watchlist: View: Get Complete CHNR Trend Analysis ➞ | |
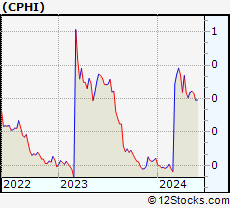 | CPHI China Pharma Holdings, Inc. |
| Sector: Health Care | |
| SubSector: Drug Manufacturers - Major | |
| MarketCap: 29.4543 Millions | |
| Recent Price: 0.36 Market Intelligence Score: 90 | |
| Day Percent Change: 12.97% Day Change: 0.04 | |
| Week Change: 12.97% Year-to-date Change: 195.0% | |
| CPHI Links: Profile News Message Board | |
| Charts:- Daily , Weekly | |
| Add CPHI to Watchlist: View: Get Complete CPHI Trend Analysis ➞ | |
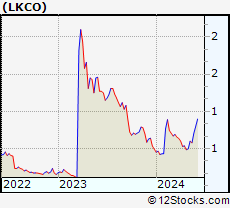 | LKCO Luokung Technology Corp. |
| Sector: Technology | |
| SubSector: Application Software | |
| MarketCap: 84 Millions | |
| Recent Price: 0.65 Market Intelligence Score: 74 | |
| Day Percent Change: 12.83% Day Change: 0.07 | |
| Week Change: 12.83% Year-to-date Change: 32.1% | |
| LKCO Links: Profile News Message Board | |
| Charts:- Daily , Weekly | |
| Add LKCO to Watchlist: View: Get Complete LKCO Trend Analysis ➞ | |
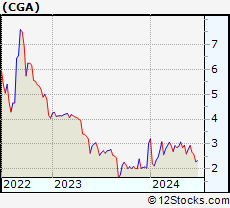 | CGA China Green Agriculture, Inc. |
| Sector: Materials | |
| SubSector: Agricultural Chemicals | |
| MarketCap: 18.2429 Millions | |
| Recent Price: 2.93 Market Intelligence Score: 100 | |
| Day Percent Change: 12.69% Day Change: 0.33 | |
| Week Change: 12.69% Year-to-date Change: -3.3% | |
| CGA Links: Profile News Message Board | |
| Charts:- Daily , Weekly | |
| Add CGA to Watchlist: View: Get Complete CGA Trend Analysis ➞ | |
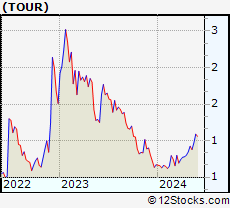 | TOUR Tuniu Corporation |
| Sector: Consumer Staples | |
| SubSector: Recreational Goods, Other | |
| MarketCap: 124.459 Millions | |
| Recent Price: 1.06 Market Intelligence Score: 100 | |
| Day Percent Change: 9.28% Day Change: 0.09 | |
| Week Change: 9.28% Year-to-date Change: 58.0% | |
| TOUR Links: Profile News Message Board | |
| Charts:- Daily , Weekly | |
| Add TOUR to Watchlist: View: Get Complete TOUR Trend Analysis ➞ | |
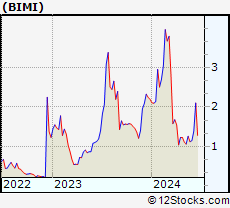 | BIMI BOQI International Medical Inc. |
| Sector: Industrials | |
| SubSector: Diversified Machinery | |
| MarketCap: 28.7016 Millions | |
| Recent Price: 1.37 Market Intelligence Score: 64 | |
| Day Percent Change: 8.33% Day Change: 0.10 | |
| Week Change: 8.33% Year-to-date Change: -38.0% | |
| BIMI Links: Profile News Message Board | |
| Charts:- Daily , Weekly | |
| Add BIMI to Watchlist: View: Get Complete BIMI Trend Analysis ➞ | |
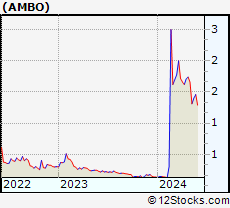 | AMBO Ambow Education Holding Ltd. |
| Sector: Services & Goods | |
| SubSector: Education & Training Services | |
| MarketCap: 44.8006 Millions | |
| Recent Price: 1.51 Market Intelligence Score: 44 | |
| Day Percent Change: 8.14% Day Change: 0.11 | |
| Week Change: 8.14% Year-to-date Change: 1,001.1% | |
| AMBO Links: Profile News Message Board | |
| Charts:- Daily , Weekly | |
| Add AMBO to Watchlist: View: Get Complete AMBO Trend Analysis ➞ | |
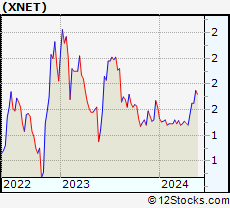 | XNET Xunlei Limited |
| Sector: Technology | |
| SubSector: Application Software | |
| MarketCap: 203.662 Millions | |
| Recent Price: 1.89 Market Intelligence Score: 100 | |
| Day Percent Change: 7.71% Day Change: 0.14 | |
| Week Change: 7.71% Year-to-date Change: 16.4% | |
| XNET Links: Profile News Message Board | |
| Charts:- Daily , Weekly | |
| Add XNET to Watchlist: View: Get Complete XNET Trend Analysis ➞ | |
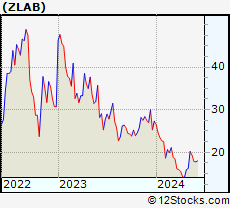 | ZLAB Zai Lab Limited |
| Sector: Health Care | |
| SubSector: Biotechnology | |
| MarketCap: 3970.35 Millions | |
| Recent Price: 20.84 Market Intelligence Score: 42 | |
| Day Percent Change: 7.42% Day Change: 1.44 | |
| Week Change: 7.42% Year-to-date Change: -23.8% | |
| ZLAB Links: Profile News Message Board | |
| Charts:- Daily , Weekly | |
| Add ZLAB to Watchlist: View: Get Complete ZLAB Trend Analysis ➞ | |
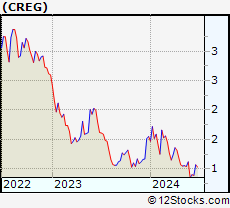 | CREG China Recycling Energy Corporation |
| Sector: Industrials | |
| SubSector: Waste Management | |
| MarketCap: 3.90988 Millions | |
| Recent Price: 1.11 Market Intelligence Score: 64 | |
| Day Percent Change: 6.35% Day Change: 0.07 | |
| Week Change: 6.35% Year-to-date Change: -28.7% | |
| CREG Links: Profile News Message Board | |
| Charts:- Daily , Weekly | |
| Add CREG to Watchlist: View: Get Complete CREG Trend Analysis ➞ | |
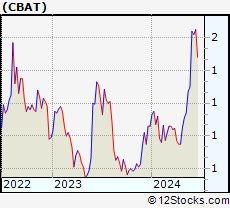 | CBAT CBAK Energy Technology, Inc. |
| Sector: Health Care | |
| SubSector: Medical Laboratories & Research | |
| MarketCap: 22.43 Millions | |
| Recent Price: 1.34 Market Intelligence Score: 100 | |
| Day Percent Change: 5.51% Day Change: 0.07 | |
| Week Change: 5.51% Year-to-date Change: 26.4% | |
| CBAT Links: Profile News Message Board | |
| Charts:- Daily , Weekly | |
| Add CBAT to Watchlist: View: Get Complete CBAT Trend Analysis ➞ | |
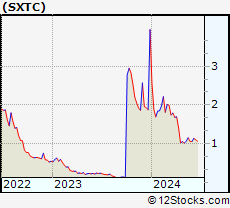 | SXTC China SXT Pharmaceuticals, Inc. |
| Sector: Health Care | |
| SubSector: Drugs - Generic | |
| MarketCap: 18.8185 Millions | |
| Recent Price: 1.21 Market Intelligence Score: 64 | |
| Day Percent Change: 5.22% Day Change: 0.06 | |
| Week Change: 5.22% Year-to-date Change: -69.4% | |
| SXTC Links: Profile News Message Board | |
| Charts:- Daily , Weekly | |
| Add SXTC to Watchlist: View: Get Complete SXTC Trend Analysis ➞ | |
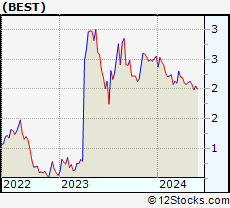 | BEST BEST Inc. |
| Sector: Consumer Staples | |
| SubSector: Packaging & Containers | |
| MarketCap: 1981.73 Millions | |
| Recent Price: 2.09 Market Intelligence Score: 49 | |
| Day Percent Change: 5.03% Day Change: 0.10 | |
| Week Change: 5.03% Year-to-date Change: -18.1% | |
| BEST Links: Profile News Message Board | |
| Charts:- Daily , Weekly | |
| Add BEST to Watchlist: View: Get Complete BEST Trend Analysis ➞ | |
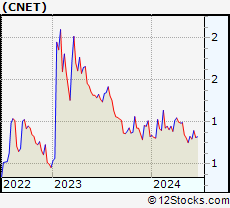 | CNET ChinaNet Online Holdings, Inc. |
| Sector: Services & Goods | |
| SubSector: Advertising Agencies | |
| MarketCap: 14.6 Millions | |
| Recent Price: 0.79 Market Intelligence Score: 20 | |
| Day Percent Change: 4.62% Day Change: 0.03 | |
| Week Change: 4.62% Year-to-date Change: -4.8% | |
| CNET Links: Profile News Message Board | |
| Charts:- Daily , Weekly | |
| Add CNET to Watchlist: View: Get Complete CNET Trend Analysis ➞ | |
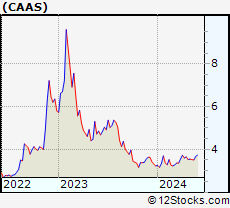 | CAAS China Automotive Systems, Inc. |
| Sector: Consumer Staples | |
| SubSector: Auto Parts | |
| MarketCap: 53.0939 Millions | |
| Recent Price: 3.67 Market Intelligence Score: 100 | |
| Day Percent Change: 4.56% Day Change: 0.16 | |
| Week Change: 4.56% Year-to-date Change: 13.6% | |
| CAAS Links: Profile News Message Board | |
| Charts:- Daily , Weekly | |
| Add CAAS to Watchlist: View: Get Complete CAAS Trend Analysis ➞ | |
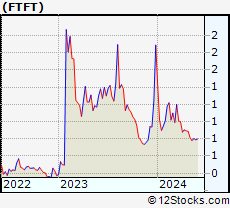 | FTFT Future FinTech Group Inc. |
| Sector: Consumer Staples | |
| SubSector: Beverages - Soft Drinks | |
| MarketCap: 29.472 Millions | |
| Recent Price: 0.84 Market Intelligence Score: 57 | |
| Day Percent Change: 4.47% Day Change: 0.04 | |
| Week Change: 4.47% Year-to-date Change: -55.6% | |
| FTFT Links: Profile News Message Board | |
| Charts:- Daily , Weekly | |
| Add FTFT to Watchlist: View: Get Complete FTFT Trend Analysis ➞ | |
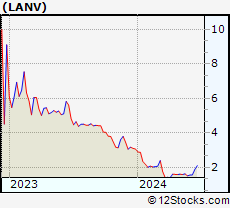 | LANV Lanvin Group Holdings Limited |
| Sector: Services & Goods | |
| SubSector: Luxury Goods | |
| MarketCap: 712 Millions | |
| Recent Price: 1.69 Market Intelligence Score: 74 | |
| Day Percent Change: 4.32% Day Change: 0.07 | |
| Week Change: 4.32% Year-to-date Change: -44.8% | |
| LANV Links: Profile News Message Board | |
| Charts:- Daily , Weekly | |
| Add LANV to Watchlist: View: Get Complete LANV Trend Analysis ➞ | |
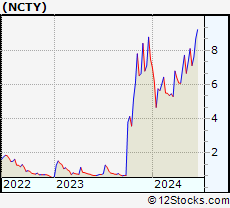 | NCTY The9 Limited |
| Sector: Technology | |
| SubSector: Multimedia & Graphics Software | |
| MarketCap: 19.7586 Millions | |
| Recent Price: 7.65 Market Intelligence Score: 80 | |
| Day Percent Change: 4.22% Day Change: 0.31 | |
| Week Change: 4.22% Year-to-date Change: 2.1% | |
| NCTY Links: Profile News Message Board | |
| Charts:- Daily , Weekly | |
| Add NCTY to Watchlist: View: Get Complete NCTY Trend Analysis ➞ | |
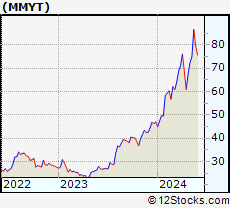 | MMYT MakeMyTrip Limited |
| Sector: Services & Goods | |
| SubSector: General Entertainment | |
| MarketCap: 1429.59 Millions | |
| Recent Price: 89.71 Market Intelligence Score: 100 | |
| Day Percent Change: 3.71% Day Change: 3.21 | |
| Week Change: 3.71% Year-to-date Change: 91.0% | |
| MMYT Links: Profile News Message Board | |
| Charts:- Daily , Weekly | |
| Add MMYT to Watchlist: View: Get Complete MMYT Trend Analysis ➞ | |
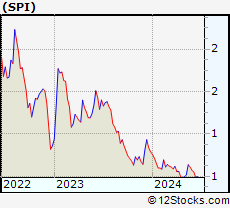 | SPI SPI Energy Co., Ltd. |
| Sector: Technology | |
| SubSector: Semiconductor - Specialized | |
| MarketCap: 12.066 Millions | |
| Recent Price: 0.66 Market Intelligence Score: 100 | |
| Day Percent Change: 3.63% Day Change: 0.02 | |
| Week Change: 3.63% Year-to-date Change: -16.5% | |
| SPI Links: Profile News Message Board | |
| Charts:- Daily , Weekly | |
| Add SPI to Watchlist: View: Get Complete SPI Trend Analysis ➞ | |
| To view more stocks, click on Next / Previous arrows or select different range: 0 - 25 , 25 - 50 , 50 - 75 , 75 - 100 , 100 - 125 , 125 - 150 , 150 - 175 , 175 - 200 , 200 - 225 | ||
| Click To Change The Sort Order: By Market Cap or Company Size Performance: Year-to-date, Week and Day | |
| Select Chart Type: | ||
|
Best Stocks Today 12Stocks.com |
© 2024 12Stocks.com Terms & Conditions Privacy Contact Us
All Information Provided Only For Education And Not To Be Used For Investing or Trading. See Terms & Conditions


One More Thing ... Get Best Stocks Delivered Daily!
Never Ever Miss A Move With Our Top Ten Stocks Lists
Find Best Stocks In Any Market - Bull or Bear Market
Take A Peek At Our Top Ten Stocks Lists: Daily, Weekly, Year-to-Date & Top Trends
Find Best Stocks In Any Market - Bull or Bear Market
Take A Peek At Our Top Ten Stocks Lists: Daily, Weekly, Year-to-Date & Top Trends
Asia Stocks With Best Up Trends [0-bearish to 100-bullish]: Cheetah Mobile[100], 36Kr [100], Xunlei [100], MakeMyTrip [100], Huize Holding[100], United Microelectronics[100], GDS [100], AMTD Digital[100], Silicon Motion[100], Sumitomo Mitsui[100], Chunghwa Telecom[100]
Best Asia Stocks Year-to-Date:
U Power[2924.55%], DouYu [1015.79%], Burning Rock[706.3%], China Liberal[548.77%], Yatsen Holding[509.62%], MicroCloud Hologram[451.08%], Uxin [332.24%], Zhihu [328.3%], Zhongchao [313.59%], Cheetah Mobile[143.42%], Smart Share[111.65%] Best Asia Stocks This Week:
Cheetah Mobile[20.92%], 36Kr [15.88%], Xunlei [7.71%], Zai Lab[7.42%], BEST [5.03%], Lanvin [4.32%], MakeMyTrip [3.71%], AGM [3.59%], Sunlands [3.53%], Dingdong (Cayman)[3.35%], Huize Holding[3.26%] Best Asia Stocks Daily:
Cheetah Mobile[20.92%], 36Kr [15.88%], Xunlei [7.71%], Zai Lab[7.42%], BEST [5.03%], Lanvin [4.32%], MakeMyTrip [3.71%], AGM [3.59%], Sunlands [3.53%], Dingdong (Cayman)[3.35%], Huize Holding[3.26%]