
 Login Sign Up


| |||||
 |  | ||||

| 12Stocks.com Market Intelligence |
Best Asia Stocks
|
|
| Quick Read: Top Asia Stocks By Performances & Trends: Daily, Weekly, Year-to-Date, Market Cap (Size) & Technical Trends | |||
| Best Asia Views: Quick Browse View, Summary & Slide Show | |||
| 12Stocks.com Asia Stocks Performances & Trends Daily | |||||||||
|
|  The overall market intelligence score is 50 (0-bearish to 100-bullish) which puts Asia index in short term neutral trend. The market intelligence score from previous trading session is 20 and hence an improvement of trend.
| ||||||||
Here are the market intelligence trend scores of the most requested Asia stocks at 12Stocks.com (click stock name for detailed review):
|


| Consider signing up for our daily 12Stocks.com "Best Stocks Newsletter". You will never ever miss a big stock move again! |
| 12Stocks.com: Top Performing Asia Index Stocks | ||||||||||||||||||||||||||||||||||||||||||||||||
 The top performing Asia Index stocks year to date are
Now, more recently, over last week, the top performing Asia Index stocks on the move are


|
||||||||||||||||||||||||||||||||||||||||||||||||
| 12Stocks.com: Investing in Asia Index with Stocks | |
|
The following table helps investors and traders sort through current performance and trends (as measured by market intelligence score) of various
stocks in the Asia Index. Quick View: Move mouse or cursor over stock symbol (ticker) to view short-term technical chart and over stock name to view long term chart. Click on  to add stock symbol to your watchlist and to add stock symbol to your watchlist and  to view watchlist. Click on any ticker or stock name for detailed market intelligence report for that stock. to view watchlist. Click on any ticker or stock name for detailed market intelligence report for that stock. |
12Stocks.com Performance of Stocks in Asia Index
| Ticker | Stock Name | Watchlist | Category | Recent Price | Market Intelligence Score | Change % | YTD Change% |
| SY | So-Young |   | Technology | 1.06 | 32 | 0.95% | -17.83% |
| WIMI | WiMi Hologram | | Technology | 0.88 | 32 | 0.00% | 9.19% |
| CNF | CNFinance | | Financials | 1.55 | 32 | 0.00% | -30.18% |
| PLAG | Planet Green | | Consumer Staples | 0.19 | 32 | -4.50% | -61.80% |
| YRD | Yiren Digital | | Financials | 4.84 | 32 | -0.62% | 55.13% |
| IMOS | ChipMOS | | Technology | 27.21 | 32 | -0.51% | 0.00% |
| MOMO | Momo | | Technology | 5.64 | 32 | -0.27% | -18.85% |
| NHTC | Natural Health | | Consumer Staples | 6.91 | 31 | 0.58% | 17.92% |
| BZUN | Baozun | | Services & Goods | 2.67 | 31 | -3.96% | -2.55% |
| THCH | TH | | Services & Goods | 1.12 | 30 | 0.00% | -35.63% |
| SPI | SPI Energy | | Technology | 0.57 | 30 | -2.60% | -27.89% |
| DAO | Youdao | | Technology | 3.73 | 29 | -2.36% | -5.33% |
| ATAT | Atour Lifestyle | | Services & Goods | 17.81 | 28 | 1.08% | 1.66% |
| FTFT | Future FinTech | | Consumer Staples | 0.80 | 27 | 5.10% | -57.67% |
| TOP | TOP Financial | | Financials | 2.49 | 27 | 0.40% | -33.06% |
| ZLAB | Zai Lab | | Health Care | 17.78 | 27 | -2.25% | -34.94% |
| YJ | Yunji | | Services & Goods | 0.75 | 25 | 9.95% | 5.50% |
| GCT | GigaCloud | | Technology | 31.14 | 25 | 2.87% | 70.07% |
| SXTC | China SXT | | Health Care | 1.05 | 25 | -9.45% | -73.41% |
| KXIN | Kaixin Auto | | Industrials | 0.15 | 25 | -5.62% | -82.25% |
| STG | Sunlands | | Services & Goods | 7.17 | 25 | -4.78% | -29.50% |
| SIFY | Sify | | Technology | 1.11 | 25 | -34.23% | -40.75% |
| CNET | ChinaNet Online | | Services & Goods | 0.80 | 25 | -2.38% | -3.67% |
| KRKR | 36Kr | | Technology | 0.39 | 25 | -1.28% | -31.25% |
| INFY | Infosys | | Technology | 16.75 | 25 | -0.71% | -8.87% |
| To view more stocks, click on Next / Previous arrows or select different range: 0 - 25 , 25 - 50 , 50 - 75 , 75 - 100 , 100 - 125 , 125 - 150 , 150 - 175 , 175 - 200 , 200 - 225 | ||
 | Click To Change The Sort Order: By Market Cap or Company Size Performance: Year-to-date, Week and Day |  |
|
Get the most comprehensive stock market coverage daily at 12Stocks.com ➞ Best Stocks Today ➞ Best Stocks Weekly ➞ Best Stocks Year-to-Date ➞ Best Stocks Trends ➞  Best Stocks Today 12Stocks.com Best Nasdaq Stocks ➞ Best S&P 500 Stocks ➞ Best Tech Stocks ➞ Best Biotech Stocks ➞ |
| Detailed Overview of Asia Stocks |
| Asia Technical Overview, Leaders & Laggards, Top Asia ETF Funds & Detailed Asia Stocks List, Charts, Trends & More |
| Asia: Technical Analysis, Trends & YTD Performance | |
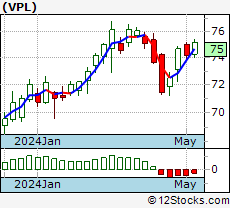 VPL Weekly Chart |
|
| Long Term Trend: Good | |
| Medium Term Trend: Not Good | |
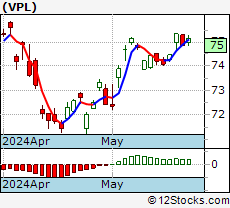 VPL Daily Chart |
|
| Short Term Trend: Deteriorating | |
| Overall Trend Score: 50 | |
| YTD Performance: 3.1% | |
| **Trend Scores & Views Are Only For Educational Purposes And Not For Investing | |
| 12Stocks.com: Investing in Asia Index using Exchange Traded Funds | |
|
The following table shows list of key exchange traded funds (ETF) that
help investors play Asia stock market. For detailed view, check out our ETF Funds section of our website. Quick View: Move mouse or cursor over ETF symbol (ticker) to view short-term technical chart and over ETF name to view long term chart. Click on ticker or stock name for detailed view. Click on to add stock symbol to your watchlist and to view watchlist. |
12Stocks.com List of ETFs that track Asia Index
| Ticker | ETF Name | Watchlist | Recent Price | Market Intelligence Score | Change % | Week % | Year-to-date % |
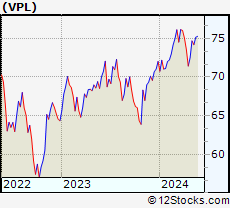
| VPL | Pacific | | 74.26 | 50 | 0.91 | -0.01 | 3.1% |
| EEMA | Emerging Markets Asia | | 70.29 | 51 | -1.33 | -2.97 | 6.32% |
| AIA | Asia 50 | | 65.18 | 58 | 0.37 | -2.1 | 12.44% |
| AAXJ | All Country Asia | | 70.13 | 51 | -1.05 | -2.82 | 5.34% |
| GMF | Emerging Asia Pacific | | 108.48 | 51 | -1.27 | -2.73 | 7.34% |
| EPP | Pacific ex Japan | | 43.86 | 76 | 0.57 | -0.5 | 1.04% |
| ASEA | Southeast Asia | | 14.72 | 20 | -0.41 | -1.85 | -2.4% |
| DVYA | Asia/Pacific Dividend | | 36.92 | 39 | -0.55 | -2.43 | 3.25% |
| IPAC | Core Pacific | | 61.99 | 43 | 0.49 | -0.11 | 4.17% |
| FXI | China Large-Cap | | 26.63 | 36 | -1.92 | -3.44 | 10.82% |
| EWY | South Korea | | 62.18 | 0 | -0.50 | -3 | -5.11% |
| EWT | Taiwan | | 50.32 | 61 | -1.62 | -2.65 | 9.32% |
| EWJ | Japan | | 68.97 | 55 | 1.34 | 0.74 | 7.53% |
| EWH | Hong Kong | | 16.72 | 36 | -0.36 | -2.22 | -3.74% |
| EWS | Singapore | | 19.56 | 66 | -0.25 | -0.2 | 4.6% |
| EWM | Malaysia | | 22.97 | 51 | -0.26 | -0.82 | 8.09% |
| EPHE | Philippines | | 24.50 | 7 | 0.70 | -4.18 | -5.73% |
| EIDO | Indonesia | | 19.76 | 0 | -0.50 | -3.61 | -11.47% |
| THD | Thailand | | 57.55 | 10 | -0.54 | -1.88 | -9.88% |
| VNM | Vietnam | | 12.59 | 25 | -0.20 | -0.08 | -2.59% |
| 12Stocks.com: Charts, Trends, Fundamental Data and Performances of Asia Stocks | |
|
We now take in-depth look at all Asia stocks including charts, multi-period performances and overall trends (as measured by market intelligence score). One can sort Asia stocks (click link to choose) by Daily, Weekly and by Year-to-Date performances. Also, one can sort by size of the company or by market capitalization. |
| Select Your Default Chart Type: | |||||
| |||||
| Click on stock symbol or name for detailed view. Click on to add stock symbol to your watchlist and to view watchlist. Quick View: Move mouse or cursor over "Daily" to quickly view daily technical stock chart and over "Weekly" to view weekly technical stock chart. | |||||
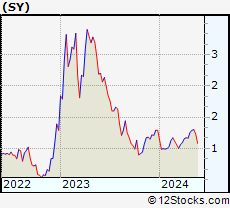 | SY So-Young International Inc. |
| Sector: Technology | |
| SubSector: Healthcare Information Services | |
| MarketCap: 1000.55 Millions | |
| Recent Price: 1.06 Market Intelligence Score: 32 | |
| Day Percent Change: 0.95% Day Change: 0.01 | |
| Week Change: 1.92% Year-to-date Change: -17.8% | |
| SY Links: Profile News Message Board | |
| Charts:- Daily , Weekly | |
| Add SY to Watchlist: View: Get Complete SY Trend Analysis ➞ | |
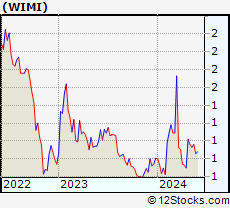 | WIMI WiMi Hologram Cloud Inc. |
| Sector: Technology | |
| SubSector: Advertising Agencies | |
| MarketCap: 41837 Millions | |
| Recent Price: 0.88 Market Intelligence Score: 32 | |
| Day Percent Change: 0.00% Day Change: 0.00 | |
| Week Change: 2.46% Year-to-date Change: 9.2% | |
| WIMI Links: Profile News Message Board | |
| Charts:- Daily , Weekly | |
| Add WIMI to Watchlist: View: Get Complete WIMI Trend Analysis ➞ | |
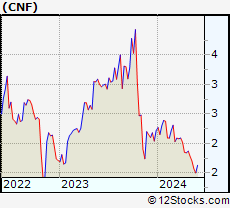 | CNF CNFinance Holdings Limited |
| Sector: Financials | |
| SubSector: Credit Services | |
| MarketCap: 277.408 Millions | |
| Recent Price: 1.55 Market Intelligence Score: 32 | |
| Day Percent Change: 0.00% Day Change: 0.00 | |
| Week Change: 3.33% Year-to-date Change: -30.2% | |
| CNF Links: Profile News Message Board | |
| Charts:- Daily , Weekly | |
| Add CNF to Watchlist: View: Get Complete CNF Trend Analysis ➞ | |
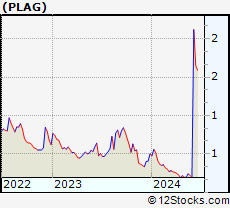 | PLAG Planet Green Holdings Corp. |
| Sector: Consumer Staples | |
| SubSector: Processed & Packaged Goods | |
| MarketCap: 26.9748 Millions | |
| Recent Price: 0.19 Market Intelligence Score: 32 | |
| Day Percent Change: -4.50% Day Change: -0.01 | |
| Week Change: -13.54% Year-to-date Change: -61.8% | |
| PLAG Links: Profile News Message Board | |
| Charts:- Daily , Weekly | |
| Add PLAG to Watchlist: View: Get Complete PLAG Trend Analysis ➞ | |
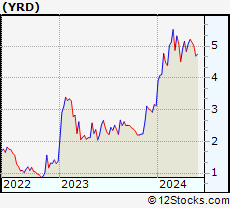 | YRD Yiren Digital Ltd. |
| Sector: Financials | |
| SubSector: Credit Services | |
| MarketCap: 330.208 Millions | |
| Recent Price: 4.84 Market Intelligence Score: 32 | |
| Day Percent Change: -0.62% Day Change: -0.03 | |
| Week Change: 3.2% Year-to-date Change: 55.1% | |
| YRD Links: Profile News Message Board | |
| Charts:- Daily , Weekly | |
| Add YRD to Watchlist: View: Get Complete YRD Trend Analysis ➞ | |
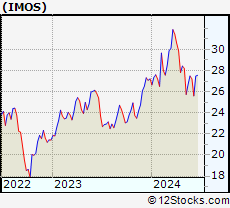 | IMOS ChipMOS TECHNOLOGIES INC. |
| Sector: Technology | |
| SubSector: Semiconductor Equipment & Materials | |
| MarketCap: 658.918 Millions | |
| Recent Price: 27.21 Market Intelligence Score: 32 | |
| Day Percent Change: -0.51% Day Change: -0.14 | |
| Week Change: -1.02% Year-to-date Change: 0.0% | |
| IMOS Links: Profile News Message Board | |
| Charts:- Daily , Weekly | |
| Add IMOS to Watchlist: View: Get Complete IMOS Trend Analysis ➞ | |
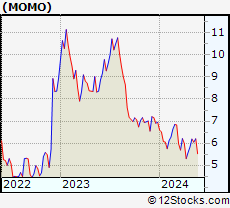 | MOMO Momo Inc. |
| Sector: Technology | |
| SubSector: Internet Software & Services | |
| MarketCap: 4796.71 Millions | |
| Recent Price: 5.64 Market Intelligence Score: 32 | |
| Day Percent Change: -0.27% Day Change: -0.02 | |
| Week Change: 2.17% Year-to-date Change: -18.9% | |
| MOMO Links: Profile News Message Board | |
| Charts:- Daily , Weekly | |
| Add MOMO to Watchlist: View: Get Complete MOMO Trend Analysis ➞ | |
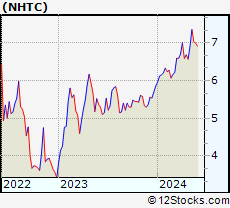 | NHTC Natural Health Trends Corp. |
| Sector: Consumer Staples | |
| SubSector: Personal Products | |
| MarketCap: 33.4985 Millions | |
| Recent Price: 6.91 Market Intelligence Score: 31 | |
| Day Percent Change: 0.58% Day Change: 0.04 | |
| Week Change: -1.14% Year-to-date Change: 17.9% | |
| NHTC Links: Profile News Message Board | |
| Charts:- Daily , Weekly | |
| Add NHTC to Watchlist: View: Get Complete NHTC Trend Analysis ➞ | |
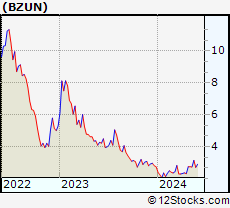 | BZUN Baozun Inc. |
| Sector: Services & Goods | |
| SubSector: Catalog & Mail Order Houses | |
| MarketCap: 1668.92 Millions | |
| Recent Price: 2.67 Market Intelligence Score: 31 | |
| Day Percent Change: -3.96% Day Change: -0.11 | |
| Week Change: -1.48% Year-to-date Change: -2.6% | |
| BZUN Links: Profile News Message Board | |
| Charts:- Daily , Weekly | |
| Add BZUN to Watchlist: View: Get Complete BZUN Trend Analysis ➞ | |
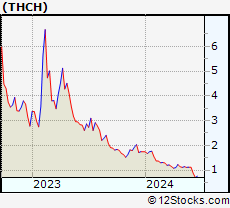 | THCH TH International Limited |
| Sector: Services & Goods | |
| SubSector: Restaurants | |
| MarketCap: 452 Millions | |
| Recent Price: 1.12 Market Intelligence Score: 30 | |
| Day Percent Change: 0.00% Day Change: 0.00 | |
| Week Change: 0% Year-to-date Change: -35.6% | |
| THCH Links: Profile News Message Board | |
| Charts:- Daily , Weekly | |
| Add THCH to Watchlist: View: Get Complete THCH Trend Analysis ➞ | |
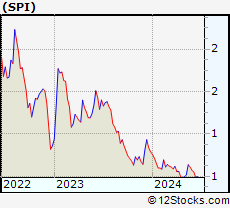 | SPI SPI Energy Co., Ltd. |
| Sector: Technology | |
| SubSector: Semiconductor - Specialized | |
| MarketCap: 12.066 Millions | |
| Recent Price: 0.57 Market Intelligence Score: 30 | |
| Day Percent Change: -2.60% Day Change: -0.02 | |
| Week Change: -6.56% Year-to-date Change: -27.9% | |
| SPI Links: Profile News Message Board | |
| Charts:- Daily , Weekly | |
| Add SPI to Watchlist: View: Get Complete SPI Trend Analysis ➞ | |
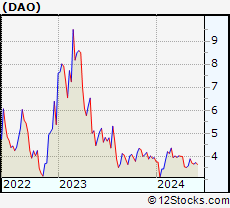 | DAO Youdao, Inc. |
| Sector: Technology | |
| SubSector: Internet Information Providers | |
| MarketCap: 2073.2 Millions | |
| Recent Price: 3.73 Market Intelligence Score: 29 | |
| Day Percent Change: -2.36% Day Change: -0.09 | |
| Week Change: 1.63% Year-to-date Change: -5.3% | |
| DAO Links: Profile News Message Board | |
| Charts:- Daily , Weekly | |
| Add DAO to Watchlist: View: Get Complete DAO Trend Analysis ➞ | |
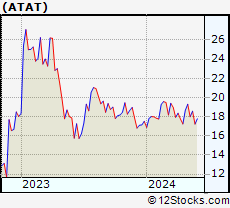 | ATAT Atour Lifestyle Holdings Limited |
| Sector: Services & Goods | |
| SubSector: Lodging | |
| MarketCap: 2120 Millions | |
| Recent Price: 17.81 Market Intelligence Score: 28 | |
| Day Percent Change: 1.08% Day Change: 0.19 | |
| Week Change: 3.37% Year-to-date Change: 1.7% | |
| ATAT Links: Profile News Message Board | |
| Charts:- Daily , Weekly | |
| Add ATAT to Watchlist: View: Get Complete ATAT Trend Analysis ➞ | |
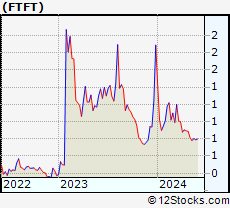 | FTFT Future FinTech Group Inc. |
| Sector: Consumer Staples | |
| SubSector: Beverages - Soft Drinks | |
| MarketCap: 29.472 Millions | |
| Recent Price: 0.80 Market Intelligence Score: 27 | |
| Day Percent Change: 5.10% Day Change: 0.04 | |
| Week Change: 1.28% Year-to-date Change: -57.7% | |
| FTFT Links: Profile News Message Board | |
| Charts:- Daily , Weekly | |
| Add FTFT to Watchlist: View: Get Complete FTFT Trend Analysis ➞ | |
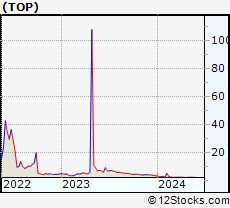 | TOP TOP Financial Group Limited |
| Sector: Financials | |
| SubSector: Capital Markets | |
| MarketCap: 329 Millions | |
| Recent Price: 2.49 Market Intelligence Score: 27 | |
| Day Percent Change: 0.40% Day Change: 0.01 | |
| Week Change: 0% Year-to-date Change: -33.1% | |
| TOP Links: Profile News Message Board | |
| Charts:- Daily , Weekly | |
| Add TOP to Watchlist: View: Get Complete TOP Trend Analysis ➞ | |
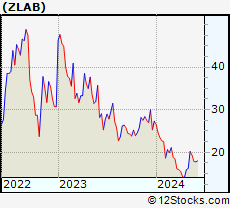 | ZLAB Zai Lab Limited |
| Sector: Health Care | |
| SubSector: Biotechnology | |
| MarketCap: 3970.35 Millions | |
| Recent Price: 17.78 Market Intelligence Score: 27 | |
| Day Percent Change: -2.25% Day Change: -0.41 | |
| Week Change: -0.78% Year-to-date Change: -34.9% | |
| ZLAB Links: Profile News Message Board | |
| Charts:- Daily , Weekly | |
| Add ZLAB to Watchlist: View: Get Complete ZLAB Trend Analysis ➞ | |
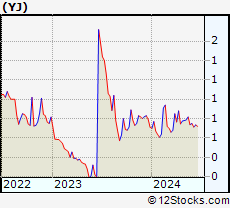 | YJ Yunji Inc. |
| Sector: Services & Goods | |
| SubSector: Specialty Retail, Other | |
| MarketCap: 770.644 Millions | |
| Recent Price: 0.75 Market Intelligence Score: 25 | |
| Day Percent Change: 9.95% Day Change: 0.07 | |
| Week Change: 1.67% Year-to-date Change: 5.5% | |
| YJ Links: Profile News Message Board | |
| Charts:- Daily , Weekly | |
| Add YJ to Watchlist: View: Get Complete YJ Trend Analysis ➞ | |
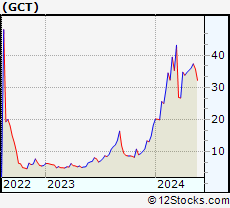 | GCT GigaCloud Technology Inc. |
| Sector: Technology | |
| SubSector: Software - Infrastructure | |
| MarketCap: 240 Millions | |
| Recent Price: 31.14 Market Intelligence Score: 25 | |
| Day Percent Change: 2.87% Day Change: 0.87 | |
| Week Change: -5.55% Year-to-date Change: 70.1% | |
| GCT Links: Profile News Message Board | |
| Charts:- Daily , Weekly | |
| Add GCT to Watchlist: View: Get Complete GCT Trend Analysis ➞ | |
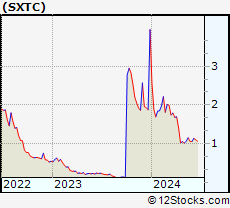 | SXTC China SXT Pharmaceuticals, Inc. |
| Sector: Health Care | |
| SubSector: Drugs - Generic | |
| MarketCap: 18.8185 Millions | |
| Recent Price: 1.05 Market Intelligence Score: 25 | |
| Day Percent Change: -9.45% Day Change: -0.11 | |
| Week Change: -0.91% Year-to-date Change: -73.4% | |
| SXTC Links: Profile News Message Board | |
| Charts:- Daily , Weekly | |
| Add SXTC to Watchlist: View: Get Complete SXTC Trend Analysis ➞ | |
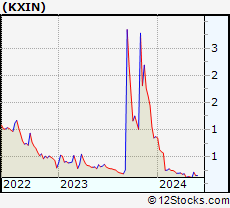 | KXIN Kaixin Auto Holdings |
| Sector: Industrials | |
| SubSector: Conglomerates | |
| MarketCap: 54.6848 Millions | |
| Recent Price: 0.15 Market Intelligence Score: 25 | |
| Day Percent Change: -5.62% Day Change: -0.01 | |
| Week Change: 2.25% Year-to-date Change: -82.3% | |
| KXIN Links: Profile News Message Board | |
| Charts:- Daily , Weekly | |
| Add KXIN to Watchlist: View: Get Complete KXIN Trend Analysis ➞ | |
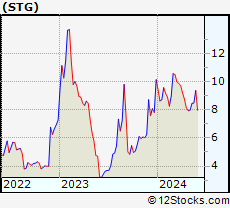 | STG Sunlands Technology Group |
| Sector: Services & Goods | |
| SubSector: Education & Training Services | |
| MarketCap: 295.706 Millions | |
| Recent Price: 7.17 Market Intelligence Score: 25 | |
| Day Percent Change: -4.78% Day Change: -0.36 | |
| Week Change: -23.72% Year-to-date Change: -29.5% | |
| STG Links: Profile News Message Board | |
| Charts:- Daily , Weekly | |
| Add STG to Watchlist: View: Get Complete STG Trend Analysis ➞ | |
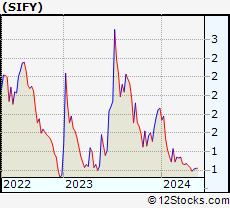 | SIFY Sify Technologies Limited |
| Sector: Technology | |
| SubSector: Internet Service Providers | |
| MarketCap: 159.38 Millions | |
| Recent Price: 1.11 Market Intelligence Score: 25 | |
| Day Percent Change: -34.23% Day Change: -0.57 | |
| Week Change: -25.59% Year-to-date Change: -40.8% | |
| SIFY Links: Profile News Message Board | |
| Charts:- Daily , Weekly | |
| Add SIFY to Watchlist: View: Get Complete SIFY Trend Analysis ➞ | |
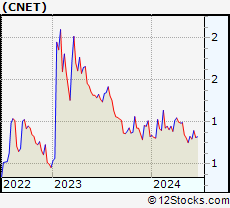 | CNET ChinaNet Online Holdings, Inc. |
| Sector: Services & Goods | |
| SubSector: Advertising Agencies | |
| MarketCap: 14.6 Millions | |
| Recent Price: 0.80 Market Intelligence Score: 25 | |
| Day Percent Change: -2.38% Day Change: -0.02 | |
| Week Change: -3.67% Year-to-date Change: -3.7% | |
| CNET Links: Profile News Message Board | |
| Charts:- Daily , Weekly | |
| Add CNET to Watchlist: View: Get Complete CNET Trend Analysis ➞ | |
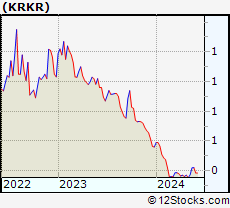 | KRKR 36Kr Holdings Inc. |
| Sector: Technology | |
| SubSector: Internet Information Providers | |
| MarketCap: 173.18 Millions | |
| Recent Price: 0.39 Market Intelligence Score: 25 | |
| Day Percent Change: -1.28% Day Change: -0.01 | |
| Week Change: -8.64% Year-to-date Change: -31.3% | |
| KRKR Links: Profile News Message Board | |
| Charts:- Daily , Weekly | |
| Add KRKR to Watchlist: View: Get Complete KRKR Trend Analysis ➞ | |
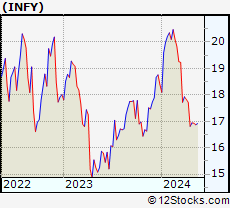 | INFY Infosys Limited |
| Sector: Technology | |
| SubSector: Information Technology Services | |
| MarketCap: 33819.1 Millions | |
| Recent Price: 16.75 Market Intelligence Score: 25 | |
| Day Percent Change: -0.71% Day Change: -0.12 | |
| Week Change: -3.51% Year-to-date Change: -8.9% | |
| INFY Links: Profile News Message Board | |
| Charts:- Daily , Weekly | |
| Add INFY to Watchlist: View: Get Complete INFY Trend Analysis ➞ | |
| To view more stocks, click on Next / Previous arrows or select different range: 0 - 25 , 25 - 50 , 50 - 75 , 75 - 100 , 100 - 125 , 125 - 150 , 150 - 175 , 175 - 200 , 200 - 225 | ||
| Click To Change The Sort Order: By Market Cap or Company Size Performance: Year-to-date, Week and Day | |
| Select Chart Type: | ||
|
Best Stocks Today 12Stocks.com |
© 2024 12Stocks.com Terms & Conditions Privacy Contact Us
All Information Provided Only For Education And Not To Be Used For Investing or Trading. See Terms & Conditions


One More Thing ... Get Best Stocks Delivered Daily!
Never Ever Miss A Move With Our Top Ten Stocks Lists
Find Best Stocks In Any Market - Bull or Bear Market
Take A Peek At Our Top Ten Stocks Lists: Daily, Weekly, Year-to-Date & Top Trends
Find Best Stocks In Any Market - Bull or Bear Market
Take A Peek At Our Top Ten Stocks Lists: Daily, Weekly, Year-to-Date & Top Trends
Asia Stocks With Best Up Trends [0-bearish to 100-bullish]: Boqii Holding[100], X Financial[100], SunCar [100], uCloudlink [100], Xunlei [100], Sumitomo Mitsui[100], Chunghwa Telecom[100], Daqo New[100], Nomura [95], JinkoSolar Holding[95], MOGU [93]
Best Asia Stocks Year-to-Date:
U Power[2896.65%], DouYu [967.37%], Burning Rock[641.01%], China Liberal[498.43%], Yatsen Holding[364.73%], MicroCloud Hologram[317.27%], Uxin [249.49%], Zhihu [244.75%], Zhongchao [242.34%], Cheetah Mobile[163.6%], Smart Share[111.65%] Best Asia Stocks This Week:
Boqii Holding[22.37%], QuantaSing [17.04%], uCloudlink [15.43%], Bright Scholar[14.43%], MOGU [14.42%], NIO [11.59%], Daqo New[10.45%], 21Vianet [8.38%], X Financial[7.93%], JinkoSolar Holding[6.94%], AMTD Digital[6.35%] Best Asia Stocks Daily:
Yunji [9.95%], Boqii Holding[8.78%], AMTD Digital[7.77%], 17 Education[7.09%], X Financial[6.14%], MicroCloud Hologram[5.07%], Zhongchao [5.03%], SunCar [4.97%], Nomura [4.47%], Bright Scholar[3.14%], GigaCloud [2.87%]