
 Login Sign Up


| |||||
 |  | ||||

| 12Stocks.com Market Intelligence |
Best SmallCap Stocks
|
| In a hurry? Small Cap Stock Lists: Performance Trends Table, Stock Charts
Sort Small Cap stocks: Daily, Weekly, Year-to-Date, Market Cap & Trends. Filter Small Cap stocks list by sector: Show all, Tech, Finance, Energy, Staples, Retail, Industrial, Materials, Utilities and HealthCare Filter Small Cap stocks list by size: All Large Medium Small and MicroCap |
| 12Stocks.com Small Cap Stocks Performances & Trends Daily | |||||||||
|
|  The overall Smart Investing & Trading Score is 86 (0-bearish to 100-bullish) which puts Small Cap index in short term bullish trend. The Smart Investing & Trading Score from previous trading session is 48 and hence an improvement of trend.
| ||||||||
Here are the Smart Investing & Trading Scores of the most requested small cap stocks at 12Stocks.com (click stock name for detailed review):
|


| 12Stocks.com: Investing in Smallcap Index with Stocks | |
|
The following table helps investors and traders sort through current performance and trends (as measured by Smart Investing & Trading Score) of various
stocks in the Smallcap Index. Quick View: Move mouse or cursor over stock symbol (ticker) to view short-term technical chart and over stock name to view long term chart. Click on  to add stock symbol to your watchlist and to add stock symbol to your watchlist and  to view watchlist. Click on any ticker or stock name for detailed market intelligence report for that stock. to view watchlist. Click on any ticker or stock name for detailed market intelligence report for that stock. |
12Stocks.com Performance of Stocks in Smallcap Index
| Ticker | Stock Name | Watchlist | Category | Recent Price | Smart Investing & Trading Score | Change % | YTD Change% |
| LUMN | Lumen |   | Technology | 1.29 | 35 | 0.78 | -29.32% |
| WASH | Washington Trust | | Financials | 26.25 | 68 | 0.77 | -18.93% |
| BSRR | Sierra Bancorp | | Financials | 21.02 | 61 | 0.77 | -6.78% |
| XOMA | XOMA | | Health Care | 25.40 | 68 | 0.77 | 37.27% |
| HONE | HarborOne Bancorp | | Financials | 10.41 | 68 | 0.77 | -13.11% |
| BUSE | First Busey | | Financials | 22.61 | 25 | 0.76 | -8.90% |
| IIPR | Innovative Industrial | | Financials | 107.78 | 83 | 0.76 | 6.90% |
| TENB | Tenable | | Technology | 42.19 | 10 | 0.76 | -8.40% |
| PIPR | Piper Sandler | | Financials | 211.78 | 76 | 0.76 | 21.11% |
| ATSG | Air Transport | | Transports | 13.50 | 61 | 0.75 | -23.34% |
| AMPS | Altus Power | | Utilities | 4.05 | 27 | 0.75 | -41.18% |
| YMAB | Y-mAbs | | Health Care | 12.10 | 25 | 0.75 | 77.42% |
| VOR | Vor Biopharma | | Health Care | 1.35 | 0 | 0.75 | -39.19% |
| VZIO | VIZIO Holding | | Technology | 10.74 | 59 | 0.75 | 39.30% |
| SSP | E.W. Scripps | | Services & Goods | 2.72 | 32 | 0.74 | -65.96% |
| TG | Tredegar | | Materials | 5.45 | 60 | 0.74 | 0.74% |
| KELYA | Kelly Services | | Services & Goods | 21.74 | 25 | 0.74 | 0.56% |
| AUPH | Aurinia | | Health Care | 5.42 | 67 | 0.74 | -39.71% |
| PEBO | Peoples Bancorp | | Financials | 29.15 | 51 | 0.73 | -13.66% |
| ASUR | Asure | | Technology | 7.57 | 49 | 0.73 | -20.48% |
| ORGO | Organogenesis | | Health Care | 2.75 | 47 | 0.73 | -32.76% |
| WMK | Weis Markets | | Services & Goods | 65.55 | 83 | 0.72 | 2.49% |
| IMRX | Immuneering | | Health Care | 1.39 | 10 | 0.72 | -81.69% |
| TNYA | Tenaya | | Health Care | 4.21 | 25 | 0.72 | 32.39% |
| CRGY | Crescent Energy | | Energy | 12.60 | 83 | 0.72 | -4.47% |


| Too many stocks? View smallcap stocks filtered by marketcap & sector |
| Marketcap: All SmallCap Stocks (default-no microcap), Large, Mid-Range, Small |
| Smallcap Sector: Tech, Finance, Energy, Staples, Retail, Industrial, Materials, & Medical |
|
Get the most comprehensive stock market coverage daily at 12Stocks.com ➞ Best Stocks Today ➞ Best Stocks Weekly ➞ Best Stocks Year-to-Date ➞ Best Stocks Trends ➞  Best Stocks Today 12Stocks.com Best Nasdaq Stocks ➞ Best S&P 500 Stocks ➞ Best Tech Stocks ➞ Best Biotech Stocks ➞ |
| Detailed Overview of SmallCap Stocks |
| SmallCap Technical Overview, Leaders & Laggards, Top SmallCap ETF Funds & Detailed SmallCap Stocks List, Charts, Trends & More |
| Smallcap: Technical Analysis, Trends & YTD Performance | |
| SmallCap segment as represented by
IWM, an exchange-traded fund [ETF], holds basket of thousands of smallcap stocks from across all major sectors of the US stock market. The smallcap index (contains stocks like Riverbed & Sotheby's) is up by 2.52% and is currently underperforming the overall market by -7.27% year-to-date. Below is a quick view of technical charts and trends: | |
 IWM Weekly Chart |
|
| Long Term Trend: Very Good | |
| Medium Term Trend: Very Good | |
 IWM Daily Chart |
|
| Short Term Trend: Very Good | |
| Overall Trend Score: 86 | |
| YTD Performance: 2.52% | |
| **Trend Scores & Views Are Only For Educational Purposes And Not For Investing | |
| 12Stocks.com: Top Performing Small Cap Index Stocks | ||||||||||||||||||||||||||||||||||||||||||||||||
 The top performing Small Cap Index stocks year to date are
Now, more recently, over last week, the top performing Small Cap Index stocks on the move are


|
||||||||||||||||||||||||||||||||||||||||||||||||
| 12Stocks.com: Investing in Smallcap Index using Exchange Traded Funds | |
|
The following table shows list of key exchange traded funds (ETF) that
help investors track Smallcap index. The following list also includes leveraged ETF funds that track twice or thrice the daily returns of Smallcap indices. Short or inverse ETF funds move in the opposite direction to the index they track and are useful during market pullbacks or during bear markets. Quick View: Move mouse or cursor over ETF symbol (ticker) to view short-term technical chart and over ETF name to view long term chart. Click on ticker or stock name for detailed view. Click on to add stock symbol to your watchlist and to view watchlist. |
12Stocks.com List of ETFs that track Smallcap Index
| Ticker | ETF Name | Watchlist | Recent Price | Smart Investing & Trading Score | Change % | Week % | Year-to-date % |
| IWM | iShares Russell 2000 | | 205.77 | 86 | 0.84 | 0.16 | 2.52% |
| IJR | iShares Core S&P Small-Cap | | 109.65 | 93 | 1.14 | 0.76 | 1.29% |
| IWN | iShares Russell 2000 Value | | 155.88 | 76 | 1.17 | 0.46 | 0.35% |
| IWO | iShares Russell 2000 Growth | | 263.62 | 68 | 0.33 | -0.29 | 4.52% |
| VTWO | Vanguard Russell 2000 ETF | | 82.52 | 51 | -0.08 | -0.66 | 1.75% |
| IJS | iShares S&P Small-Cap 600 Value | | 99.74 | 37 | 0.69 | 0.18 | -3.23% |
| IJT | iShares S&P Small-Cap 600 Growth | | 130.21 | 81 | 0.05 | -0.33 | 4.05% |
| XSLV | PowerShares S&P SmallCap Low Volatil ETF | | 43.66 | 48 | 0.72 | -0.23 | -1.11% |
| SBB | ProShares Short SmallCap600 | | 15.97 | 20 | -0.62 | -0.28 | 0.25% |
| SAA | ProShares Ultra SmallCap600 | | 24.16 | 58 | 0.73 | 0.03 | -3.17% |
| SDD | ProShares UltraShort SmallCap600 | | 18.11 | 17 | -2.53 | -1.36 | -1.72% |
| SMLV | SPDR SSGA US Small Cap Low Volatil ETF | | 110.05 | 55 | 0.89 | -0.16 | -2.2% |
| 12Stocks.com: Charts, Trends, Fundamental Data and Performances of SmallCap Stocks | |
|
We now take in-depth look at all SmallCap stocks including charts, multi-period performances and overall trends (as measured by Smart Investing & Trading Score). One can sort SmallCap stocks (click link to choose) by Daily, Weekly and by Year-to-Date performances. Also, one can sort by size of the company or by market capitalization. |
| Select Your Default Chart Type: | |||||
| |||||
| Click on stock symbol or name for detailed view. Click on to add stock symbol to your watchlist and to view watchlist. Quick View: Move mouse or cursor over "Daily" to quickly view daily technical stock chart and over "Weekly" to view weekly technical stock chart. | |||||

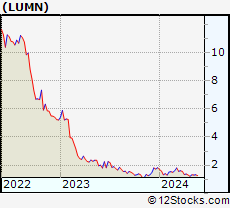 | LUMN Lumen Technologies, Inc. |
| Sector: Technology | |
| SubSector: Telecom Services - Domestic | |
| MarketCap: 1242 Millions | |
| Recent Price: 1.29 Smart Investing & Trading Score: 35 | |
| Day Percent Change: 0.78% Day Change: 0.01 | |
| Week Change: 0% Year-to-date Change: -29.3% | |
| LUMN Links: Profile News Message Board | |
| Charts:- Daily , Weekly | |
| Add LUMN to Watchlist: View: Get Complete LUMN Trend Analysis ➞ | |
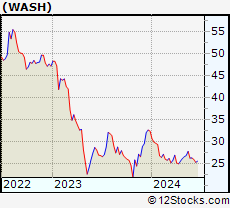 | WASH Washington Trust Bancorp, Inc. |
| Sector: Financials | |
| SubSector: Regional - Northeast Banks | |
| MarketCap: 590.099 Millions | |
| Recent Price: 26.25 Smart Investing & Trading Score: 68 | |
| Day Percent Change: 0.77% Day Change: 0.20 | |
| Week Change: 0.08% Year-to-date Change: -18.9% | |
| WASH Links: Profile News Message Board | |
| Charts:- Daily , Weekly | |
| Add WASH to Watchlist: View: Get Complete WASH Trend Analysis ➞ | |
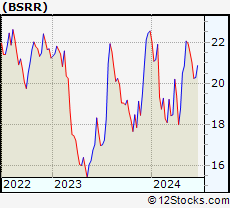 | BSRR Sierra Bancorp |
| Sector: Financials | |
| SubSector: Regional - Pacific Banks | |
| MarketCap: 256.929 Millions | |
| Recent Price: 21.02 Smart Investing & Trading Score: 61 | |
| Day Percent Change: 0.77% Day Change: 0.16 | |
| Week Change: -2.28% Year-to-date Change: -6.8% | |
| BSRR Links: Profile News Message Board | |
| Charts:- Daily , Weekly | |
| Add BSRR to Watchlist: View: Get Complete BSRR Trend Analysis ➞ | |
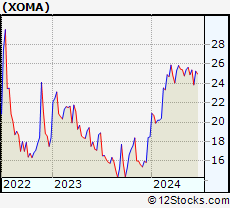 | XOMA XOMA Corporation |
| Sector: Health Care | |
| SubSector: Biotechnology | |
| MarketCap: 174.885 Millions | |
| Recent Price: 25.40 Smart Investing & Trading Score: 68 | |
| Day Percent Change: 0.77% Day Change: 0.20 | |
| Week Change: 1.95% Year-to-date Change: 37.3% | |
| XOMA Links: Profile News Message Board | |
| Charts:- Daily , Weekly | |
| Add XOMA to Watchlist: View: Get Complete XOMA Trend Analysis ➞ | |
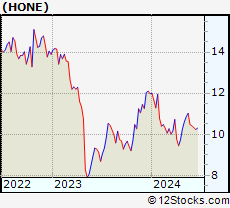 | HONE HarborOne Bancorp, Inc. |
| Sector: Financials | |
| SubSector: Savings & Loans | |
| MarketCap: 456.03 Millions | |
| Recent Price: 10.41 Smart Investing & Trading Score: 68 | |
| Day Percent Change: 0.77% Day Change: 0.08 | |
| Week Change: -0.67% Year-to-date Change: -13.1% | |
| HONE Links: Profile News Message Board | |
| Charts:- Daily , Weekly | |
| Add HONE to Watchlist: View: Get Complete HONE Trend Analysis ➞ | |
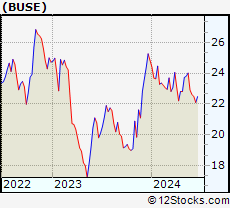 | BUSE First Busey Corporation |
| Sector: Financials | |
| SubSector: Regional - Midwest Banks | |
| MarketCap: 876.97 Millions | |
| Recent Price: 22.61 Smart Investing & Trading Score: 25 | |
| Day Percent Change: 0.76% Day Change: 0.17 | |
| Week Change: -1.31% Year-to-date Change: -8.9% | |
| BUSE Links: Profile News Message Board | |
| Charts:- Daily , Weekly | |
| Add BUSE to Watchlist: View: Get Complete BUSE Trend Analysis ➞ | |
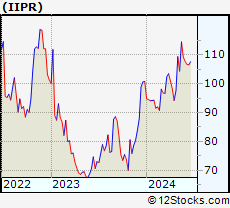 | IIPR Innovative Industrial Properties, Inc. |
| Sector: Financials | |
| SubSector: REIT - Industrial | |
| MarketCap: 1193.29 Millions | |
| Recent Price: 107.78 Smart Investing & Trading Score: 83 | |
| Day Percent Change: 0.76% Day Change: 0.81 | |
| Week Change: -1.37% Year-to-date Change: 6.9% | |
| IIPR Links: Profile News Message Board | |
| Charts:- Daily , Weekly | |
| Add IIPR to Watchlist: View: Get Complete IIPR Trend Analysis ➞ | |
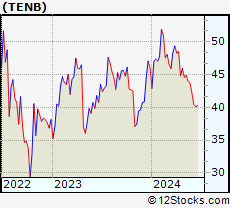 | TENB Tenable Holdings, Inc. |
| Sector: Technology | |
| SubSector: Business Software & Services | |
| MarketCap: 1986.68 Millions | |
| Recent Price: 42.19 Smart Investing & Trading Score: 10 | |
| Day Percent Change: 0.76% Day Change: 0.32 | |
| Week Change: -3.54% Year-to-date Change: -8.4% | |
| TENB Links: Profile News Message Board | |
| Charts:- Daily , Weekly | |
| Add TENB to Watchlist: View: Get Complete TENB Trend Analysis ➞ | |
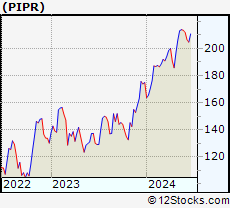 | PIPR Piper Sandler Companies |
| Sector: Financials | |
| SubSector: Asset Management | |
| MarketCap: 759.603 Millions | |
| Recent Price: 211.78 Smart Investing & Trading Score: 76 | |
| Day Percent Change: 0.76% Day Change: 1.59 | |
| Week Change: -0.76% Year-to-date Change: 21.1% | |
| PIPR Links: Profile News Message Board | |
| Charts:- Daily , Weekly | |
| Add PIPR to Watchlist: View: Get Complete PIPR Trend Analysis ➞ | |
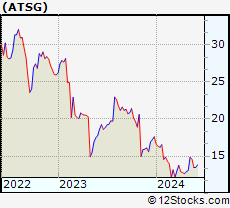 | ATSG Air Transport Services Group, Inc. |
| Sector: Transports | |
| SubSector: Air Delivery & Freight Services | |
| MarketCap: 1111.68 Millions | |
| Recent Price: 13.50 Smart Investing & Trading Score: 61 | |
| Day Percent Change: 0.75% Day Change: 0.10 | |
| Week Change: 0.07% Year-to-date Change: -23.3% | |
| ATSG Links: Profile News Message Board | |
| Charts:- Daily , Weekly | |
| Add ATSG to Watchlist: View: Get Complete ATSG Trend Analysis ➞ | |
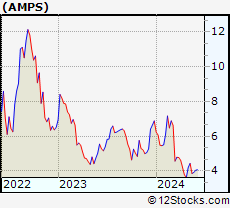 | AMPS Altus Power, Inc. |
| Sector: Utilities | |
| SubSector: Utilities - Renewable | |
| MarketCap: 866 Millions | |
| Recent Price: 4.05 Smart Investing & Trading Score: 27 | |
| Day Percent Change: 0.75% Day Change: 0.03 | |
| Week Change: 3.18% Year-to-date Change: -41.2% | |
| AMPS Links: Profile News Message Board | |
| Charts:- Daily , Weekly | |
| Add AMPS to Watchlist: View: Get Complete AMPS Trend Analysis ➞ | |
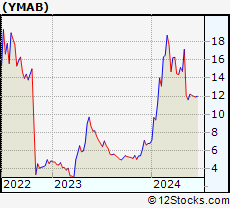 | YMAB Y-mAbs Therapeutics, Inc. |
| Sector: Health Care | |
| SubSector: Biotechnology | |
| MarketCap: 899.585 Millions | |
| Recent Price: 12.10 Smart Investing & Trading Score: 25 | |
| Day Percent Change: 0.75% Day Change: 0.09 | |
| Week Change: -0.98% Year-to-date Change: 77.4% | |
| YMAB Links: Profile News Message Board | |
| Charts:- Daily , Weekly | |
| Add YMAB to Watchlist: View: Get Complete YMAB Trend Analysis ➞ | |
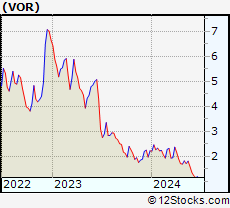 | VOR Vor Biopharma Inc. |
| Sector: Health Care | |
| SubSector: Biotechnology | |
| MarketCap: 224 Millions | |
| Recent Price: 1.35 Smart Investing & Trading Score: 0 | |
| Day Percent Change: 0.75% Day Change: 0.01 | |
| Week Change: -15.09% Year-to-date Change: -39.2% | |
| VOR Links: Profile News Message Board | |
| Charts:- Daily , Weekly | |
| Add VOR to Watchlist: View: Get Complete VOR Trend Analysis ➞ | |
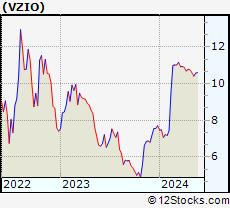 | VZIO VIZIO Holding Corp. |
| Sector: Technology | |
| SubSector: Consumer Electronics | |
| MarketCap: 1300 Millions | |
| Recent Price: 10.74 Smart Investing & Trading Score: 59 | |
| Day Percent Change: 0.75% Day Change: 0.08 | |
| Week Change: 1.32% Year-to-date Change: 39.3% | |
| VZIO Links: Profile News Message Board | |
| Charts:- Daily , Weekly | |
| Add VZIO to Watchlist: View: Get Complete VZIO Trend Analysis ➞ | |
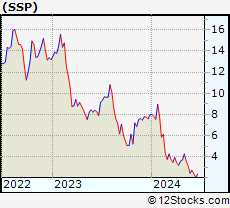 | SSP The E.W. Scripps Company |
| Sector: Services & Goods | |
| SubSector: Broadcasting - TV | |
| MarketCap: 766.163 Millions | |
| Recent Price: 2.72 Smart Investing & Trading Score: 32 | |
| Day Percent Change: 0.74% Day Change: 0.02 | |
| Week Change: 10.79% Year-to-date Change: -66.0% | |
| SSP Links: Profile News Message Board | |
| Charts:- Daily , Weekly | |
| Add SSP to Watchlist: View: Get Complete SSP Trend Analysis ➞ | |
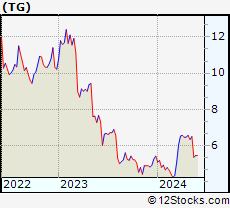 | TG Tredegar Corporation |
| Sector: Materials | |
| SubSector: Specialty Chemicals | |
| MarketCap: 545.057 Millions | |
| Recent Price: 5.45 Smart Investing & Trading Score: 60 | |
| Day Percent Change: 0.74% Day Change: 0.04 | |
| Week Change: 0% Year-to-date Change: 0.7% | |
| TG Links: Profile News Message Board | |
| Charts:- Daily , Weekly | |
| Add TG to Watchlist: View: Get Complete TG Trend Analysis ➞ | |
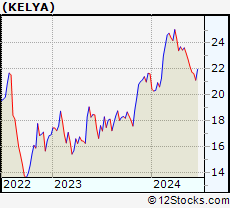 | KELYA Kelly Services, Inc. |
| Sector: Services & Goods | |
| SubSector: Staffing & Outsourcing Services | |
| MarketCap: 587.228 Millions | |
| Recent Price: 21.74 Smart Investing & Trading Score: 25 | |
| Day Percent Change: 0.74% Day Change: 0.16 | |
| Week Change: -1.98% Year-to-date Change: 0.6% | |
| KELYA Links: Profile News Message Board | |
| Charts:- Daily , Weekly | |
| Add KELYA to Watchlist: View: Get Complete KELYA Trend Analysis ➞ | |
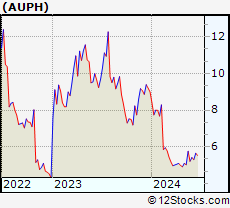 | AUPH Aurinia Pharmaceuticals Inc. |
| Sector: Health Care | |
| SubSector: Biotechnology | |
| MarketCap: 1319.75 Millions | |
| Recent Price: 5.42 Smart Investing & Trading Score: 67 | |
| Day Percent Change: 0.74% Day Change: 0.04 | |
| Week Change: 4.03% Year-to-date Change: -39.7% | |
| AUPH Links: Profile News Message Board | |
| Charts:- Daily , Weekly | |
| Add AUPH to Watchlist: View: Get Complete AUPH Trend Analysis ➞ | |
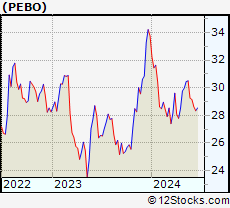 | PEBO Peoples Bancorp Inc. |
| Sector: Financials | |
| SubSector: Regional - Midwest Banks | |
| MarketCap: 449.77 Millions | |
| Recent Price: 29.15 Smart Investing & Trading Score: 51 | |
| Day Percent Change: 0.73% Day Change: 0.21 | |
| Week Change: -0.34% Year-to-date Change: -13.7% | |
| PEBO Links: Profile News Message Board | |
| Charts:- Daily , Weekly | |
| Add PEBO to Watchlist: View: Get Complete PEBO Trend Analysis ➞ | |
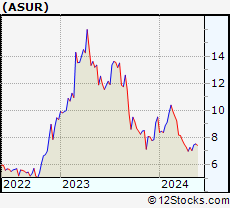 | ASUR Asure Software, Inc. |
| Sector: Technology | |
| SubSector: Business Software & Services | |
| MarketCap: 103.758 Millions | |
| Recent Price: 7.57 Smart Investing & Trading Score: 49 | |
| Day Percent Change: 0.73% Day Change: 0.06 | |
| Week Change: 0.4% Year-to-date Change: -20.5% | |
| ASUR Links: Profile News Message Board | |
| Charts:- Daily , Weekly | |
| Add ASUR to Watchlist: View: Get Complete ASUR Trend Analysis ➞ | |
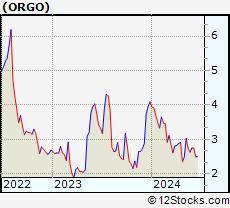 | ORGO Organogenesis Holdings Inc. |
| Sector: Health Care | |
| SubSector: Drugs - Generic | |
| MarketCap: 239.685 Millions | |
| Recent Price: 2.75 Smart Investing & Trading Score: 47 | |
| Day Percent Change: 0.73% Day Change: 0.02 | |
| Week Change: 4.56% Year-to-date Change: -32.8% | |
| ORGO Links: Profile News Message Board | |
| Charts:- Daily , Weekly | |
| Add ORGO to Watchlist: View: Get Complete ORGO Trend Analysis ➞ | |
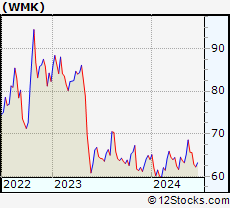 | WMK Weis Markets, Inc. |
| Sector: Services & Goods | |
| SubSector: Grocery Stores | |
| MarketCap: 1148.75 Millions | |
| Recent Price: 65.55 Smart Investing & Trading Score: 83 | |
| Day Percent Change: 0.72% Day Change: 0.47 | |
| Week Change: -0.18% Year-to-date Change: 2.5% | |
| WMK Links: Profile News Message Board | |
| Charts:- Daily , Weekly | |
| Add WMK to Watchlist: View: Get Complete WMK Trend Analysis ➞ | |
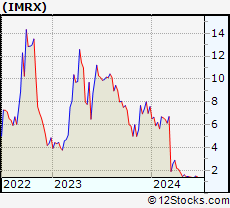 | IMRX Immuneering Corporation |
| Sector: Health Care | |
| SubSector: Biotechnology | |
| MarketCap: 303 Millions | |
| Recent Price: 1.39 Smart Investing & Trading Score: 10 | |
| Day Percent Change: 0.72% Day Change: 0.01 | |
| Week Change: -2.11% Year-to-date Change: -81.7% | |
| IMRX Links: Profile News Message Board | |
| Charts:- Daily , Weekly | |
| Add IMRX to Watchlist: View: Get Complete IMRX Trend Analysis ➞ | |
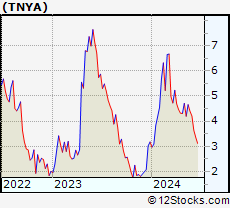 | TNYA Tenaya Therapeutics, Inc. |
| Sector: Health Care | |
| SubSector: Biotechnology | |
| MarketCap: 395 Millions | |
| Recent Price: 4.21 Smart Investing & Trading Score: 25 | |
| Day Percent Change: 0.72% Day Change: 0.03 | |
| Week Change: -4.21% Year-to-date Change: 32.4% | |
| TNYA Links: Profile News Message Board | |
| Charts:- Daily , Weekly | |
| Add TNYA to Watchlist: View: Get Complete TNYA Trend Analysis ➞ | |
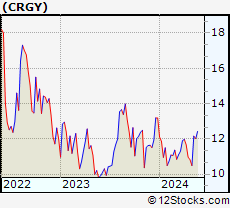 | CRGY Crescent Energy Company |
| Sector: Energy | |
| SubSector: Oil & Gas E&P | |
| MarketCap: 1700 Millions | |
| Recent Price: 12.60 Smart Investing & Trading Score: 83 | |
| Day Percent Change: 0.72% Day Change: 0.09 | |
| Week Change: 1.37% Year-to-date Change: -4.5% | |
| CRGY Links: Profile News Message Board | |
| Charts:- Daily , Weekly | |
| Add CRGY to Watchlist: View: Get Complete CRGY Trend Analysis ➞ | |
| Too many stocks? View smallcap stocks filtered by marketcap & sector |
| Marketcap: All SmallCap Stocks (default-no microcap), Large, Mid-Range, Small & MicroCap |
| Sector: Tech, Finance, Energy, Staples, Retail, Industrial, Materials, Utilities & Medical |
|
Best Stocks Today 12Stocks.com |
© 2024 12Stocks.com Terms & Conditions Privacy Contact Us
All Information Provided Only For Education And Not To Be Used For Investing or Trading. See Terms & Conditions


One More Thing ... Get Best Stocks Delivered Daily!
Never Ever Miss A Move With Our Top Ten Stocks Lists
Find Best Stocks In Any Market - Bull or Bear Market
Take A Peek At Our Top Ten Stocks Lists: Daily, Weekly, Year-to-Date & Top Trends
Find Best Stocks In Any Market - Bull or Bear Market
Take A Peek At Our Top Ten Stocks Lists: Daily, Weekly, Year-to-Date & Top Trends
Smallcap Stocks With Best Up Trends [0-bearish to 100-bullish]: Ambarella [100], TPI Composites[100], Hallador Energy[100], Aaron s[100], Sportsman s[100], Heron [100], Federal Signal[100], Newpark Resources[100], Infinera [100], CONSOL Energy[100], Clean Energy[100]
Best Smallcap Stocks Year-to-Date:
CareMax [504.12%], Janux [397.91%], Viking [234.74%], Summit [232.76%], Novavax [213.13%], Longboard [208.84%], Avidity Biosciences[197.12%], Stoke [177.95%], Super Micro[175.98%], Sweetgreen [172.12%], NuScale Power[170.7%] Best Smallcap Stocks This Week:
Summit [156.95%], Insmed [150.23%], Forward Air[36.25%], Ikena Oncology[35.11%], Orchestra BioMed[32%], Credo [30.55%], Arcturus [27.58%], Semler Scientific[25.94%], Hallador Energy[25.72%], Foot Locker[25.65%], CommScope Holding[24.14%] Best Smallcap Stocks Daily:
Ambarella [20.60%], Eyenovia [13.48%], Accuray [12.74%], Slair Broadcast[12.08%], TPI Composites[12.07%], Akoustis [12.04%], Emergent BioSolutions[11.98%], Hallador Energy[11.29%], Aaron s[9.99%], Cogint [9.88%], Trinseo S.A[9.43%]