
 Login Sign Up


| |||||
 |  | ||||

| 12Stocks.com Market Intelligence |
Best SmallCap Stocks
|
| In a hurry? Small Cap Stock Lists: Performance Trends Table, Stock Charts
Sort Small Cap stocks: Daily, Weekly, Year-to-Date, Market Cap & Trends. Filter Small Cap stocks list by sector: Show all, Tech, Finance, Energy, Staples, Retail, Industrial, Materials, Utilities and HealthCare Filter Small Cap stocks list by size: All Large Medium Small and MicroCap |
| 12Stocks.com Small Cap Stocks Performances & Trends Daily | |||||||||
|
|  The overall Smart Investing & Trading Score is 86 (0-bearish to 100-bullish) which puts Small Cap index in short term bullish trend. The Smart Investing & Trading Score from previous trading session is 48 and hence an improvement of trend.
| ||||||||
Here are the Smart Investing & Trading Scores of the most requested small cap stocks at 12Stocks.com (click stock name for detailed review):
|


| 12Stocks.com: Investing in Smallcap Index with Stocks | |
|
The following table helps investors and traders sort through current performance and trends (as measured by Smart Investing & Trading Score) of various
stocks in the Smallcap Index. Quick View: Move mouse or cursor over stock symbol (ticker) to view short-term technical chart and over stock name to view long term chart. Click on  to add stock symbol to your watchlist and to add stock symbol to your watchlist and  to view watchlist. Click on any ticker or stock name for detailed market intelligence report for that stock. to view watchlist. Click on any ticker or stock name for detailed market intelligence report for that stock. |
12Stocks.com Performance of Stocks in Smallcap Index
| Ticker | Stock Name | Watchlist | Category | Recent Price | Smart Investing & Trading Score | Change % | YTD Change% |
| GBIO | Generation Bio |   | Health Care | 3.18 | 83 | -2.15 | 92.73% |
| SRI | Stoneridge | | Consumer Staples | 15.87 | 25 | -2.16 | -18.91% |
| CLPT | ClearPoint Neuro | | Health Care | 5.43 | 10 | -2.16 | -20.32% |
| DM | Dominion Midstream | | Energy | 0.56 | 25 | -2.17 | -24.94% |
| AHCO | AdaptHealth | | Health Care | 9.48 | 10 | -2.17 | 30.04% |
| ALTG | Alta Equipment | | Transports | 8.44 | 10 | -2.20 | -31.77% |
| SLDP | Solid Power | | Industrials | 1.77 | 53 | -2.21 | 24.21% |
| ZURA | Zura Bio | | Health Care | 5.25 | 56 | -2.23 | 12.06% |
| PCT | PureCycle | | Industrials | 5.19 | 47 | -2.26 | 27.99% |
| CIX | CompX | | Services & Goods | 24.09 | 38 | -2.27 | -4.71% |
| CXM | Sprinklr | | Technology | 11.21 | 0 | -2.27 | -7.24% |
| FORR | Forrester Research | | Services & Goods | 17.99 | 30 | -2.28 | -32.90% |
| PRIM | Primoris Services | | Industrials | 54.76 | 76 | -2.30 | 64.89% |
| ME | 23andMe Holding | | Health Care | 0.55 | 45 | -2.33 | -38.84% |
| TPC | Tutor Perini | | Industrials | 22.06 | 90 | -2.35 | 142.42% |
| CRMT | America s | | Services & Goods | 60.27 | 35 | -2.35 | -20.46% |
| FIX | Comfort Systems | | Industrials | 327.34 | 53 | -2.35 | 59.16% |
| FRSH | Freshworks | | Technology | 12.86 | 41 | -2.35 | -45.25% |
| CVNA | Carvana Co | | Services & Goods | 99.98 | 36 | -2.35 | 88.86% |
| DY | Dycom Industries | | Industrials | 179.96 | 83 | -2.37 | 56.36% |
| ITOS | iTeos | | Health Care | 16.74 | 61 | -2.39 | 53.02% |
| EVGO | EVgo | | Services & Goods | 2.03 | 35 | -2.40 | -43.38% |
| STRO | Sutro Biopharma | | Health Care | 4.22 | 45 | -2.42 | -1.52% |
| AXGN | AxoGen | | Health Care | 6.83 | 59 | -2.43 | 0.00% |
| DAWN | Day One | | Health Care | 13.27 | 10 | -2.43 | -9.67% |


| Too many stocks? View smallcap stocks filtered by marketcap & sector |
| Marketcap: All SmallCap Stocks (default-no microcap), Large, Mid-Range, Small |
| Smallcap Sector: Tech, Finance, Energy, Staples, Retail, Industrial, Materials, & Medical |
|
Get the most comprehensive stock market coverage daily at 12Stocks.com ➞ Best Stocks Today ➞ Best Stocks Weekly ➞ Best Stocks Year-to-Date ➞ Best Stocks Trends ➞  Best Stocks Today 12Stocks.com Best Nasdaq Stocks ➞ Best S&P 500 Stocks ➞ Best Tech Stocks ➞ Best Biotech Stocks ➞ |
| Detailed Overview of SmallCap Stocks |
| SmallCap Technical Overview, Leaders & Laggards, Top SmallCap ETF Funds & Detailed SmallCap Stocks List, Charts, Trends & More |
| Smallcap: Technical Analysis, Trends & YTD Performance | |
| SmallCap segment as represented by
IWM, an exchange-traded fund [ETF], holds basket of thousands of smallcap stocks from across all major sectors of the US stock market. The smallcap index (contains stocks like Riverbed & Sotheby's) is up by 2.52% and is currently underperforming the overall market by -7.27% year-to-date. Below is a quick view of technical charts and trends: | |
 IWM Weekly Chart |
|
| Long Term Trend: Very Good | |
| Medium Term Trend: Very Good | |
 IWM Daily Chart |
|
| Short Term Trend: Very Good | |
| Overall Trend Score: 86 | |
| YTD Performance: 2.52% | |
| **Trend Scores & Views Are Only For Educational Purposes And Not For Investing | |
| 12Stocks.com: Top Performing Small Cap Index Stocks | ||||||||||||||||||||||||||||||||||||||||||||||||
 The top performing Small Cap Index stocks year to date are
Now, more recently, over last week, the top performing Small Cap Index stocks on the move are


|
||||||||||||||||||||||||||||||||||||||||||||||||
| 12Stocks.com: Investing in Smallcap Index using Exchange Traded Funds | |
|
The following table shows list of key exchange traded funds (ETF) that
help investors track Smallcap index. The following list also includes leveraged ETF funds that track twice or thrice the daily returns of Smallcap indices. Short or inverse ETF funds move in the opposite direction to the index they track and are useful during market pullbacks or during bear markets. Quick View: Move mouse or cursor over ETF symbol (ticker) to view short-term technical chart and over ETF name to view long term chart. Click on ticker or stock name for detailed view. Click on to add stock symbol to your watchlist and to view watchlist. |
12Stocks.com List of ETFs that track Smallcap Index
| Ticker | ETF Name | Watchlist | Recent Price | Smart Investing & Trading Score | Change % | Week % | Year-to-date % |
| IWM | iShares Russell 2000 | | 205.77 | 86 | 0.84 | 0.16 | 2.52% |
| IJR | iShares Core S&P Small-Cap | | 109.65 | 93 | 1.14 | 0.76 | 1.29% |
| IWN | iShares Russell 2000 Value | | 155.88 | 76 | 1.17 | 0.46 | 0.35% |
| IWO | iShares Russell 2000 Growth | | 263.62 | 68 | 0.33 | -0.29 | 4.52% |
| VTWO | Vanguard Russell 2000 ETF | | 82.52 | 51 | -0.08 | -0.66 | 1.75% |
| IJS | iShares S&P Small-Cap 600 Value | | 99.74 | 37 | 0.69 | 0.18 | -3.23% |
| IJT | iShares S&P Small-Cap 600 Growth | | 130.21 | 81 | 0.05 | -0.33 | 4.05% |
| XSLV | PowerShares S&P SmallCap Low Volatil ETF | | 43.66 | 48 | 0.72 | -0.23 | -1.11% |
| SBB | ProShares Short SmallCap600 | | 15.97 | 20 | -0.62 | -0.28 | 0.25% |
| SAA | ProShares Ultra SmallCap600 | | 24.16 | 58 | 0.73 | 0.03 | -3.17% |
| SDD | ProShares UltraShort SmallCap600 | | 18.11 | 17 | -2.53 | -1.36 | -1.72% |
| SMLV | SPDR SSGA US Small Cap Low Volatil ETF | | 110.05 | 55 | 0.89 | -0.16 | -2.2% |
| 12Stocks.com: Charts, Trends, Fundamental Data and Performances of SmallCap Stocks | |
|
We now take in-depth look at all SmallCap stocks including charts, multi-period performances and overall trends (as measured by Smart Investing & Trading Score). One can sort SmallCap stocks (click link to choose) by Daily, Weekly and by Year-to-Date performances. Also, one can sort by size of the company or by market capitalization. |
| Select Your Default Chart Type: | |||||
| |||||
| Click on stock symbol or name for detailed view. Click on to add stock symbol to your watchlist and to view watchlist. Quick View: Move mouse or cursor over "Daily" to quickly view daily technical stock chart and over "Weekly" to view weekly technical stock chart. | |||||

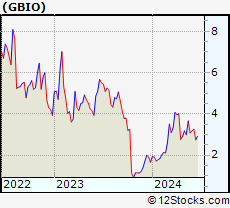 | GBIO Generation Bio Co. |
| Sector: Health Care | |
| SubSector: Biotechnology | |
| MarketCap: 17487 Millions | |
| Recent Price: 3.18 Smart Investing & Trading Score: 83 | |
| Day Percent Change: -2.15% Day Change: -0.07 | |
| Week Change: 3.41% Year-to-date Change: 92.7% | |
| GBIO Links: Profile News Message Board | |
| Charts:- Daily , Weekly | |
| Add GBIO to Watchlist: View: Get Complete GBIO Trend Analysis ➞ | |
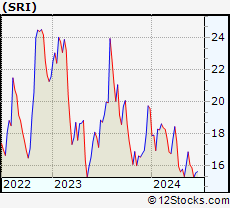 | SRI Stoneridge, Inc. |
| Sector: Consumer Staples | |
| SubSector: Auto Parts | |
| MarketCap: 451.839 Millions | |
| Recent Price: 15.87 Smart Investing & Trading Score: 25 | |
| Day Percent Change: -2.16% Day Change: -0.35 | |
| Week Change: -1.06% Year-to-date Change: -18.9% | |
| SRI Links: Profile News Message Board | |
| Charts:- Daily , Weekly | |
| Add SRI to Watchlist: View: Get Complete SRI Trend Analysis ➞ | |
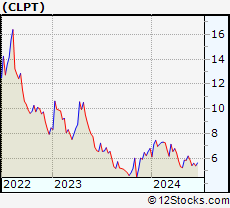 | CLPT ClearPoint Neuro, Inc. |
| Sector: Health Care | |
| SubSector: Medical Appliances & Equipment | |
| MarketCap: 55.108 Millions | |
| Recent Price: 5.43 Smart Investing & Trading Score: 10 | |
| Day Percent Change: -2.16% Day Change: -0.12 | |
| Week Change: -7.81% Year-to-date Change: -20.3% | |
| CLPT Links: Profile News Message Board | |
| Charts:- Daily , Weekly | |
| Add CLPT to Watchlist: View: Get Complete CLPT Trend Analysis ➞ | |
 | DM Dominion Midstream Partners, LP |
| Sector: Energy | |
| SubSector: Oil & Gas Pipelines | |
| MarketCap: 3017.01 Millions | |
| Recent Price: 0.56 Smart Investing & Trading Score: 25 | |
| Day Percent Change: -2.17% Day Change: -0.01 | |
| Week Change: -0.37% Year-to-date Change: -24.9% | |
| DM Links: Profile News Message Board | |
| Charts:- Daily , Weekly | |
| Add DM to Watchlist: View: Get Complete DM Trend Analysis ➞ | |
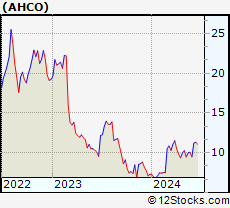 | AHCO AdaptHealth Corp. |
| Sector: Health Care | |
| SubSector: Medical Appliances & Equipment | |
| MarketCap: 1084.8 Millions | |
| Recent Price: 9.48 Smart Investing & Trading Score: 10 | |
| Day Percent Change: -2.17% Day Change: -0.21 | |
| Week Change: -5.86% Year-to-date Change: 30.0% | |
| AHCO Links: Profile News Message Board | |
| Charts:- Daily , Weekly | |
| Add AHCO to Watchlist: View: Get Complete AHCO Trend Analysis ➞ | |
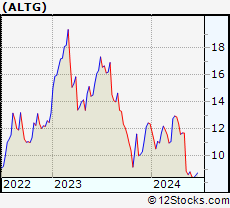 | ALTG Alta Equipment Group Inc. |
| Sector: Transports | |
| SubSector: Rental & Leasing Services | |
| MarketCap: 86.9044 Millions | |
| Recent Price: 8.44 Smart Investing & Trading Score: 10 | |
| Day Percent Change: -2.20% Day Change: -0.19 | |
| Week Change: -4.2% Year-to-date Change: -31.8% | |
| ALTG Links: Profile News Message Board | |
| Charts:- Daily , Weekly | |
| Add ALTG to Watchlist: View: Get Complete ALTG Trend Analysis ➞ | |
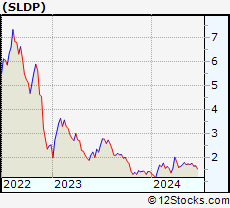 | SLDP Solid Power, Inc. |
| Sector: Industrials | |
| SubSector: Electrical Equipment & Parts | |
| MarketCap: 445 Millions | |
| Recent Price: 1.77 Smart Investing & Trading Score: 53 | |
| Day Percent Change: -2.21% Day Change: -0.04 | |
| Week Change: 2.61% Year-to-date Change: 24.2% | |
| SLDP Links: Profile News Message Board | |
| Charts:- Daily , Weekly | |
| Add SLDP to Watchlist: View: Get Complete SLDP Trend Analysis ➞ | |
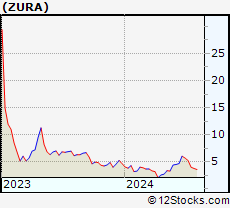 | ZURA Zura Bio Limited |
| Sector: Health Care | |
| SubSector: Biotechnology | |
| MarketCap: 242 Millions | |
| Recent Price: 5.25 Smart Investing & Trading Score: 56 | |
| Day Percent Change: -2.23% Day Change: -0.12 | |
| Week Change: -7.89% Year-to-date Change: 12.1% | |
| ZURA Links: Profile News Message Board | |
| Charts:- Daily , Weekly | |
| Add ZURA to Watchlist: View: Get Complete ZURA Trend Analysis ➞ | |
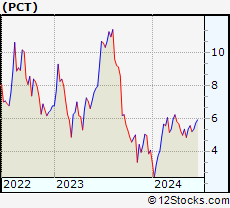 | PCT PureCycle Technologies, Inc. |
| Sector: Industrials | |
| SubSector: Pollution & Treatment Controls | |
| MarketCap: 1610 Millions | |
| Recent Price: 5.19 Smart Investing & Trading Score: 47 | |
| Day Percent Change: -2.26% Day Change: -0.12 | |
| Week Change: -6.57% Year-to-date Change: 28.0% | |
| PCT Links: Profile News Message Board | |
| Charts:- Daily , Weekly | |
| Add PCT to Watchlist: View: Get Complete PCT Trend Analysis ➞ | |
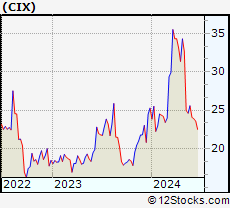 | CIX CompX International Inc. |
| Sector: Services & Goods | |
| SubSector: Security & Protection Services | |
| MarketCap: 189.603 Millions | |
| Recent Price: 24.09 Smart Investing & Trading Score: 38 | |
| Day Percent Change: -2.27% Day Change: -0.56 | |
| Week Change: -5.82% Year-to-date Change: -4.7% | |
| CIX Links: Profile News Message Board | |
| Charts:- Daily , Weekly | |
| Add CIX to Watchlist: View: Get Complete CIX Trend Analysis ➞ | |
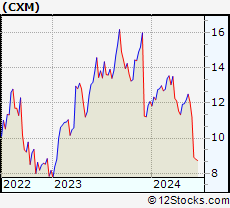 | CXM Sprinklr, Inc. |
| Sector: Technology | |
| SubSector: Software - Application | |
| MarketCap: 3700 Millions | |
| Recent Price: 11.21 Smart Investing & Trading Score: 0 | |
| Day Percent Change: -2.27% Day Change: -0.26 | |
| Week Change: -7.05% Year-to-date Change: -7.2% | |
| CXM Links: Profile News Message Board | |
| Charts:- Daily , Weekly | |
| Add CXM to Watchlist: View: Get Complete CXM Trend Analysis ➞ | |
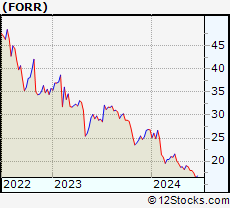 | FORR Forrester Research, Inc. |
| Sector: Services & Goods | |
| SubSector: Research Services | |
| MarketCap: 473.394 Millions | |
| Recent Price: 17.99 Smart Investing & Trading Score: 30 | |
| Day Percent Change: -2.28% Day Change: -0.42 | |
| Week Change: -0.28% Year-to-date Change: -32.9% | |
| FORR Links: Profile News Message Board | |
| Charts:- Daily , Weekly | |
| Add FORR to Watchlist: View: Get Complete FORR Trend Analysis ➞ | |
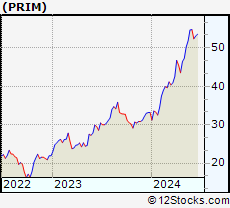 | PRIM Primoris Services Corporation |
| Sector: Industrials | |
| SubSector: Heavy Construction | |
| MarketCap: 931.895 Millions | |
| Recent Price: 54.76 Smart Investing & Trading Score: 76 | |
| Day Percent Change: -2.30% Day Change: -1.29 | |
| Week Change: 0.16% Year-to-date Change: 64.9% | |
| PRIM Links: Profile News Message Board | |
| Charts:- Daily , Weekly | |
| Add PRIM to Watchlist: View: Get Complete PRIM Trend Analysis ➞ | |
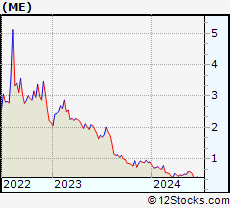 | ME 23andMe Holding Co. |
| Sector: Health Care | |
| SubSector: Diagnostics & Research | |
| MarketCap: 802 Millions | |
| Recent Price: 0.55 Smart Investing & Trading Score: 45 | |
| Day Percent Change: -2.33% Day Change: -0.01 | |
| Week Change: -6.82% Year-to-date Change: -38.8% | |
| ME Links: Profile News Message Board | |
| Charts:- Daily , Weekly | |
| Add ME to Watchlist: View: Get Complete ME Trend Analysis ➞ | |
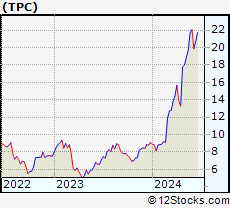 | TPC Tutor Perini Corporation |
| Sector: Industrials | |
| SubSector: Heavy Construction | |
| MarketCap: 382.595 Millions | |
| Recent Price: 22.06 Smart Investing & Trading Score: 90 | |
| Day Percent Change: -2.35% Day Change: -0.53 | |
| Week Change: 1.8% Year-to-date Change: 142.4% | |
| TPC Links: Profile News Message Board | |
| Charts:- Daily , Weekly | |
| Add TPC to Watchlist: View: Get Complete TPC Trend Analysis ➞ | |
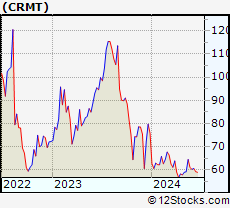 | CRMT America s Car-Mart, Inc. |
| Sector: Services & Goods | |
| SubSector: Auto Dealerships | |
| MarketCap: 329.921 Millions | |
| Recent Price: 60.27 Smart Investing & Trading Score: 35 | |
| Day Percent Change: -2.35% Day Change: -1.45 | |
| Week Change: -1.26% Year-to-date Change: -20.5% | |
| CRMT Links: Profile News Message Board | |
| Charts:- Daily , Weekly | |
| Add CRMT to Watchlist: View: Get Complete CRMT Trend Analysis ➞ | |
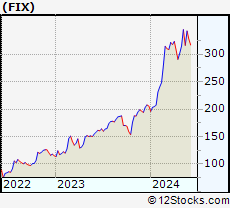 | FIX Comfort Systems USA, Inc. |
| Sector: Industrials | |
| SubSector: General Contractors | |
| MarketCap: 1440.63 Millions | |
| Recent Price: 327.34 Smart Investing & Trading Score: 53 | |
| Day Percent Change: -2.35% Day Change: -7.88 | |
| Week Change: -4.38% Year-to-date Change: 59.2% | |
| FIX Links: Profile News Message Board | |
| Charts:- Daily , Weekly | |
| Add FIX to Watchlist: View: Get Complete FIX Trend Analysis ➞ | |
 | FRSH Freshworks Inc. |
| Sector: Technology | |
| SubSector: Software - Application | |
| MarketCap: 5000 Millions | |
| Recent Price: 12.86 Smart Investing & Trading Score: 41 | |
| Day Percent Change: -2.35% Day Change: -0.31 | |
| Week Change: -2.87% Year-to-date Change: -45.3% | |
| FRSH Links: Profile News Message Board | |
| Charts:- Daily , Weekly | |
| Add FRSH to Watchlist: View: Get Complete FRSH Trend Analysis ➞ | |
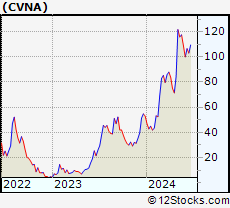 | CVNA Carvana Co. |
| Sector: Services & Goods | |
| SubSector: Auto Dealerships | |
| MarketCap: 5585.31 Millions | |
| Recent Price: 99.98 Smart Investing & Trading Score: 36 | |
| Day Percent Change: -2.35% Day Change: -2.41 | |
| Week Change: -8.4% Year-to-date Change: 88.9% | |
| CVNA Links: Profile News Message Board | |
| Charts:- Daily , Weekly | |
| Add CVNA to Watchlist: View: Get Complete CVNA Trend Analysis ➞ | |
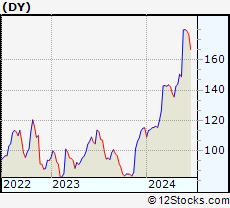 | DY Dycom Industries, Inc. |
| Sector: Industrials | |
| SubSector: Heavy Construction | |
| MarketCap: 576.295 Millions | |
| Recent Price: 179.96 Smart Investing & Trading Score: 83 | |
| Day Percent Change: -2.37% Day Change: -4.37 | |
| Week Change: 0.13% Year-to-date Change: 56.4% | |
| DY Links: Profile News Message Board | |
| Charts:- Daily , Weekly | |
| Add DY to Watchlist: View: Get Complete DY Trend Analysis ➞ | |
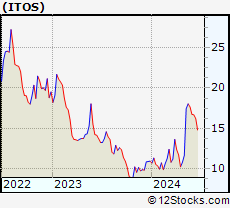 | ITOS iTeos Therapeutics, Inc. |
| Sector: Health Care | |
| SubSector: Biotechnology | |
| MarketCap: 10487 Millions | |
| Recent Price: 16.74 Smart Investing & Trading Score: 61 | |
| Day Percent Change: -2.39% Day Change: -0.41 | |
| Week Change: -5.32% Year-to-date Change: 53.0% | |
| ITOS Links: Profile News Message Board | |
| Charts:- Daily , Weekly | |
| Add ITOS to Watchlist: View: Get Complete ITOS Trend Analysis ➞ | |
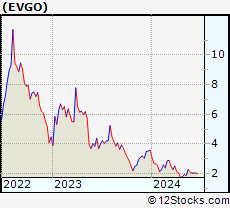 | EVGO EVgo, Inc. |
| Sector: Services & Goods | |
| SubSector: Specialty Retail | |
| MarketCap: 1140 Millions | |
| Recent Price: 2.03 Smart Investing & Trading Score: 35 | |
| Day Percent Change: -2.40% Day Change: -0.05 | |
| Week Change: -4.69% Year-to-date Change: -43.4% | |
| EVGO Links: Profile News Message Board | |
| Charts:- Daily , Weekly | |
| Add EVGO to Watchlist: View: Get Complete EVGO Trend Analysis ➞ | |
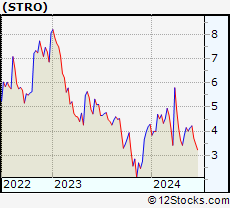 | STRO Sutro Biopharma, Inc. |
| Sector: Health Care | |
| SubSector: Biotechnology | |
| MarketCap: 196.485 Millions | |
| Recent Price: 4.22 Smart Investing & Trading Score: 45 | |
| Day Percent Change: -2.42% Day Change: -0.11 | |
| Week Change: 2.05% Year-to-date Change: -1.5% | |
| STRO Links: Profile News Message Board | |
| Charts:- Daily , Weekly | |
| Add STRO to Watchlist: View: Get Complete STRO Trend Analysis ➞ | |
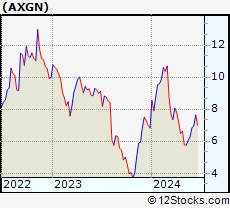 | AXGN AxoGen, Inc. |
| Sector: Health Care | |
| SubSector: Medical Appliances & Equipment | |
| MarketCap: 349.28 Millions | |
| Recent Price: 6.83 Smart Investing & Trading Score: 59 | |
| Day Percent Change: -2.43% Day Change: -0.17 | |
| Week Change: 8.93% Year-to-date Change: 0.0% | |
| AXGN Links: Profile News Message Board | |
| Charts:- Daily , Weekly | |
| Add AXGN to Watchlist: View: Get Complete AXGN Trend Analysis ➞ | |
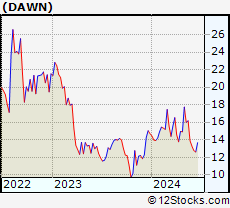 | DAWN Day One Biopharmaceuticals, Inc. |
| Sector: Health Care | |
| SubSector: Biotechnology | |
| MarketCap: 1040 Millions | |
| Recent Price: 13.27 Smart Investing & Trading Score: 10 | |
| Day Percent Change: -2.43% Day Change: -0.33 | |
| Week Change: -4.53% Year-to-date Change: -9.7% | |
| DAWN Links: Profile News Message Board | |
| Charts:- Daily , Weekly | |
| Add DAWN to Watchlist: View: Get Complete DAWN Trend Analysis ➞ | |
| Too many stocks? View smallcap stocks filtered by marketcap & sector |
| Marketcap: All SmallCap Stocks (default-no microcap), Large, Mid-Range, Small & MicroCap |
| Sector: Tech, Finance, Energy, Staples, Retail, Industrial, Materials, Utilities & Medical |
|
Best Stocks Today 12Stocks.com |
© 2024 12Stocks.com Terms & Conditions Privacy Contact Us
All Information Provided Only For Education And Not To Be Used For Investing or Trading. See Terms & Conditions


One More Thing ... Get Best Stocks Delivered Daily!
Never Ever Miss A Move With Our Top Ten Stocks Lists
Find Best Stocks In Any Market - Bull or Bear Market
Take A Peek At Our Top Ten Stocks Lists: Daily, Weekly, Year-to-Date & Top Trends
Find Best Stocks In Any Market - Bull or Bear Market
Take A Peek At Our Top Ten Stocks Lists: Daily, Weekly, Year-to-Date & Top Trends
Smallcap Stocks With Best Up Trends [0-bearish to 100-bullish]: Ambarella [100], TPI Composites[100], Hallador Energy[100], Aaron s[100], Sportsman s[100], Heron [100], Federal Signal[100], Newpark Resources[100], Infinera [100], CONSOL Energy[100], Clean Energy[100]
Best Smallcap Stocks Year-to-Date:
CareMax [504.12%], Janux [397.91%], Viking [234.74%], Summit [232.76%], Novavax [213.13%], Longboard [208.84%], Avidity Biosciences[197.12%], Stoke [177.95%], Super Micro[175.98%], Sweetgreen [172.12%], NuScale Power[170.7%] Best Smallcap Stocks This Week:
Summit [156.95%], Insmed [150.23%], Forward Air[36.25%], Ikena Oncology[35.11%], Orchestra BioMed[32%], Credo [30.55%], Arcturus [27.58%], Semler Scientific[25.94%], Hallador Energy[25.72%], Foot Locker[25.65%], CommScope Holding[24.14%] Best Smallcap Stocks Daily:
Ambarella [20.60%], Eyenovia [13.48%], Accuray [12.74%], Slair Broadcast[12.08%], TPI Composites[12.07%], Akoustis [12.04%], Emergent BioSolutions[11.98%], Hallador Energy[11.29%], Aaron s[9.99%], Cogint [9.88%], Trinseo S.A[9.43%]