
 Login Sign Up


| |||||
 |  | ||||

| 12Stocks.com Market Intelligence |
Best SmallCap Stocks
|
| In a hurry? Small Cap Stock Lists: Performance Trends Table, Stock Charts
Sort Small Cap stocks: Daily, Weekly, Year-to-Date, Market Cap & Trends. Filter Small Cap stocks list by sector: Show all, Tech, Finance, Energy, Staples, Retail, Industrial, Materials, Utilities and HealthCare Filter Small Cap stocks list by size: All Large Medium Small and MicroCap |
| 12Stocks.com Small Cap Stocks Performances & Trends Daily | |||||||||
|
|  The overall Smart Investing & Trading Score is 86 (0-bearish to 100-bullish) which puts Small Cap index in short term bullish trend. The Smart Investing & Trading Score from previous trading session is 48 and hence an improvement of trend.
| ||||||||
Here are the Smart Investing & Trading Scores of the most requested small cap stocks at 12Stocks.com (click stock name for detailed review):
|


| 12Stocks.com: Investing in Smallcap Index with Stocks | |
|
The following table helps investors and traders sort through current performance and trends (as measured by Smart Investing & Trading Score) of various
stocks in the Smallcap Index. Quick View: Move mouse or cursor over stock symbol (ticker) to view short-term technical chart and over stock name to view long term chart. Click on  to add stock symbol to your watchlist and to add stock symbol to your watchlist and  to view watchlist. Click on any ticker or stock name for detailed market intelligence report for that stock. to view watchlist. Click on any ticker or stock name for detailed market intelligence report for that stock. |
12Stocks.com Performance of Stocks in Smallcap Index
| Ticker | Stock Name | Watchlist | Category | Recent Price | Smart Investing & Trading Score | Change % | YTD Change% |
| RRGB | Red Robin |   | Services & Goods | 8.10 | 88 | 4.79% | -35.04% |
| EMBC | Embecta | | Health Care | 12.37 | 35 | -0.48% | -35.25% |
| DOMO | Domo | | Technology | 6.66 | 15 | 3.58% | -35.28% |
| ALGT | Allegiant Travel | | Transports | 53.20 | 42 | 3.38% | -35.60% |
| ATEC | Alphatec | | Health Care | 9.72 | 0 | -3.95% | -35.67% |
| CFFI | C&F Financial | | Financials | 43.84 | 32 | 0.09% | -35.71% |
| EVRI | Everi | | Services & Goods | 7.23 | 32 | 6.32% | -35.85% |
| EVH | Evolent Health | | Technology | 21.19 | 0 | -1.58% | -35.85% |
| IAS | Integral Ad | | Services & Goods | 9.26 | 10 | -4.04% | -36.27% |
| RPD | Rapid7 | | Technology | 36.14 | 10 | 0.33% | -36.71% |
| CBRL | Cracker Barrel | | Services & Goods | 48.78 | 32 | 1.37% | -36.72% |
| EXTR | Extreme s | | Technology | 11.15 | 35 | 0.81% | -36.79% |
| KRNY | Kearny Financial | | Financials | 5.67 | 52 | 1.25% | -36.79% |
| OPFI | OppFi | | Financials | 3.23 | 30 | -4.15% | -36.79% |
| ATRC | AtriCure | | Health Care | 22.54 | 45 | 1.26% | -36.85% |
| SVC | Service Properties | | Financials | 5.38 | 27 | 0.56% | -37.00% |
| SSTI | ShotSpotter | | Technology | 16.07 | 57 | 0.47% | -37.08% |
| ARAY | Accuray | | Health Care | 1.77 | 64 | 12.74% | -37.46% |
| REPL | Replimune Group | | Health Care | 5.27 | 42 | 3.33% | -37.49% |
| ATNI | ATN | | Technology | 24.34 | 57 | 2.79% | -37.54% |
| PTLO | Portillos | | Services & Goods | 10.02 | 17 | 0.30% | -37.57% |
| RDFN | Redfin | | Technology | 6.44 | 37 | 5.75% | -37.60% |
| SCPH | sc | | Health Care | 3.91 | 25 | -2.49% | -37.64% |
| IAUX | i-80 Gold | | Materials | 1.09 | 27 | -3.54% | -37.71% |
| CUE | Cue Biopharma | | Health Care | 1.63 | 20 | 2.52% | -38.26% |


| Too many stocks? View smallcap stocks filtered by marketcap & sector |
| Marketcap: All SmallCap Stocks (default-no microcap), Large, Mid-Range, Small |
| Smallcap Sector: Tech, Finance, Energy, Staples, Retail, Industrial, Materials, & Medical |
|
Get the most comprehensive stock market coverage daily at 12Stocks.com ➞ Best Stocks Today ➞ Best Stocks Weekly ➞ Best Stocks Year-to-Date ➞ Best Stocks Trends ➞  Best Stocks Today 12Stocks.com Best Nasdaq Stocks ➞ Best S&P 500 Stocks ➞ Best Tech Stocks ➞ Best Biotech Stocks ➞ |
| Detailed Overview of SmallCap Stocks |
| SmallCap Technical Overview, Leaders & Laggards, Top SmallCap ETF Funds & Detailed SmallCap Stocks List, Charts, Trends & More |
| Smallcap: Technical Analysis, Trends & YTD Performance | |
| SmallCap segment as represented by
IWM, an exchange-traded fund [ETF], holds basket of thousands of smallcap stocks from across all major sectors of the US stock market. The smallcap index (contains stocks like Riverbed & Sotheby's) is up by 2.52% and is currently underperforming the overall market by -7.27% year-to-date. Below is a quick view of technical charts and trends: | |
 IWM Weekly Chart |
|
| Long Term Trend: Very Good | |
| Medium Term Trend: Very Good | |
 IWM Daily Chart |
|
| Short Term Trend: Very Good | |
| Overall Trend Score: 86 | |
| YTD Performance: 2.52% | |
| **Trend Scores & Views Are Only For Educational Purposes And Not For Investing | |
| 12Stocks.com: Top Performing Small Cap Index Stocks | ||||||||||||||||||||||||||||||||||||||||||||||||
 The top performing Small Cap Index stocks year to date are
Now, more recently, over last week, the top performing Small Cap Index stocks on the move are


|
||||||||||||||||||||||||||||||||||||||||||||||||
| 12Stocks.com: Investing in Smallcap Index using Exchange Traded Funds | |
|
The following table shows list of key exchange traded funds (ETF) that
help investors track Smallcap index. The following list also includes leveraged ETF funds that track twice or thrice the daily returns of Smallcap indices. Short or inverse ETF funds move in the opposite direction to the index they track and are useful during market pullbacks or during bear markets. Quick View: Move mouse or cursor over ETF symbol (ticker) to view short-term technical chart and over ETF name to view long term chart. Click on ticker or stock name for detailed view. Click on to add stock symbol to your watchlist and to view watchlist. |
12Stocks.com List of ETFs that track Smallcap Index
| Ticker | ETF Name | Watchlist | Recent Price | Smart Investing & Trading Score | Change % | Week % | Year-to-date % |
| IWM | iShares Russell 2000 | | 205.77 | 86 | 0.84 | 0.16 | 2.52% |
| IJR | iShares Core S&P Small-Cap | | 109.65 | 93 | 1.14 | 0.76 | 1.29% |
| IWN | iShares Russell 2000 Value | | 155.88 | 76 | 1.17 | 0.46 | 0.35% |
| IWO | iShares Russell 2000 Growth | | 263.62 | 68 | 0.33 | -0.29 | 4.52% |
| VTWO | Vanguard Russell 2000 ETF | | 82.52 | 51 | -0.08 | -0.66 | 1.75% |
| IJS | iShares S&P Small-Cap 600 Value | | 99.74 | 37 | 0.69 | 0.18 | -3.23% |
| IJT | iShares S&P Small-Cap 600 Growth | | 130.21 | 81 | 0.05 | -0.33 | 4.05% |
| XSLV | PowerShares S&P SmallCap Low Volatil ETF | | 43.66 | 48 | 0.72 | -0.23 | -1.11% |
| SBB | ProShares Short SmallCap600 | | 15.97 | 20 | -0.62 | -0.28 | 0.25% |
| SAA | ProShares Ultra SmallCap600 | | 24.16 | 58 | 0.73 | 0.03 | -3.17% |
| SDD | ProShares UltraShort SmallCap600 | | 18.11 | 17 | -2.53 | -1.36 | -1.72% |
| SMLV | SPDR SSGA US Small Cap Low Volatil ETF | | 110.05 | 55 | 0.89 | -0.16 | -2.2% |
| 12Stocks.com: Charts, Trends, Fundamental Data and Performances of SmallCap Stocks | |
|
We now take in-depth look at all SmallCap stocks including charts, multi-period performances and overall trends (as measured by Smart Investing & Trading Score). One can sort SmallCap stocks (click link to choose) by Daily, Weekly and by Year-to-Date performances. Also, one can sort by size of the company or by market capitalization. |
| Select Your Default Chart Type: | |||||
| |||||
| Click on stock symbol or name for detailed view. Click on to add stock symbol to your watchlist and to view watchlist. Quick View: Move mouse or cursor over "Daily" to quickly view daily technical stock chart and over "Weekly" to view weekly technical stock chart. | |||||

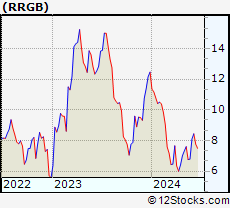 | RRGB Red Robin Gourmet Burgers, Inc. |
| Sector: Services & Goods | |
| SubSector: Restaurants | |
| MarketCap: 121.57 Millions | |
| Recent Price: 8.10 Smart Investing & Trading Score: 88 | |
| Day Percent Change: 4.79% Day Change: 0.37 | |
| Week Change: 19.29% Year-to-date Change: -35.0% | |
| RRGB Links: Profile News Message Board | |
| Charts:- Daily , Weekly | |
| Add RRGB to Watchlist: View: Get Complete RRGB Trend Analysis ➞ | |
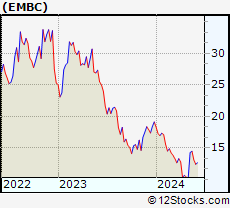 | EMBC Embecta Corp. |
| Sector: Health Care | |
| SubSector: Medical Instruments & Supplies | |
| MarketCap: 1260 Millions | |
| Recent Price: 12.37 Smart Investing & Trading Score: 35 | |
| Day Percent Change: -0.48% Day Change: -0.06 | |
| Week Change: -5.28% Year-to-date Change: -35.3% | |
| EMBC Links: Profile News Message Board | |
| Charts:- Daily , Weekly | |
| Add EMBC to Watchlist: View: Get Complete EMBC Trend Analysis ➞ | |
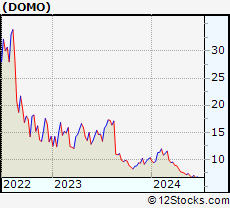 | DOMO Domo, Inc. |
| Sector: Technology | |
| SubSector: Application Software | |
| MarketCap: 247.062 Millions | |
| Recent Price: 6.66 Smart Investing & Trading Score: 15 | |
| Day Percent Change: 3.58% Day Change: 0.23 | |
| Week Change: -4.45% Year-to-date Change: -35.3% | |
| DOMO Links: Profile News Message Board | |
| Charts:- Daily , Weekly | |
| Add DOMO to Watchlist: View: Get Complete DOMO Trend Analysis ➞ | |
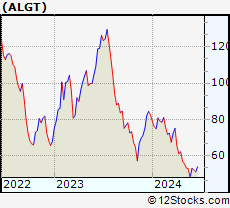 | ALGT Allegiant Travel Company |
| Sector: Transports | |
| SubSector: Regional Airlines | |
| MarketCap: 1317.7 Millions | |
| Recent Price: 53.20 Smart Investing & Trading Score: 42 | |
| Day Percent Change: 3.38% Day Change: 1.74 | |
| Week Change: 10.6% Year-to-date Change: -35.6% | |
| ALGT Links: Profile News Message Board | |
| Charts:- Daily , Weekly | |
| Add ALGT to Watchlist: View: Get Complete ALGT Trend Analysis ➞ | |
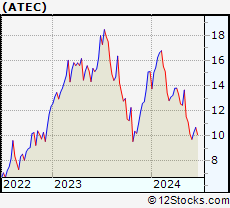 | ATEC Alphatec Holdings, Inc. |
| Sector: Health Care | |
| SubSector: Medical Instruments & Supplies | |
| MarketCap: 181.16 Millions | |
| Recent Price: 9.72 Smart Investing & Trading Score: 0 | |
| Day Percent Change: -3.95% Day Change: -0.40 | |
| Week Change: -3.95% Year-to-date Change: -35.7% | |
| ATEC Links: Profile News Message Board | |
| Charts:- Daily , Weekly | |
| Add ATEC to Watchlist: View: Get Complete ATEC Trend Analysis ➞ | |
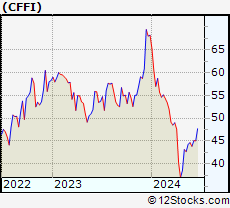 | CFFI C&F Financial Corporation |
| Sector: Financials | |
| SubSector: Regional - Mid-Atlantic Banks | |
| MarketCap: 145.559 Millions | |
| Recent Price: 43.84 Smart Investing & Trading Score: 32 | |
| Day Percent Change: 0.09% Day Change: 0.04 | |
| Week Change: -1.81% Year-to-date Change: -35.7% | |
| CFFI Links: Profile News Message Board | |
| Charts:- Daily , Weekly | |
| Add CFFI to Watchlist: View: Get Complete CFFI Trend Analysis ➞ | |
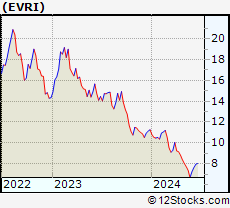 | EVRI Everi Holdings Inc. |
| Sector: Services & Goods | |
| SubSector: Gaming Activities | |
| MarketCap: 273.389 Millions | |
| Recent Price: 7.23 Smart Investing & Trading Score: 32 | |
| Day Percent Change: 6.32% Day Change: 0.43 | |
| Week Change: 8.4% Year-to-date Change: -35.9% | |
| EVRI Links: Profile News Message Board | |
| Charts:- Daily , Weekly | |
| Add EVRI to Watchlist: View: Get Complete EVRI Trend Analysis ➞ | |
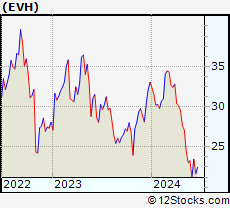 | EVH Evolent Health, Inc. |
| Sector: Technology | |
| SubSector: Healthcare Information Services | |
| MarketCap: 486.755 Millions | |
| Recent Price: 21.19 Smart Investing & Trading Score: 0 | |
| Day Percent Change: -1.58% Day Change: -0.34 | |
| Week Change: -8.98% Year-to-date Change: -35.9% | |
| EVH Links: Profile News Message Board | |
| Charts:- Daily , Weekly | |
| Add EVH to Watchlist: View: Get Complete EVH Trend Analysis ➞ | |
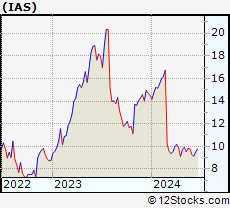 | IAS Integral Ad Science Holding Corp. |
| Sector: Services & Goods | |
| SubSector: Advertising Agencies | |
| MarketCap: 2760 Millions | |
| Recent Price: 9.26 Smart Investing & Trading Score: 10 | |
| Day Percent Change: -4.04% Day Change: -0.39 | |
| Week Change: -5.41% Year-to-date Change: -36.3% | |
| IAS Links: Profile News Message Board | |
| Charts:- Daily , Weekly | |
| Add IAS to Watchlist: View: Get Complete IAS Trend Analysis ➞ | |
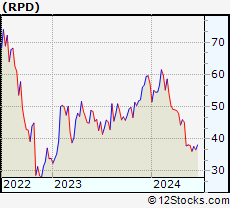 | RPD Rapid7, Inc. |
| Sector: Technology | |
| SubSector: Application Software | |
| MarketCap: 1981.12 Millions | |
| Recent Price: 36.14 Smart Investing & Trading Score: 10 | |
| Day Percent Change: 0.33% Day Change: 0.12 | |
| Week Change: -4.94% Year-to-date Change: -36.7% | |
| RPD Links: Profile News Message Board | |
| Charts:- Daily , Weekly | |
| Add RPD to Watchlist: View: Get Complete RPD Trend Analysis ➞ | |
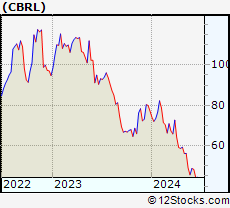 | CBRL Cracker Barrel Old Country Store, Inc. |
| Sector: Services & Goods | |
| SubSector: Restaurants | |
| MarketCap: 1839.6 Millions | |
| Recent Price: 48.78 Smart Investing & Trading Score: 32 | |
| Day Percent Change: 1.37% Day Change: 0.66 | |
| Week Change: 6.93% Year-to-date Change: -36.7% | |
| CBRL Links: Profile News Message Board | |
| Charts:- Daily , Weekly | |
| Add CBRL to Watchlist: View: Get Complete CBRL Trend Analysis ➞ | |
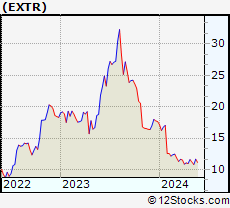 | EXTR Extreme Networks, Inc. |
| Sector: Technology | |
| SubSector: Communication Equipment | |
| MarketCap: 339.939 Millions | |
| Recent Price: 11.15 Smart Investing & Trading Score: 35 | |
| Day Percent Change: 0.81% Day Change: 0.09 | |
| Week Change: 0% Year-to-date Change: -36.8% | |
| EXTR Links: Profile News Message Board | |
| Charts:- Daily , Weekly | |
| Add EXTR to Watchlist: View: Get Complete EXTR Trend Analysis ➞ | |
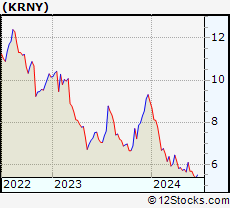 | KRNY Kearny Financial Corp. |
| Sector: Financials | |
| SubSector: Savings & Loans | |
| MarketCap: 781.73 Millions | |
| Recent Price: 5.67 Smart Investing & Trading Score: 52 | |
| Day Percent Change: 1.25% Day Change: 0.07 | |
| Week Change: 0% Year-to-date Change: -36.8% | |
| KRNY Links: Profile News Message Board | |
| Charts:- Daily , Weekly | |
| Add KRNY to Watchlist: View: Get Complete KRNY Trend Analysis ➞ | |
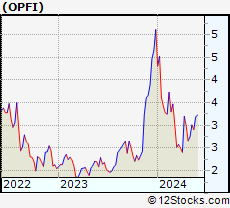 | OPFI OppFi Inc. |
| Sector: Financials | |
| SubSector: Credit Services | |
| MarketCap: 226 Millions | |
| Recent Price: 3.23 Smart Investing & Trading Score: 30 | |
| Day Percent Change: -4.15% Day Change: -0.14 | |
| Week Change: 1.25% Year-to-date Change: -36.8% | |
| OPFI Links: Profile News Message Board | |
| Charts:- Daily , Weekly | |
| Add OPFI to Watchlist: View: Get Complete OPFI Trend Analysis ➞ | |
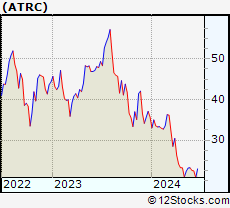 | ATRC AtriCure, Inc. |
| Sector: Health Care | |
| SubSector: Medical Instruments & Supplies | |
| MarketCap: 1158.7 Millions | |
| Recent Price: 22.54 Smart Investing & Trading Score: 45 | |
| Day Percent Change: 1.26% Day Change: 0.28 | |
| Week Change: -2.8% Year-to-date Change: -36.9% | |
| ATRC Links: Profile News Message Board | |
| Charts:- Daily , Weekly | |
| Add ATRC to Watchlist: View: Get Complete ATRC Trend Analysis ➞ | |
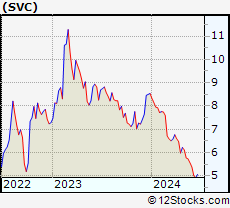 | SVC Service Properties Trust |
| Sector: Financials | |
| SubSector: REIT - Hotel/Motel | |
| MarketCap: 1067.74 Millions | |
| Recent Price: 5.38 Smart Investing & Trading Score: 27 | |
| Day Percent Change: 0.56% Day Change: 0.03 | |
| Week Change: -3.41% Year-to-date Change: -37.0% | |
| SVC Links: Profile News Message Board | |
| Charts:- Daily , Weekly | |
| Add SVC to Watchlist: View: Get Complete SVC Trend Analysis ➞ | |
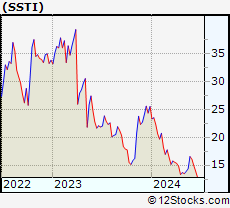 | SSTI ShotSpotter, Inc. |
| Sector: Technology | |
| SubSector: Application Software | |
| MarketCap: 353.062 Millions | |
| Recent Price: 16.07 Smart Investing & Trading Score: 57 | |
| Day Percent Change: 0.47% Day Change: 0.08 | |
| Week Change: -2.9% Year-to-date Change: -37.1% | |
| SSTI Links: Profile News Message Board | |
| Charts:- Daily , Weekly | |
| Add SSTI to Watchlist: View: Get Complete SSTI Trend Analysis ➞ | |
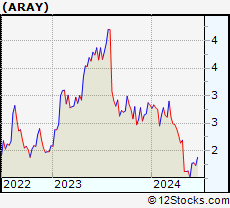 | ARAY Accuray Incorporated |
| Sector: Health Care | |
| SubSector: Medical Appliances & Equipment | |
| MarketCap: 169.58 Millions | |
| Recent Price: 1.77 Smart Investing & Trading Score: 64 | |
| Day Percent Change: 12.74% Day Change: 0.20 | |
| Week Change: 17.22% Year-to-date Change: -37.5% | |
| ARAY Links: Profile News Message Board | |
| Charts:- Daily , Weekly | |
| Add ARAY to Watchlist: View: Get Complete ARAY Trend Analysis ➞ | |
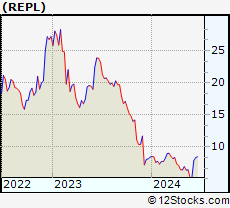 | REPL Replimune Group, Inc. |
| Sector: Health Care | |
| SubSector: Biotechnology | |
| MarketCap: 367.885 Millions | |
| Recent Price: 5.27 Smart Investing & Trading Score: 42 | |
| Day Percent Change: 3.33% Day Change: 0.17 | |
| Week Change: 0.76% Year-to-date Change: -37.5% | |
| REPL Links: Profile News Message Board | |
| Charts:- Daily , Weekly | |
| Add REPL to Watchlist: View: Get Complete REPL Trend Analysis ➞ | |
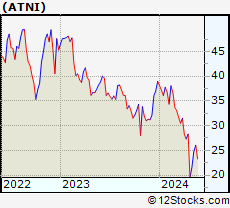 | ATNI ATN International, Inc. |
| Sector: Technology | |
| SubSector: Telecom Services - Domestic | |
| MarketCap: 1014.77 Millions | |
| Recent Price: 24.34 Smart Investing & Trading Score: 57 | |
| Day Percent Change: 2.79% Day Change: 0.66 | |
| Week Change: 3.4% Year-to-date Change: -37.5% | |
| ATNI Links: Profile News Message Board | |
| Charts:- Daily , Weekly | |
| Add ATNI to Watchlist: View: Get Complete ATNI Trend Analysis ➞ | |
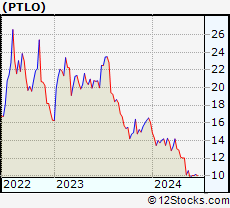 | PTLO Portillos Inc. |
| Sector: Services & Goods | |
| SubSector: Restaurants | |
| MarketCap: 1590 Millions | |
| Recent Price: 10.02 Smart Investing & Trading Score: 17 | |
| Day Percent Change: 0.30% Day Change: 0.03 | |
| Week Change: 2.35% Year-to-date Change: -37.6% | |
| PTLO Links: Profile News Message Board | |
| Charts:- Daily , Weekly | |
| Add PTLO to Watchlist: View: Get Complete PTLO Trend Analysis ➞ | |
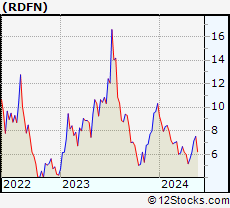 | RDFN Redfin Corporation |
| Sector: Technology | |
| SubSector: Internet Information Providers | |
| MarketCap: 1356.2 Millions | |
| Recent Price: 6.44 Smart Investing & Trading Score: 37 | |
| Day Percent Change: 5.75% Day Change: 0.35 | |
| Week Change: 7.15% Year-to-date Change: -37.6% | |
| RDFN Links: Profile News Message Board | |
| Charts:- Daily , Weekly | |
| Add RDFN to Watchlist: View: Get Complete RDFN Trend Analysis ➞ | |
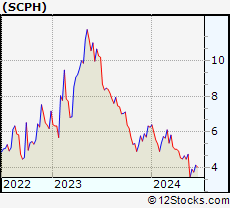 | SCPH scPharmaceuticals Inc. |
| Sector: Health Care | |
| SubSector: Biotechnology | |
| MarketCap: 136.185 Millions | |
| Recent Price: 3.91 Smart Investing & Trading Score: 25 | |
| Day Percent Change: -2.49% Day Change: -0.10 | |
| Week Change: 13.66% Year-to-date Change: -37.6% | |
| SCPH Links: Profile News Message Board | |
| Charts:- Daily , Weekly | |
| Add SCPH to Watchlist: View: Get Complete SCPH Trend Analysis ➞ | |
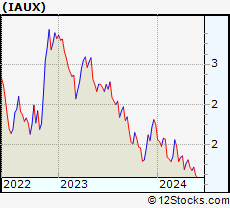 | IAUX i-80 Gold Corp. |
| Sector: Materials | |
| SubSector: Gold | |
| MarketCap: 616 Millions | |
| Recent Price: 1.09 Smart Investing & Trading Score: 27 | |
| Day Percent Change: -3.54% Day Change: -0.04 | |
| Week Change: -2.24% Year-to-date Change: -37.7% | |
| IAUX Links: Profile News Message Board | |
| Charts:- Daily , Weekly | |
| Add IAUX to Watchlist: View: Get Complete IAUX Trend Analysis ➞ | |
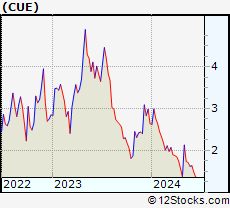 | CUE Cue Biopharma, Inc. |
| Sector: Health Care | |
| SubSector: Biotechnology | |
| MarketCap: 352.785 Millions | |
| Recent Price: 1.63 Smart Investing & Trading Score: 20 | |
| Day Percent Change: 2.52% Day Change: 0.04 | |
| Week Change: 0.31% Year-to-date Change: -38.3% | |
| CUE Links: Profile News Message Board | |
| Charts:- Daily , Weekly | |
| Add CUE to Watchlist: View: Get Complete CUE Trend Analysis ➞ | |
| Too many stocks? View smallcap stocks filtered by marketcap & sector |
| Marketcap: All SmallCap Stocks (default-no microcap), Large, Mid-Range, Small & MicroCap |
| Sector: Tech, Finance, Energy, Staples, Retail, Industrial, Materials, Utilities & Medical |
|
Best Stocks Today 12Stocks.com |
© 2024 12Stocks.com Terms & Conditions Privacy Contact Us
All Information Provided Only For Education And Not To Be Used For Investing or Trading. See Terms & Conditions


One More Thing ... Get Best Stocks Delivered Daily!
Never Ever Miss A Move With Our Top Ten Stocks Lists
Find Best Stocks In Any Market - Bull or Bear Market
Take A Peek At Our Top Ten Stocks Lists: Daily, Weekly, Year-to-Date & Top Trends
Find Best Stocks In Any Market - Bull or Bear Market
Take A Peek At Our Top Ten Stocks Lists: Daily, Weekly, Year-to-Date & Top Trends
Smallcap Stocks With Best Up Trends [0-bearish to 100-bullish]: Ambarella [100], TPI Composites[100], Hallador Energy[100], Aaron s[100], Sportsman s[100], Heron [100], Federal Signal[100], Newpark Resources[100], Infinera [100], CONSOL Energy[100], Clean Energy[100]
Best Smallcap Stocks Year-to-Date:
CareMax [504.12%], Janux [397.91%], Viking [234.74%], Summit [232.76%], Novavax [213.13%], Longboard [208.84%], Avidity Biosciences[197.12%], Stoke [177.95%], Super Micro[175.98%], Sweetgreen [172.12%], NuScale Power[170.7%] Best Smallcap Stocks This Week:
Summit [156.95%], Insmed [150.23%], Forward Air[36.25%], Ikena Oncology[35.11%], Orchestra BioMed[32%], Credo [30.55%], Arcturus [27.58%], Semler Scientific[25.94%], Hallador Energy[25.72%], Foot Locker[25.65%], CommScope Holding[24.14%] Best Smallcap Stocks Daily:
Ambarella [20.60%], Eyenovia [13.48%], Accuray [12.74%], Slair Broadcast[12.08%], TPI Composites[12.07%], Akoustis [12.04%], Emergent BioSolutions[11.98%], Hallador Energy[11.29%], Aaron s[9.99%], Cogint [9.88%], Trinseo S.A[9.43%]