
 Login Sign Up


| |||||
 |  | ||||

| 12Stocks.com Market Intelligence |
Best SmallCap Stocks
|
| In a hurry? Small Cap Stock Lists: Performance Trends Table, Stock Charts
Sort Small Cap stocks: Daily, Weekly, Year-to-Date, Market Cap & Trends. Filter Small Cap stocks list by sector: Show all, Tech, Finance, Energy, Staples, Retail, Industrial, Materials, Utilities and HealthCare Filter Small Cap stocks list by size: All Large Medium Small and MicroCap |
| 12Stocks.com Small Cap Stocks Performances & Trends Daily | |||||||||
|
|  The overall Smart Investing & Trading Score is 86 (0-bearish to 100-bullish) which puts Small Cap index in short term bullish trend. The Smart Investing & Trading Score from previous trading session is 48 and hence an improvement of trend.
| ||||||||
Here are the Smart Investing & Trading Scores of the most requested small cap stocks at 12Stocks.com (click stock name for detailed review):
|


| 12Stocks.com: Investing in Smallcap Index with Stocks | |
|
The following table helps investors and traders sort through current performance and trends (as measured by Smart Investing & Trading Score) of various
stocks in the Smallcap Index. Quick View: Move mouse or cursor over stock symbol (ticker) to view short-term technical chart and over stock name to view long term chart. Click on  to add stock symbol to your watchlist and to add stock symbol to your watchlist and  to view watchlist. Click on any ticker or stock name for detailed market intelligence report for that stock. to view watchlist. Click on any ticker or stock name for detailed market intelligence report for that stock. |
12Stocks.com Performance of Stocks in Smallcap Index
| Ticker | Stock Name | Watchlist | Category | Recent Price | Smart Investing & Trading Score | Change % | YTD Change% |
| LXP | Lexington Realty |   | Financials | 8.50 | 42 | 0.71% | -14.31% |
| SPTN | SpartanNash | | Consumer Staples | 19.65 | 35 | -0.83% | -14.38% |
| FNLC | First Bancorp | | Financials | 24.16 | 76 | 0.92% | -14.39% |
| SBSI | Southside Bancshares | | Financials | 26.81 | 32 | -0.19% | -14.40% |
| CVLY | Codorus Valley | | Financials | 22.00 | 27 | 0.82% | -14.40% |
| RWT | Redwood Trust | | Financials | 6.34 | 73 | 1.60% | -14.44% |
| EVTC | EVERTEC | | Technology | 34.97 | 10 | 0.37% | -14.58% |
| HBNC | Horizon Bancorp | | Financials | 12.22 | 68 | 1.24% | -14.61% |
| BDN | Brandywine Realty | | Financials | 4.61 | 68 | 1.32% | -14.63% |
| AVDX | AvidXchange | | Technology | 10.59 | 17 | 1.34% | -14.70% |
| BYND | Beyond Meat | | Consumer Staples | 7.59 | 47 | 3.27% | -14.72% |
| TRUE | TrueCar | | Technology | 2.95 | 47 | 1.37% | -14.74% |
| FBNC | First Bancorp | | Financials | 31.55 | 35 | 0.16% | -14.75% |
| WINA | Winmark | | Services & Goods | 355.90 | 32 | 3.76% | -14.76% |
| WSBF | Waterstone Financial | | Financials | 12.10 | 27 | 1.34% | -14.79% |
| RLJ | RLJ Lodging | | Financials | 9.98 | 25 | 1.42% | -14.85% |
| WGO | Winnebago Industries | | Consumer Staples | 62.05 | 42 | 1.92% | -14.86% |
| TGI | Triumph Group | | Industrials | 14.11 | 69 | 1.22% | -14.90% |
| GSHD | Goosehead Insurance | | Financials | 64.50 | 47 | 0.80% | -14.91% |
| KE | Kimball Electronics | | Technology | 22.92 | 85 | 0.44% | -14.95% |
| BZH | Beazer Homes | | Industrials | 28.72 | 50 | 4.51% | -15.00% |
| FC | Franklin Covey | | Services & Goods | 37.00 | 17 | 0.84% | -15.00% |
| WAFD | Washington Federal | | Financials | 28.01 | 68 | 1.74% | -15.02% |
| KWR | Quaker Chemical | | Materials | 181.35 | 25 | 1.35% | -15.03% |
| HQI | HireQuest | | Services & Goods | 13.03 | 53 | 0.70% | -15.11% |


| Too many stocks? View smallcap stocks filtered by marketcap & sector |
| Marketcap: All SmallCap Stocks (default-no microcap), Large, Mid-Range, Small |
| Smallcap Sector: Tech, Finance, Energy, Staples, Retail, Industrial, Materials, & Medical |
|
Get the most comprehensive stock market coverage daily at 12Stocks.com ➞ Best Stocks Today ➞ Best Stocks Weekly ➞ Best Stocks Year-to-Date ➞ Best Stocks Trends ➞  Best Stocks Today 12Stocks.com Best Nasdaq Stocks ➞ Best S&P 500 Stocks ➞ Best Tech Stocks ➞ Best Biotech Stocks ➞ |
| Detailed Overview of SmallCap Stocks |
| SmallCap Technical Overview, Leaders & Laggards, Top SmallCap ETF Funds & Detailed SmallCap Stocks List, Charts, Trends & More |
| Smallcap: Technical Analysis, Trends & YTD Performance | |
| SmallCap segment as represented by
IWM, an exchange-traded fund [ETF], holds basket of thousands of smallcap stocks from across all major sectors of the US stock market. The smallcap index (contains stocks like Riverbed & Sotheby's) is up by 2.52% and is currently underperforming the overall market by -7.27% year-to-date. Below is a quick view of technical charts and trends: | |
 IWM Weekly Chart |
|
| Long Term Trend: Very Good | |
| Medium Term Trend: Very Good | |
 IWM Daily Chart |
|
| Short Term Trend: Very Good | |
| Overall Trend Score: 86 | |
| YTD Performance: 2.52% | |
| **Trend Scores & Views Are Only For Educational Purposes And Not For Investing | |
| 12Stocks.com: Top Performing Small Cap Index Stocks | ||||||||||||||||||||||||||||||||||||||||||||||||
 The top performing Small Cap Index stocks year to date are
Now, more recently, over last week, the top performing Small Cap Index stocks on the move are


|
||||||||||||||||||||||||||||||||||||||||||||||||
| 12Stocks.com: Investing in Smallcap Index using Exchange Traded Funds | |
|
The following table shows list of key exchange traded funds (ETF) that
help investors track Smallcap index. The following list also includes leveraged ETF funds that track twice or thrice the daily returns of Smallcap indices. Short or inverse ETF funds move in the opposite direction to the index they track and are useful during market pullbacks or during bear markets. Quick View: Move mouse or cursor over ETF symbol (ticker) to view short-term technical chart and over ETF name to view long term chart. Click on ticker or stock name for detailed view. Click on to add stock symbol to your watchlist and to view watchlist. |
12Stocks.com List of ETFs that track Smallcap Index
| Ticker | ETF Name | Watchlist | Recent Price | Smart Investing & Trading Score | Change % | Week % | Year-to-date % |
| IWM | iShares Russell 2000 | | 205.77 | 86 | 0.84 | 0.16 | 2.52% |
| IJR | iShares Core S&P Small-Cap | | 109.65 | 93 | 1.14 | 0.76 | 1.29% |
| IWN | iShares Russell 2000 Value | | 155.88 | 76 | 1.17 | 0.46 | 0.35% |
| IWO | iShares Russell 2000 Growth | | 263.62 | 68 | 0.33 | -0.29 | 4.52% |
| VTWO | Vanguard Russell 2000 ETF | | 82.52 | 51 | -0.08 | -0.66 | 1.75% |
| IJS | iShares S&P Small-Cap 600 Value | | 99.74 | 37 | 0.69 | 0.18 | -3.23% |
| IJT | iShares S&P Small-Cap 600 Growth | | 130.21 | 81 | 0.05 | -0.33 | 4.05% |
| XSLV | PowerShares S&P SmallCap Low Volatil ETF | | 43.66 | 48 | 0.72 | -0.23 | -1.11% |
| SBB | ProShares Short SmallCap600 | | 15.97 | 20 | -0.62 | -0.28 | 0.25% |
| SAA | ProShares Ultra SmallCap600 | | 24.16 | 58 | 0.73 | 0.03 | -3.17% |
| SDD | ProShares UltraShort SmallCap600 | | 18.11 | 17 | -2.53 | -1.36 | -1.72% |
| SMLV | SPDR SSGA US Small Cap Low Volatil ETF | | 110.05 | 55 | 0.89 | -0.16 | -2.2% |
| 12Stocks.com: Charts, Trends, Fundamental Data and Performances of SmallCap Stocks | |
|
We now take in-depth look at all SmallCap stocks including charts, multi-period performances and overall trends (as measured by Smart Investing & Trading Score). One can sort SmallCap stocks (click link to choose) by Daily, Weekly and by Year-to-Date performances. Also, one can sort by size of the company or by market capitalization. |
| Select Your Default Chart Type: | |||||
| |||||
| Click on stock symbol or name for detailed view. Click on to add stock symbol to your watchlist and to view watchlist. Quick View: Move mouse or cursor over "Daily" to quickly view daily technical stock chart and over "Weekly" to view weekly technical stock chart. | |||||

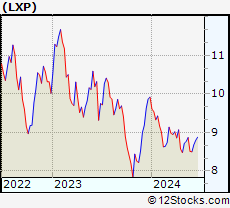 | LXP Lexington Realty Trust |
| Sector: Financials | |
| SubSector: REIT - Diversified | |
| MarketCap: 2483.43 Millions | |
| Recent Price: 8.50 Smart Investing & Trading Score: 42 | |
| Day Percent Change: 0.71% Day Change: 0.06 | |
| Week Change: -0.12% Year-to-date Change: -14.3% | |
| LXP Links: Profile News Message Board | |
| Charts:- Daily , Weekly | |
| Add LXP to Watchlist: View: Get Complete LXP Trend Analysis ➞ | |
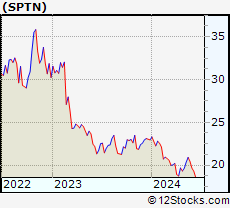 | SPTN SpartanNash Company |
| Sector: Consumer Staples | |
| SubSector: Food Wholesale | |
| MarketCap: 671.229 Millions | |
| Recent Price: 19.65 Smart Investing & Trading Score: 35 | |
| Day Percent Change: -0.83% Day Change: -0.17 | |
| Week Change: -3.82% Year-to-date Change: -14.4% | |
| SPTN Links: Profile News Message Board | |
| Charts:- Daily , Weekly | |
| Add SPTN to Watchlist: View: Get Complete SPTN Trend Analysis ➞ | |
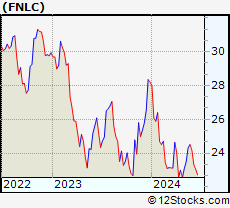 | FNLC The First Bancorp, Inc. |
| Sector: Financials | |
| SubSector: Regional - Northeast Banks | |
| MarketCap: 264.799 Millions | |
| Recent Price: 24.16 Smart Investing & Trading Score: 76 | |
| Day Percent Change: 0.92% Day Change: 0.22 | |
| Week Change: -1.39% Year-to-date Change: -14.4% | |
| FNLC Links: Profile News Message Board | |
| Charts:- Daily , Weekly | |
| Add FNLC to Watchlist: View: Get Complete FNLC Trend Analysis ➞ | |
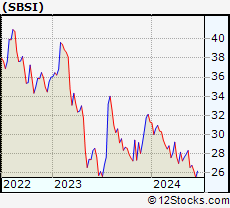 | SBSI Southside Bancshares, Inc. |
| Sector: Financials | |
| SubSector: Regional - Mid-Atlantic Banks | |
| MarketCap: 971.259 Millions | |
| Recent Price: 26.81 Smart Investing & Trading Score: 32 | |
| Day Percent Change: -0.19% Day Change: -0.05 | |
| Week Change: 0.83% Year-to-date Change: -14.4% | |
| SBSI Links: Profile News Message Board | |
| Charts:- Daily , Weekly | |
| Add SBSI to Watchlist: View: Get Complete SBSI Trend Analysis ➞ | |
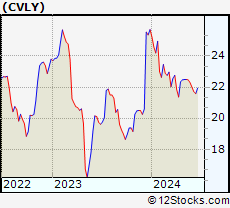 | CVLY Codorus Valley Bancorp, Inc. |
| Sector: Financials | |
| SubSector: Regional - Northeast Banks | |
| MarketCap: 173.799 Millions | |
| Recent Price: 22.00 Smart Investing & Trading Score: 27 | |
| Day Percent Change: 0.82% Day Change: 0.18 | |
| Week Change: -1.35% Year-to-date Change: -14.4% | |
| CVLY Links: Profile News Message Board | |
| Charts:- Daily , Weekly | |
| Add CVLY to Watchlist: View: Get Complete CVLY Trend Analysis ➞ | |
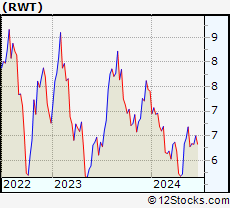 | RWT Redwood Trust, Inc. |
| Sector: Financials | |
| SubSector: Mortgage Investment | |
| MarketCap: 674.739 Millions | |
| Recent Price: 6.34 Smart Investing & Trading Score: 73 | |
| Day Percent Change: 1.60% Day Change: 0.10 | |
| Week Change: 0.96% Year-to-date Change: -14.4% | |
| RWT Links: Profile News Message Board | |
| Charts:- Daily , Weekly | |
| Add RWT to Watchlist: View: Get Complete RWT Trend Analysis ➞ | |
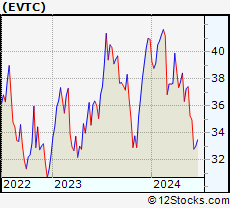 | EVTC EVERTEC, Inc. |
| Sector: Technology | |
| SubSector: Business Software & Services | |
| MarketCap: 1646.08 Millions | |
| Recent Price: 34.97 Smart Investing & Trading Score: 10 | |
| Day Percent Change: 0.37% Day Change: 0.13 | |
| Week Change: -0.88% Year-to-date Change: -14.6% | |
| EVTC Links: Profile News Message Board | |
| Charts:- Daily , Weekly | |
| Add EVTC to Watchlist: View: Get Complete EVTC Trend Analysis ➞ | |
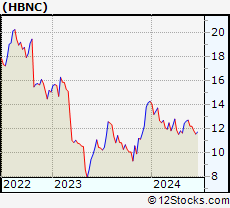 | HBNC Horizon Bancorp, Inc. |
| Sector: Financials | |
| SubSector: Regional - Northeast Banks | |
| MarketCap: 405.999 Millions | |
| Recent Price: 12.22 Smart Investing & Trading Score: 68 | |
| Day Percent Change: 1.24% Day Change: 0.15 | |
| Week Change: -0.16% Year-to-date Change: -14.6% | |
| HBNC Links: Profile News Message Board | |
| Charts:- Daily , Weekly | |
| Add HBNC to Watchlist: View: Get Complete HBNC Trend Analysis ➞ | |
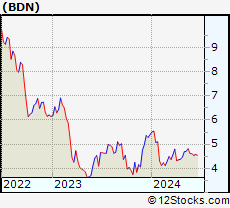 | BDN Brandywine Realty Trust |
| Sector: Financials | |
| SubSector: REIT - Diversified | |
| MarketCap: 1688.13 Millions | |
| Recent Price: 4.61 Smart Investing & Trading Score: 68 | |
| Day Percent Change: 1.32% Day Change: 0.06 | |
| Week Change: -0.22% Year-to-date Change: -14.6% | |
| BDN Links: Profile News Message Board | |
| Charts:- Daily , Weekly | |
| Add BDN to Watchlist: View: Get Complete BDN Trend Analysis ➞ | |
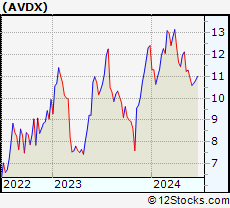 | AVDX AvidXchange Holdings, Inc. |
| Sector: Technology | |
| SubSector: Software - Infrastructure | |
| MarketCap: 2120 Millions | |
| Recent Price: 10.59 Smart Investing & Trading Score: 17 | |
| Day Percent Change: 1.34% Day Change: 0.14 | |
| Week Change: -3.11% Year-to-date Change: -14.7% | |
| AVDX Links: Profile News Message Board | |
| Charts:- Daily , Weekly | |
| Add AVDX to Watchlist: View: Get Complete AVDX Trend Analysis ➞ | |
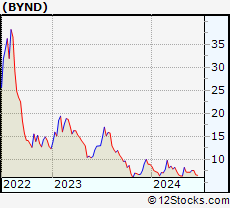 | BYND Beyond Meat, Inc. |
| Sector: Consumer Staples | |
| SubSector: Processed & Packaged Goods | |
| MarketCap: 3987.98 Millions | |
| Recent Price: 7.59 Smart Investing & Trading Score: 47 | |
| Day Percent Change: 3.27% Day Change: 0.24 | |
| Week Change: 5.86% Year-to-date Change: -14.7% | |
| BYND Links: Profile News Message Board | |
| Charts:- Daily , Weekly | |
| Add BYND to Watchlist: View: Get Complete BYND Trend Analysis ➞ | |
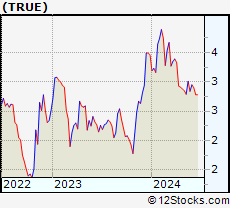 | TRUE TrueCar, Inc. |
| Sector: Technology | |
| SubSector: Internet Service Providers | |
| MarketCap: 244.18 Millions | |
| Recent Price: 2.95 Smart Investing & Trading Score: 47 | |
| Day Percent Change: 1.37% Day Change: 0.04 | |
| Week Change: 3.87% Year-to-date Change: -14.7% | |
| TRUE Links: Profile News Message Board | |
| Charts:- Daily , Weekly | |
| Add TRUE to Watchlist: View: Get Complete TRUE Trend Analysis ➞ | |
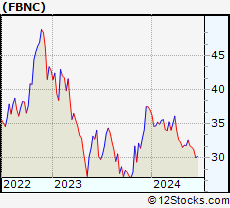 | FBNC First Bancorp |
| Sector: Financials | |
| SubSector: Regional - Mid-Atlantic Banks | |
| MarketCap: 664.959 Millions | |
| Recent Price: 31.55 Smart Investing & Trading Score: 35 | |
| Day Percent Change: 0.16% Day Change: 0.05 | |
| Week Change: -0.63% Year-to-date Change: -14.8% | |
| FBNC Links: Profile News Message Board | |
| Charts:- Daily , Weekly | |
| Add FBNC to Watchlist: View: Get Complete FBNC Trend Analysis ➞ | |
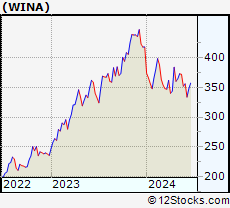 | WINA Winmark Corporation |
| Sector: Services & Goods | |
| SubSector: Specialty Retail, Other | |
| MarketCap: 520.444 Millions | |
| Recent Price: 355.90 Smart Investing & Trading Score: 32 | |
| Day Percent Change: 3.76% Day Change: 12.91 | |
| Week Change: 1.11% Year-to-date Change: -14.8% | |
| WINA Links: Profile News Message Board | |
| Charts:- Daily , Weekly | |
| Add WINA to Watchlist: View: Get Complete WINA Trend Analysis ➞ | |
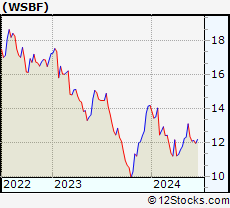 | WSBF Waterstone Financial, Inc. |
| Sector: Financials | |
| SubSector: Savings & Loans | |
| MarketCap: 371.93 Millions | |
| Recent Price: 12.10 Smart Investing & Trading Score: 27 | |
| Day Percent Change: 1.34% Day Change: 0.16 | |
| Week Change: -2.02% Year-to-date Change: -14.8% | |
| WSBF Links: Profile News Message Board | |
| Charts:- Daily , Weekly | |
| Add WSBF to Watchlist: View: Get Complete WSBF Trend Analysis ➞ | |
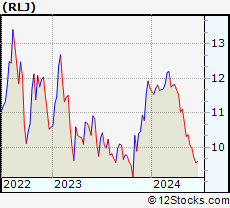 | RLJ RLJ Lodging Trust |
| Sector: Financials | |
| SubSector: REIT - Hotel/Motel | |
| MarketCap: 1019.34 Millions | |
| Recent Price: 9.98 Smart Investing & Trading Score: 25 | |
| Day Percent Change: 1.42% Day Change: 0.14 | |
| Week Change: -0.89% Year-to-date Change: -14.9% | |
| RLJ Links: Profile News Message Board | |
| Charts:- Daily , Weekly | |
| Add RLJ to Watchlist: View: Get Complete RLJ Trend Analysis ➞ | |
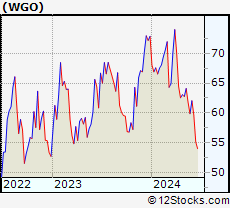 | WGO Winnebago Industries, Inc. |
| Sector: Consumer Staples | |
| SubSector: Recreational Vehicles | |
| MarketCap: 896.559 Millions | |
| Recent Price: 62.05 Smart Investing & Trading Score: 42 | |
| Day Percent Change: 1.92% Day Change: 1.17 | |
| Week Change: 3.66% Year-to-date Change: -14.9% | |
| WGO Links: Profile News Message Board | |
| Charts:- Daily , Weekly | |
| Add WGO to Watchlist: View: Get Complete WGO Trend Analysis ➞ | |
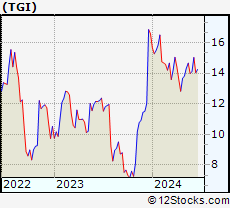 | TGI Triumph Group, Inc. |
| Sector: Industrials | |
| SubSector: Aerospace/Defense Products & Services | |
| MarketCap: 358.901 Millions | |
| Recent Price: 14.11 Smart Investing & Trading Score: 69 | |
| Day Percent Change: 1.22% Day Change: 0.17 | |
| Week Change: 0.93% Year-to-date Change: -14.9% | |
| TGI Links: Profile News Message Board | |
| Charts:- Daily , Weekly | |
| Add TGI to Watchlist: View: Get Complete TGI Trend Analysis ➞ | |
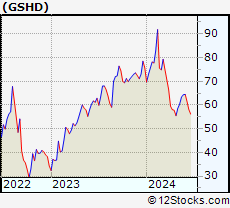 | GSHD Goosehead Insurance, Inc |
| Sector: Financials | |
| SubSector: Insurance Brokers | |
| MarketCap: 1863.57 Millions | |
| Recent Price: 64.50 Smart Investing & Trading Score: 47 | |
| Day Percent Change: 0.80% Day Change: 0.51 | |
| Week Change: 0.22% Year-to-date Change: -14.9% | |
| GSHD Links: Profile News Message Board | |
| Charts:- Daily , Weekly | |
| Add GSHD to Watchlist: View: Get Complete GSHD Trend Analysis ➞ | |
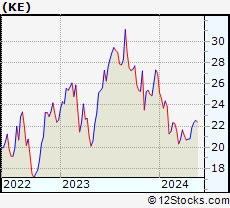 | KE Kimball Electronics, Inc. |
| Sector: Technology | |
| SubSector: Diversified Electronics | |
| MarketCap: 308.896 Millions | |
| Recent Price: 22.92 Smart Investing & Trading Score: 85 | |
| Day Percent Change: 0.44% Day Change: 0.10 | |
| Week Change: 2.28% Year-to-date Change: -15.0% | |
| KE Links: Profile News Message Board | |
| Charts:- Daily , Weekly | |
| Add KE to Watchlist: View: Get Complete KE Trend Analysis ➞ | |
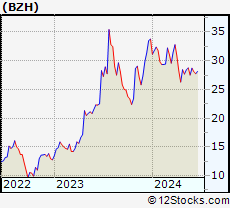 | BZH Beazer Homes USA, Inc. |
| Sector: Industrials | |
| SubSector: Residential Construction | |
| MarketCap: 180.106 Millions | |
| Recent Price: 28.72 Smart Investing & Trading Score: 50 | |
| Day Percent Change: 4.51% Day Change: 1.24 | |
| Week Change: 4.32% Year-to-date Change: -15.0% | |
| BZH Links: Profile News Message Board | |
| Charts:- Daily , Weekly | |
| Add BZH to Watchlist: View: Get Complete BZH Trend Analysis ➞ | |
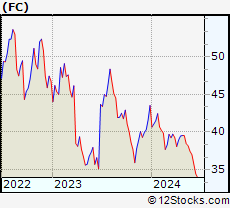 | FC Franklin Covey Co. |
| Sector: Services & Goods | |
| SubSector: Education & Training Services | |
| MarketCap: 243.306 Millions | |
| Recent Price: 37.00 Smart Investing & Trading Score: 17 | |
| Day Percent Change: 0.84% Day Change: 0.31 | |
| Week Change: -1.2% Year-to-date Change: -15.0% | |
| FC Links: Profile News Message Board | |
| Charts:- Daily , Weekly | |
| Add FC to Watchlist: View: Get Complete FC Trend Analysis ➞ | |
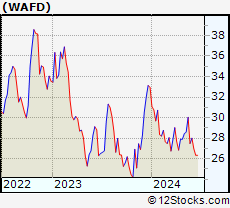 | WAFD Washington Federal, Inc. |
| Sector: Financials | |
| SubSector: Savings & Loans | |
| MarketCap: 2219.2 Millions | |
| Recent Price: 28.01 Smart Investing & Trading Score: 68 | |
| Day Percent Change: 1.74% Day Change: 0.48 | |
| Week Change: 1.89% Year-to-date Change: -15.0% | |
| WAFD Links: Profile News Message Board | |
| Charts:- Daily , Weekly | |
| Add WAFD to Watchlist: View: Get Complete WAFD Trend Analysis ➞ | |
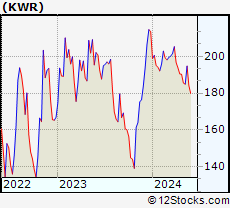 | KWR Quaker Chemical Corporation |
| Sector: Materials | |
| SubSector: Specialty Chemicals | |
| MarketCap: 2411.67 Millions | |
| Recent Price: 181.35 Smart Investing & Trading Score: 25 | |
| Day Percent Change: 1.35% Day Change: 2.42 | |
| Week Change: -1.47% Year-to-date Change: -15.0% | |
| KWR Links: Profile News Message Board | |
| Charts:- Daily , Weekly | |
| Add KWR to Watchlist: View: Get Complete KWR Trend Analysis ➞ | |
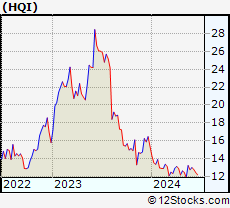 | HQI HireQuest, Inc. |
| Sector: Services & Goods | |
| SubSector: Staffing & Outsourcing Services | |
| MarketCap: 77 Millions | |
| Recent Price: 13.03 Smart Investing & Trading Score: 53 | |
| Day Percent Change: 0.70% Day Change: 0.09 | |
| Week Change: 1.96% Year-to-date Change: -15.1% | |
| HQI Links: Profile News Message Board | |
| Charts:- Daily , Weekly | |
| Add HQI to Watchlist: View: Get Complete HQI Trend Analysis ➞ | |
| Too many stocks? View smallcap stocks filtered by marketcap & sector |
| Marketcap: All SmallCap Stocks (default-no microcap), Large, Mid-Range, Small & MicroCap |
| Sector: Tech, Finance, Energy, Staples, Retail, Industrial, Materials, Utilities & Medical |
|
Best Stocks Today 12Stocks.com |
© 2024 12Stocks.com Terms & Conditions Privacy Contact Us
All Information Provided Only For Education And Not To Be Used For Investing or Trading. See Terms & Conditions


One More Thing ... Get Best Stocks Delivered Daily!
Never Ever Miss A Move With Our Top Ten Stocks Lists
Find Best Stocks In Any Market - Bull or Bear Market
Take A Peek At Our Top Ten Stocks Lists: Daily, Weekly, Year-to-Date & Top Trends
Find Best Stocks In Any Market - Bull or Bear Market
Take A Peek At Our Top Ten Stocks Lists: Daily, Weekly, Year-to-Date & Top Trends
Smallcap Stocks With Best Up Trends [0-bearish to 100-bullish]: Ambarella [100], TPI Composites[100], Hallador Energy[100], Aaron s[100], Sportsman s[100], Heron [100], Federal Signal[100], Newpark Resources[100], Infinera [100], CONSOL Energy[100], Clean Energy[100]
Best Smallcap Stocks Year-to-Date:
CareMax [504.12%], Janux [397.91%], Viking [234.74%], Summit [232.76%], Novavax [213.13%], Longboard [208.84%], Avidity Biosciences[197.12%], Stoke [177.95%], Super Micro[175.98%], Sweetgreen [172.12%], NuScale Power[170.7%] Best Smallcap Stocks This Week:
Summit [156.95%], Insmed [150.23%], Forward Air[36.25%], Ikena Oncology[35.11%], Orchestra BioMed[32%], Credo [30.55%], Arcturus [27.58%], Semler Scientific[25.94%], Hallador Energy[25.72%], Foot Locker[25.65%], CommScope Holding[24.14%] Best Smallcap Stocks Daily:
Ambarella [20.60%], Eyenovia [13.48%], Accuray [12.74%], Slair Broadcast[12.08%], TPI Composites[12.07%], Akoustis [12.04%], Emergent BioSolutions[11.98%], Hallador Energy[11.29%], Aaron s[9.99%], Cogint [9.88%], Trinseo S.A[9.43%]