
 Login Sign Up


| |||||
 |  | ||||

| 12Stocks.com Market Intelligence |
Best MidCap Stocks
|
| In a hurry? Mid Cap Stocks Lists: Performance Trends Table, Stock Charts
Sort midcap stocks: Daily, Weekly, Year-to-Date, Market Cap & Trends. Filter midcap stocks list by sector: Show all, Tech, Finance, Energy, Staples, Retail, Industrial, Materials, Utilities and HealthCare Filter midcap stocks list by size:All MidCap Large Mid-Range Small |
| 12Stocks.com Mid Cap Stocks Performances & Trends Daily | |||||||||
|
|  The overall Smart Investing & Trading Score is 83 (0-bearish to 100-bullish) which puts Mid Cap index in short term bullish trend. The Smart Investing & Trading Score from previous trading session is 56 and hence an improvement of trend.
| ||||||||
Here are the Smart Investing & Trading Scores of the most requested mid cap stocks at 12Stocks.com (click stock name for detailed review):
|


| 12Stocks.com: Top Performing Mid Cap Index Stocks | ||||||||||||||||||||||||||||||||||||||||||||||||
 The top performing Mid Cap Index stocks year to date are
Now, more recently, over last week, the top performing Mid Cap Index stocks on the move are


|
||||||||||||||||||||||||||||||||||||||||||||||||
| 12Stocks.com: Investing in Midcap Index with Stocks | |
|
The following table helps investors and traders sort through current performance and trends (as measured by Smart Investing & Trading Score) of various
stocks in the Midcap Index. Quick View: Move mouse or cursor over stock symbol (ticker) to view short-term technical chart and over stock name to view long term chart. Click on  to add stock symbol to your watchlist and to add stock symbol to your watchlist and  to view watchlist. Click on any ticker or stock name for detailed market intelligence report for that stock. to view watchlist. Click on any ticker or stock name for detailed market intelligence report for that stock. |
12Stocks.com Performance of Stocks in Midcap Index
| Ticker | Stock Name | Watchlist | Category | Recent Price | Smart Investing & Trading Score | Change % | Weekly Change% |
| MKC | McCormick & |   | Consumer Staples | 72.22 | 68 | 2.12% | 0.01% |
| ALSN | Allison Transmission | | Consumer Staples | 75.81 | 60 | 1.00% | 0.01% |
| LUV | Southwest Airlines | | Transports | 26.84 | 50 | 2.80% | 0.00% |
| PPG | PPG Industries | | Materials | 131.41 | 42 | 1.77% | -0.01% |
| IAC | IAC/InterActiveCorp | | Technology | 49.79 | 30 | 1.86% | -0.02% |
| HOLX | Hologic | | Health Care | 73.78 | 25 | 1.65% | -0.03% |
| MAN | Manpower | | Services & Goods | 74.62 | 61 | 1.91% | -0.05% |
| FAST | Fastenal | | Services & Goods | 65.98 | 32 | 1.73% | -0.06% |
| CINF | Cinnati Financial | | Financials | 117.58 | 71 | 1.19% | -0.08% |
| BJ | BJ s | | Services & Goods | 88.07 | 95 | 2.24% | -0.08% |
| BWA | BorgWarner | | Consumer Staples | 35.66 | 53 | 1.25% | -0.08% |
| WST | West Pharmaceutical | | Health Care | 331.41 | 32 | 0.70% | -0.08% |
| PFGC | Performance Food | | Services & Goods | 69.60 | 32 | 2.28% | -0.10% |
| INGR | Ingredion | | Consumer Staples | 117.58 | 58 | 0.84% | -0.10% |
| R | Ryder System | | Transports | 121.47 | 51 | 0.78% | -0.11% |
| BIO | Bio-Rad | | Health Care | 286.86 | 55 | 1.72% | -0.12% |
| STAG | STAG Industrial | | Financials | 35.06 | 42 | 1.21% | -0.14% |
| SOFI | SoFi Technologies | | Financials | 6.90 | 28 | -0.14% | -0.14% |
| FNB | F.N.B | | Financials | 13.77 | 61 | 1.03% | -0.15% |
| PKG | Packaging | | Consumer Staples | 183.49 | 88 | 1.11% | -0.15% |
| IDA | IDACORP | | Utilities | 95.47 | 68 | 2.56% | -0.15% |
| OC | Owens Corning | | Industrials | 181.07 | 93 | 1.60% | -0.15% |
| YUM | Yum! | | Services & Goods | 137.43 | 60 | 1.92% | -0.16% |
| LII | Lennox | | Industrials | 502.60 | 88 | 1.73% | -0.16% |
| ARW | Arrow Electronics | | Services & Goods | 131.31 | 88 | 0.58% | -0.16% |
| For chart view version of above stock list: Chart View ➞ 0 - 25 , 25 - 50 , 50 - 75 , 75 - 100 , 100 - 125 , 125 - 150 , 150 - 175 , 175 - 200 , 200 - 225 , 225 - 250 , 250 - 275 , 275 - 300 , 300 - 325 , 325 - 350 , 350 - 375 , 375 - 400 , 400 - 425 , 425 - 450 , 450 - 475 , 475 - 500 , 500 - 525 , 525 - 550 , 550 - 575 , 575 - 600 , 600 - 625 , 625 - 650 , 650 - 675 , 675 - 700 , 700 - 725 , 725 - 750 , 750 - 775 | ||
 | Click To Change The Sort Order: By Market Cap or Company Size Performance: Year-to-date, Week and Day |  |
|
Get the most comprehensive stock market coverage daily at 12Stocks.com ➞ Best Stocks Today ➞ Best Stocks Weekly ➞ Best Stocks Year-to-Date ➞ Best Stocks Trends ➞  Best Stocks Today 12Stocks.com Best Nasdaq Stocks ➞ Best S&P 500 Stocks ➞ Best Tech Stocks ➞ Best Biotech Stocks ➞ |
| Detailed Overview of Midcap Stocks |
| Midcap Technical Overview, Leaders & Laggards, Top Midcap ETF Funds & Detailed Midcap Stocks List, Charts, Trends & More |
| Midcap: Technical Analysis, Trends & YTD Performance | |
| MidCap segment as represented by
MDY, an exchange-traded fund [ETF], holds basket of about four hundred midcap stocks from across all major sectors of the US stock market. The midcap index (contains stocks like Green Mountain Coffee Roasters and Tractor Supply Company) is up by 7.65% and is currently underperforming the overall market by -2.14% year-to-date. Below is a quick view of technical charts and trends: | |
 MDY Weekly Chart |
|
| Long Term Trend: Very Good | |
| Medium Term Trend: Good | |
 MDY Daily Chart |
|
| Short Term Trend: Very Good | |
| Overall Trend Score: 83 | |
| YTD Performance: 7.65% | |
| **Trend Scores & Views Are Only For Educational Purposes And Not For Investing | |
| 12Stocks.com: Investing in Midcap Index using Exchange Traded Funds | |
|
The following table shows list of key exchange traded funds (ETF) that
help investors track Midcap index. The following list also includes leveraged ETF funds that track twice or thrice the daily returns of Midcap indices. Short or inverse ETF funds move in the opposite direction to the index they track and are useful during market pullbacks or during bear markets. Quick View: Move mouse or cursor over ETF symbol (ticker) to view short-term technical chart and over ETF name to view long term chart. Click on ticker or stock name for detailed view. Click on to add stock symbol to your watchlist and to view watchlist. |
12Stocks.com List of ETFs that track Midcap Index
| Ticker | ETF Name | Watchlist | Recent Price | Smart Investing & Trading Score | Change % | Week % | Year-to-date % |
| IJH | iShares Core S&P Mid-Cap | | 59.68 | 83 | 1.31 | 0.27 | 7.67% |
| MDY | SPDR S&P MidCap 400 ETF | | 546.18 | 83 | 1.32 | 0.29 | 7.65% |
| IWR | iShares Russell Mid-Cap | | 81.91 | 71 | 0.91 | -0.65 | 5.38% |
| IWP | iShares Russell Mid-Cap Growth | | 108.67 | 8 | 0.21 | -2.18 | 4.03% |
| IWS | iShares Russell Mid-Cap Value | | 123.18 | 83 | 1.27 | -0.02 | 5.92% |
| IJK | iShares S&P Mid-Cap 400 Growth | | 88.41 | 46 | -0.32 | -1.5 | 11.6% |
| UMDD | ProShares UltraPro MidCap400 | | 25.80 | 83 | 3.74 | 0.49 | 15.59% |
| IJJ | iShares S&P Mid-Cap 400 Value | | 114.94 | 63 | 0.45 | -0.39 | 0.79% |
| MYY | ProShares Short MidCap400 | | 20.24 | 25 | -1.20 | -0.26 | -5.64% |
| SMDD | ProShares UltraPro Short MidCap400 | | 10.84 | 17 | -3.99 | -0.66 | -19.49% |
| XMLV | PowerShares S&P MidCap Low Volatil ETF | | 55.65 | 61 | 0.67 | -0.47 | 4.64% |
| MVV | ProShares Ultra MidCap400 | | 63.30 | 63 | 0.08 | -2.01 | 9.35% |
| MZZ | ProShares UltraShort MidCap400 | | 11.08 | 27 | -2.35 | -0.36 | -11.83% |
| 12Stocks.com: Charts, Trends, Fundamental Data and Performances of MidCap Stocks | |
|
We now take in-depth look at all MidCap stocks including charts, multi-period performances and overall trends (as measured by Smart Investing & Trading Score). One can sort MidCap stocks (click link to choose) by Daily, Weekly and by Year-to-Date performances. Also, one can sort by size of the company or by market capitalization. |
| Select Your Default Chart Type: | |||||
| |||||
| Click on stock symbol or name for detailed view. Click on to add stock symbol to your watchlist and to view watchlist. Quick View: Move mouse or cursor over "Daily" to quickly view daily technical stock chart and over "Weekly" to view weekly technical stock chart. | |||||

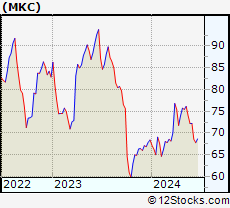 | MKC McCormick & Company, Incorporated |
| Sector: Consumer Staples | |
| SubSector: Processed & Packaged Goods | |
| MarketCap: 18522.8 Millions | |
| Recent Price: 72.22 Smart Investing & Trading Score: 68 | |
| Day Percent Change: 2.12% Day Change: 1.50 | |
| Week Change: 0.01% Year-to-date Change: 5.6% | |
| MKC Links: Profile News Message Board | |
| Charts:- Daily , Weekly | |
| Add MKC to Watchlist: View: Get Complete MKC Trend Analysis ➞ | |
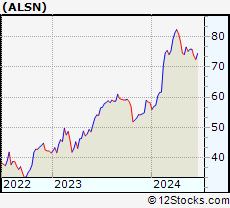 | ALSN Allison Transmission Holdings, Inc. |
| Sector: Consumer Staples | |
| SubSector: Auto Parts | |
| MarketCap: 3785.99 Millions | |
| Recent Price: 75.81 Smart Investing & Trading Score: 60 | |
| Day Percent Change: 1.00% Day Change: 0.75 | |
| Week Change: 0.01% Year-to-date Change: 30.4% | |
| ALSN Links: Profile News Message Board | |
| Charts:- Daily , Weekly | |
| Add ALSN to Watchlist: View: Get Complete ALSN Trend Analysis ➞ | |
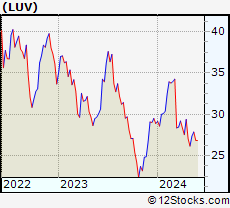 | LUV Southwest Airlines Co. |
| Sector: Transports | |
| SubSector: Regional Airlines | |
| MarketCap: 19463.3 Millions | |
| Recent Price: 26.84 Smart Investing & Trading Score: 50 | |
| Day Percent Change: 2.80% Day Change: 0.73 | |
| Week Change: 0% Year-to-date Change: -7.1% | |
| LUV Links: Profile News Message Board | |
| Charts:- Daily , Weekly | |
| Add LUV to Watchlist: View: Get Complete LUV Trend Analysis ➞ | |
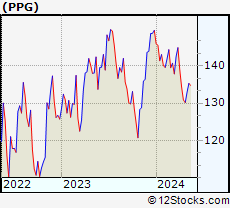 | PPG PPG Industries, Inc. |
| Sector: Materials | |
| SubSector: Specialty Chemicals | |
| MarketCap: 20285.5 Millions | |
| Recent Price: 131.41 Smart Investing & Trading Score: 42 | |
| Day Percent Change: 1.77% Day Change: 2.29 | |
| Week Change: -0.01% Year-to-date Change: -12.1% | |
| PPG Links: Profile News Message Board | |
| Charts:- Daily , Weekly | |
| Add PPG to Watchlist: View: Get Complete PPG Trend Analysis ➞ | |
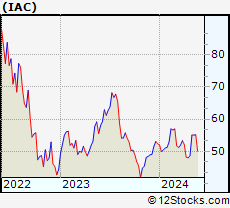 | IAC IAC/InterActiveCorp |
| Sector: Technology | |
| SubSector: Internet Information Providers | |
| MarketCap: 12561.2 Millions | |
| Recent Price: 49.79 Smart Investing & Trading Score: 30 | |
| Day Percent Change: 1.86% Day Change: 0.91 | |
| Week Change: -0.02% Year-to-date Change: -4.9% | |
| IAC Links: Profile News Message Board | |
| Charts:- Daily , Weekly | |
| Add IAC to Watchlist: View: Get Complete IAC Trend Analysis ➞ | |
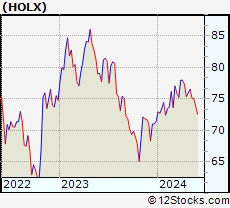 | HOLX Hologic, Inc. |
| Sector: Health Care | |
| SubSector: Medical Instruments & Supplies | |
| MarketCap: 9075.2 Millions | |
| Recent Price: 73.78 Smart Investing & Trading Score: 25 | |
| Day Percent Change: 1.65% Day Change: 1.20 | |
| Week Change: -0.03% Year-to-date Change: 3.3% | |
| HOLX Links: Profile News Message Board | |
| Charts:- Daily , Weekly | |
| Add HOLX to Watchlist: View: Get Complete HOLX Trend Analysis ➞ | |
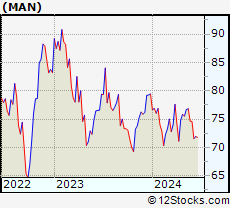 | MAN ManpowerGroup Inc. |
| Sector: Services & Goods | |
| SubSector: Staffing & Outsourcing Services | |
| MarketCap: 3436.28 Millions | |
| Recent Price: 74.62 Smart Investing & Trading Score: 61 | |
| Day Percent Change: 1.91% Day Change: 1.40 | |
| Week Change: -0.05% Year-to-date Change: -6.1% | |
| MAN Links: Profile News Message Board | |
| Charts:- Daily , Weekly | |
| Add MAN to Watchlist: View: Get Complete MAN Trend Analysis ➞ | |
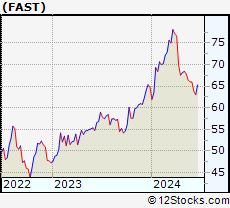 | FAST Fastenal Company |
| Sector: Services & Goods | |
| SubSector: Industrial Equipment Wholesale | |
| MarketCap: 17609.9 Millions | |
| Recent Price: 65.98 Smart Investing & Trading Score: 32 | |
| Day Percent Change: 1.73% Day Change: 1.12 | |
| Week Change: -0.06% Year-to-date Change: 1.9% | |
| FAST Links: Profile News Message Board | |
| Charts:- Daily , Weekly | |
| Add FAST to Watchlist: View: Get Complete FAST Trend Analysis ➞ | |
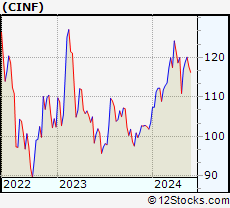 | CINF Cincinnati Financial Corporation |
| Sector: Financials | |
| SubSector: Property & Casualty Insurance | |
| MarketCap: 13637 Millions | |
| Recent Price: 117.58 Smart Investing & Trading Score: 71 | |
| Day Percent Change: 1.19% Day Change: 1.38 | |
| Week Change: -0.08% Year-to-date Change: 13.7% | |
| CINF Links: Profile News Message Board | |
| Charts:- Daily , Weekly | |
| Add CINF to Watchlist: View: Get Complete CINF Trend Analysis ➞ | |
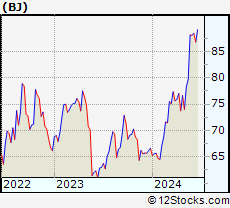 | BJ BJ s Wholesale Club Holdings, Inc. |
| Sector: Services & Goods | |
| SubSector: Discount, Variety Stores | |
| MarketCap: 3346.02 Millions | |
| Recent Price: 88.07 Smart Investing & Trading Score: 95 | |
| Day Percent Change: 2.24% Day Change: 1.93 | |
| Week Change: -0.08% Year-to-date Change: 32.1% | |
| BJ Links: Profile News Message Board | |
| Charts:- Daily , Weekly | |
| Add BJ to Watchlist: View: Get Complete BJ Trend Analysis ➞ | |
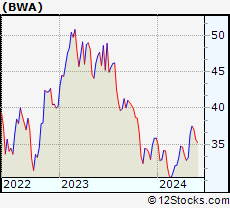 | BWA BorgWarner Inc. |
| Sector: Consumer Staples | |
| SubSector: Auto Parts | |
| MarketCap: 4604.09 Millions | |
| Recent Price: 35.66 Smart Investing & Trading Score: 53 | |
| Day Percent Change: 1.25% Day Change: 0.44 | |
| Week Change: -0.08% Year-to-date Change: -0.5% | |
| BWA Links: Profile News Message Board | |
| Charts:- Daily , Weekly | |
| Add BWA to Watchlist: View: Get Complete BWA Trend Analysis ➞ | |
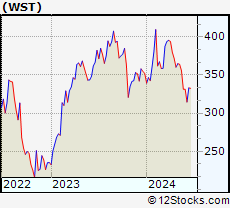 | WST West Pharmaceutical Services, Inc. |
| Sector: Health Care | |
| SubSector: Medical Instruments & Supplies | |
| MarketCap: 9989 Millions | |
| Recent Price: 331.41 Smart Investing & Trading Score: 32 | |
| Day Percent Change: 0.70% Day Change: 2.29 | |
| Week Change: -0.08% Year-to-date Change: -5.9% | |
| WST Links: Profile News Message Board | |
| Charts:- Daily , Weekly | |
| Add WST to Watchlist: View: Get Complete WST Trend Analysis ➞ | |
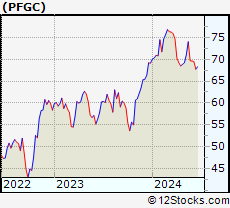 | PFGC Performance Food Group Company |
| Sector: Services & Goods | |
| SubSector: Restaurants | |
| MarketCap: 2457.5 Millions | |
| Recent Price: 69.60 Smart Investing & Trading Score: 32 | |
| Day Percent Change: 2.28% Day Change: 1.55 | |
| Week Change: -0.1% Year-to-date Change: 0.7% | |
| PFGC Links: Profile News Message Board | |
| Charts:- Daily , Weekly | |
| Add PFGC to Watchlist: View: Get Complete PFGC Trend Analysis ➞ | |
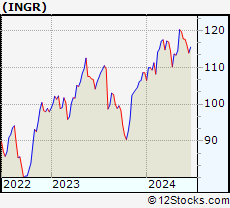 | INGR Ingredion Incorporated |
| Sector: Consumer Staples | |
| SubSector: Processed & Packaged Goods | |
| MarketCap: 5064.18 Millions | |
| Recent Price: 117.58 Smart Investing & Trading Score: 58 | |
| Day Percent Change: 0.84% Day Change: 0.98 | |
| Week Change: -0.1% Year-to-date Change: 8.3% | |
| INGR Links: Profile News Message Board | |
| Charts:- Daily , Weekly | |
| Add INGR to Watchlist: View: Get Complete INGR Trend Analysis ➞ | |
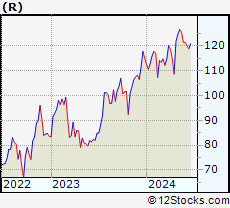 | R Ryder System, Inc. |
| Sector: Transports | |
| SubSector: Rental & Leasing Services | |
| MarketCap: 1550.94 Millions | |
| Recent Price: 121.47 Smart Investing & Trading Score: 51 | |
| Day Percent Change: 0.78% Day Change: 0.94 | |
| Week Change: -0.11% Year-to-date Change: 5.6% | |
| R Links: Profile News Message Board | |
| Charts:- Daily , Weekly | |
| Add R to Watchlist: View: Get Complete R Trend Analysis ➞ | |
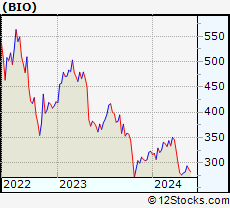 | BIO Bio-Rad Laboratories, Inc. |
| Sector: Health Care | |
| SubSector: Medical Laboratories & Research | |
| MarketCap: 10660 Millions | |
| Recent Price: 286.86 Smart Investing & Trading Score: 55 | |
| Day Percent Change: 1.72% Day Change: 4.85 | |
| Week Change: -0.12% Year-to-date Change: -11.2% | |
| BIO Links: Profile News Message Board | |
| Charts:- Daily , Weekly | |
| Add BIO to Watchlist: View: Get Complete BIO Trend Analysis ➞ | |
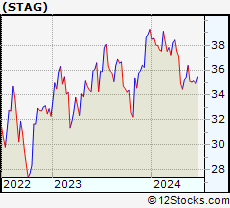 | STAG STAG Industrial, Inc. |
| Sector: Financials | |
| SubSector: REIT - Industrial | |
| MarketCap: 3767.49 Millions | |
| Recent Price: 35.06 Smart Investing & Trading Score: 42 | |
| Day Percent Change: 1.21% Day Change: 0.42 | |
| Week Change: -0.14% Year-to-date Change: -10.7% | |
| STAG Links: Profile News Message Board | |
| Charts:- Daily , Weekly | |
| Add STAG to Watchlist: View: Get Complete STAG Trend Analysis ➞ | |
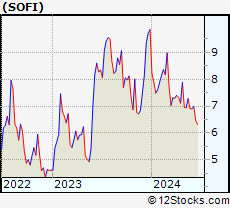 | SOFI SoFi Technologies, Inc. |
| Sector: Financials | |
| SubSector: Credit Services | |
| MarketCap: 7990 Millions | |
| Recent Price: 6.90 Smart Investing & Trading Score: 28 | |
| Day Percent Change: -0.14% Day Change: -0.01 | |
| Week Change: -0.14% Year-to-date Change: -30.0% | |
| SOFI Links: Profile News Message Board | |
| Charts:- Daily , Weekly | |
| Add SOFI to Watchlist: View: Get Complete SOFI Trend Analysis ➞ | |
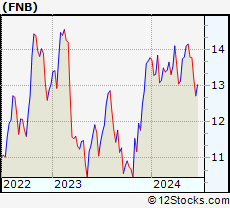 | FNB F.N.B. Corporation |
| Sector: Financials | |
| SubSector: Regional - Southeast Banks | |
| MarketCap: 2445.55 Millions | |
| Recent Price: 13.77 Smart Investing & Trading Score: 61 | |
| Day Percent Change: 1.03% Day Change: 0.14 | |
| Week Change: -0.15% Year-to-date Change: 0.0% | |
| FNB Links: Profile News Message Board | |
| Charts:- Daily , Weekly | |
| Add FNB to Watchlist: View: Get Complete FNB Trend Analysis ➞ | |
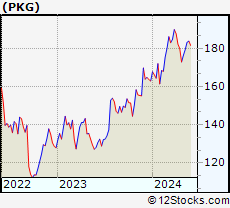 | PKG Packaging Corporation of America |
| Sector: Consumer Staples | |
| SubSector: Packaging & Containers | |
| MarketCap: 8963 Millions | |
| Recent Price: 183.49 Smart Investing & Trading Score: 88 | |
| Day Percent Change: 1.11% Day Change: 2.01 | |
| Week Change: -0.15% Year-to-date Change: 12.6% | |
| PKG Links: Profile News Message Board | |
| Charts:- Daily , Weekly | |
| Add PKG to Watchlist: View: Get Complete PKG Trend Analysis ➞ | |
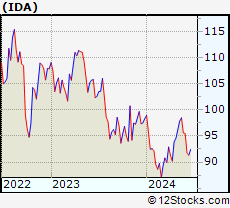 | IDA IDACORP, Inc. |
| Sector: Utilities | |
| SubSector: Electric Utilities | |
| MarketCap: 4340.14 Millions | |
| Recent Price: 95.47 Smart Investing & Trading Score: 68 | |
| Day Percent Change: 2.56% Day Change: 2.38 | |
| Week Change: -0.15% Year-to-date Change: -2.9% | |
| IDA Links: Profile News Message Board | |
| Charts:- Daily , Weekly | |
| Add IDA to Watchlist: View: Get Complete IDA Trend Analysis ➞ | |
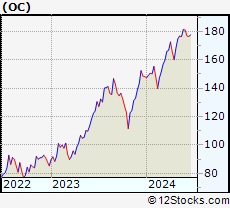 | OC Owens Corning |
| Sector: Industrials | |
| SubSector: General Building Materials | |
| MarketCap: 3686.73 Millions | |
| Recent Price: 181.07 Smart Investing & Trading Score: 93 | |
| Day Percent Change: 1.60% Day Change: 2.85 | |
| Week Change: -0.15% Year-to-date Change: 22.2% | |
| OC Links: Profile News Message Board | |
| Charts:- Daily , Weekly | |
| Add OC to Watchlist: View: Get Complete OC Trend Analysis ➞ | |
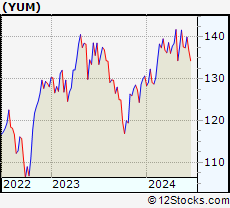 | YUM Yum! Brands, Inc. |
| Sector: Services & Goods | |
| SubSector: Restaurants | |
| MarketCap: 18033.3 Millions | |
| Recent Price: 137.43 Smart Investing & Trading Score: 60 | |
| Day Percent Change: 1.92% Day Change: 2.59 | |
| Week Change: -0.16% Year-to-date Change: 5.2% | |
| YUM Links: Profile News Message Board | |
| Charts:- Daily , Weekly | |
| Add YUM to Watchlist: View: Get Complete YUM Trend Analysis ➞ | |
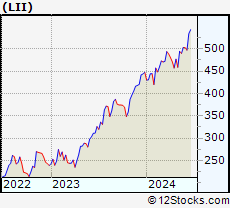 | LII Lennox International Inc. |
| Sector: Industrials | |
| SubSector: Diversified Machinery | |
| MarketCap: 7720.66 Millions | |
| Recent Price: 502.60 Smart Investing & Trading Score: 88 | |
| Day Percent Change: 1.73% Day Change: 8.54 | |
| Week Change: -0.16% Year-to-date Change: 12.3% | |
| LII Links: Profile News Message Board | |
| Charts:- Daily , Weekly | |
| Add LII to Watchlist: View: Get Complete LII Trend Analysis ➞ | |
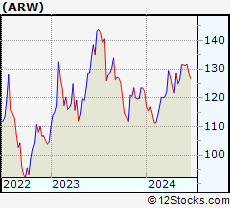 | ARW Arrow Electronics, Inc. |
| Sector: Services & Goods | |
| SubSector: Electronics Wholesale | |
| MarketCap: 4155.03 Millions | |
| Recent Price: 131.31 Smart Investing & Trading Score: 88 | |
| Day Percent Change: 0.58% Day Change: 0.76 | |
| Week Change: -0.16% Year-to-date Change: 7.4% | |
| ARW Links: Profile News Message Board | |
| Charts:- Daily , Weekly | |
| Add ARW to Watchlist: View: Get Complete ARW Trend Analysis ➞ | |
| For tabular summary view of above stock list: Summary View ➞ 0 - 25 , 25 - 50 , 50 - 75 , 75 - 100 , 100 - 125 , 125 - 150 , 150 - 175 , 175 - 200 , 200 - 225 , 225 - 250 , 250 - 275 , 275 - 300 , 300 - 325 , 325 - 350 , 350 - 375 , 375 - 400 , 400 - 425 , 425 - 450 , 450 - 475 , 475 - 500 , 500 - 525 , 525 - 550 , 550 - 575 , 575 - 600 , 600 - 625 , 625 - 650 , 650 - 675 , 675 - 700 , 700 - 725 , 725 - 750 , 750 - 775 | ||
| Click To Change The Sort Order: By Market Cap or Company Size Performance: Year-to-date, Week and Day | |
| Select Chart Type: | ||
|
Best Stocks Today 12Stocks.com |
© 2024 12Stocks.com Terms & Conditions Privacy Contact Us
All Information Provided Only For Education And Not To Be Used For Investing or Trading. See Terms & Conditions


One More Thing ... Get Best Stocks Delivered Daily!
Never Ever Miss A Move With Our Top Ten Stocks Lists
Find Best Stocks In Any Market - Bull or Bear Market
Take A Peek At Our Top Ten Stocks Lists: Daily, Weekly, Year-to-Date & Top Trends
Find Best Stocks In Any Market - Bull or Bear Market
Take A Peek At Our Top Ten Stocks Lists: Daily, Weekly, Year-to-Date & Top Trends
Midcap Stocks With Best Up Trends [0-bearish to 100-bullish]: Gap [100], Boston Beer[100], Nordstrom [100], Best Buy[100], NetApp [100], HEICO [100], Edison [100], Otis Worldwide[100], Clearway Energy[100], CenterPoint Energy[100], Ventas [100]
Best Midcap Stocks Year-to-Date:
Vistra Energy[157.22%], CAVA [112.86%], AppLovin [104.75%], Constellation Energy[85.51%], EMCOR [80.41%], Tenet [78.93%], ShockWave Medical[75.67%], Tandem Diabetes[73.23%], Natera [70.07%], Pure Storage[69.07%], Crocs [66.62%] Best Midcap Stocks This Week:
Gap [38.04%], GameStop [21.79%], Boston Beer[20.3%], DICK S[19.83%], Burlington Stores[19.8%], Best Buy[18.63%], Peloton Interactive[15.56%], Olaplex [13.38%], Marathon Oil[13.3%], CAVA [11.6%], HP [11.45%] Best Midcap Stocks Daily:
Gap [28.60%], Boston Beer[22.33%], Penn National[19.62%], Elastic N.V[11.67%], Caesars Entertainment[11.65%], Olaplex [9.88%], Zscaler [8.50%], V.F [7.70%], Medical Properties[7.20%], Kohl s[6.52%], Victorias Secret[5.56%]