
 Login Sign Up


| |||||
 |  | ||||

| 12Stocks.com Market Intelligence |
Best Financial Stocks
| In a hurry? Financial Stocks Lists: Performance Trends Table, Stock Charts
Sort Financial stocks: Daily, Weekly, Year-to-Date, Market Cap & Trends. Filter Financial stocks list by size:All Financial Large Mid-Range Small & MicroCap |
| 12Stocks.com Financial Stocks Performances & Trends Daily | |||||||||
|
|  The overall Smart Investing & Trading Score is 78 (0-bearish to 100-bullish) which puts Financial sector in short term neutral to bullish trend. The Smart Investing & Trading Score from previous trading session is 46 and hence an improvement of trend.
| ||||||||
Here are the Smart Investing & Trading Scores of the most requested Financial stocks at 12Stocks.com (click stock name for detailed review):
|


| 12Stocks.com: Investing in Financial sector with Stocks | |
|
The following table helps investors and traders sort through current performance and trends (as measured by Smart Investing & Trading Score) of various
stocks in the Financial sector. Quick View: Move mouse or cursor over stock symbol (ticker) to view short-term Technical chart and over stock name to view long term chart. Click on  to add stock symbol to your watchlist and to add stock symbol to your watchlist and  to view watchlist. Click on any ticker or stock name for detailed market intelligence report for that stock. to view watchlist. Click on any ticker or stock name for detailed market intelligence report for that stock. |
12Stocks.com Performance of Stocks in Financial Sector
| Ticker | Stock Name | Watchlist | Category | Recent Price | Smart Investing & Trading Score | Change % | YTD Change% |
| FIBK | First Interstate |   | Regional Banks | 26.54 | 61 | 0.11 | -13.69% |
| ETX | Eaton Vance | | Asset Mgmt | 18.34 | 66 | 0.11 | 5.77% |
| SIGIP | Selective Insurance | | Insurance Property & Casualty | 18.28 | 27 | 0.11 | 4.94% |
| DJUN | FT Cboe | | Exchange Traded Fund | 40.63 | 78 | 0.11 | 7.07% |
| SUI | Sun Communities | | REIT | 117.99 | 60 | 0.10 | -11.72% |
| BNY | BlackRock New | | Closed-End Fund - Debt | 10.53 | 0 | 0.10 | 0.00% |
| CCNE | CNB | | Regional Banks | 19.40 | 17 | 0.10 | -14.12% |
| SFBS | ServisFirst Bancshares | | Foreign Banks | 61.80 | 35 | 0.10 | -7.25% |
| DMB | BNY | | Asset Mgmt | 10.12 | 35 | 0.10 | -1.84% |
| CVII | Churchill Capital | | SPAC | 10.74 | 34 | 0.10 | 2.29% |
| CFFI | C&F | | Regional Banks | 43.84 | 32 | 0.09 | -35.71% |
| HRZN | Horizon Technology | | Asset Mgmt | 11.59 | 35 | 0.09 | -12.00% |
| BCSA | Blockchain Coinvestors | | SPAC | 11.16 | 50 | 0.09 | 2.67% |
| JWSM | Jaws Mustang | | SPAC | 11.10 | 68 | 0.09 | 0.63% |
| IIF | Morgan Stanley | | Closed-End Fund - Foreign | 23.99 | 69 | 0.08 | 11.74% |
| IIM | Invesco Value | | Closed-End Fund - Debt | 11.92 | 75 | 0.08 | 1.62% |
| EBMT | Eagle Bancorp | | Regional Banks | 13.27 | 75 | 0.08 | -15.96% |
| OXLCM | Oxford Lane | | Asset Mgmt | 24.99 | 49 | 0.08 | 0.36% |
| CIVB | Civista Bancshares | | Regional Banks | 14.33 | 35 | 0.07 | -22.29% |
| MCB | Metropolitan Bank | | Regional Banks | 42.05 | 71 | 0.07 | -24.07% |
| OXLCO | Oxford Lane | | Asset Mgmt | 22.31 | 55 | 0.07 | 1.21% |
| NAPR | Innovator Nasdaq | | Exchange Traded Fund | 46.24 | 56 | 0.06 | 4.03% |
| TECB | iShares U.S. | | Exchange Traded Fund | 47.31 | 25 | 0.06 | 10.10% |
| EVE | EVe Mobility | | SPAC | 11.04 | 58 | 0.06 | 2.10% |
| THFF | First | | Regional Banks | 37.04 | 48 | 0.05 | -13.92% |
| For chart view version of above stock list: Chart View ➞ 0 - 25 , 25 - 50 , 50 - 75 , 75 - 100 , 100 - 125 , 125 - 150 , 150 - 175 , 175 - 200 , 200 - 225 , 225 - 250 , 250 - 275 , 275 - 300 , 300 - 325 , 325 - 350 , 350 - 375 , 375 - 400 , 400 - 425 , 425 - 450 , 450 - 475 , 475 - 500 , 500 - 525 , 525 - 550 , 550 - 575 , 575 - 600 , 600 - 625 , 625 - 650 , 650 - 675 , 675 - 700 , 700 - 725 , 725 - 750 , 750 - 775 , 775 - 800 , 800 - 825 , 825 - 850 , 850 - 875 , 875 - 900 , 900 - 925 , 925 - 950 , 950 - 975 , 975 - 1000 , 1000 - 1025 , 1025 - 1050 , 1050 - 1075 , 1075 - 1100 , 1100 - 1125 , 1125 - 1150 , 1150 - 1175 , 1175 - 1200 , 1200 - 1225 | ||
 | Click To Change The Sort Order: By Market Cap or Company Size Performance: Year-to-date, Week and Day |  |
|
Get the most comprehensive stock market coverage daily at 12Stocks.com ➞ Best Stocks Today ➞ Best Stocks Weekly ➞ Best Stocks Year-to-Date ➞ Best Stocks Trends ➞  Best Stocks Today 12Stocks.com Best Nasdaq Stocks ➞ Best S&P 500 Stocks ➞ Best Tech Stocks ➞ Best Biotech Stocks ➞ |
| Detailed Overview of Financial Stocks |
| Financial Technical Overview, Leaders & Laggards, Top Financial ETF Funds & Detailed Financial Stocks List, Charts, Trends & More |
| Financial Sector: Technical Analysis, Trends & YTD Performance | |
| Financial sector is composed of stocks
from banks, brokers, insurance, REITs
and services subsectors. Financial sector, as represented by XLF, an exchange-traded fund [ETF] that holds basket of Financial stocks (e.g, Bank of America, Goldman Sachs) is up by 10.74% and is currently outperforming the overall market by 0.95% year-to-date. Below is a quick view of Technical charts and trends: |
|
 XLF Weekly Chart |
|
| Long Term Trend: Very Good | |
| Medium Term Trend: Good | |
 XLF Daily Chart |
|
| Short Term Trend: Very Good | |
| Overall Trend Score: 78 | |
| YTD Performance: 10.74% | |
| **Trend Scores & Views Are Only For Educational Purposes And Not For Investing | |
| 12Stocks.com: Top Performing Financial Sector Stocks | ||||||||||||||||||||||||||||||||||||||||||||||||
 The top performing Financial sector stocks year to date are
Now, more recently, over last week, the top performing Financial sector stocks on the move are


|
||||||||||||||||||||||||||||||||||||||||||||||||
| 12Stocks.com: Investing in Financial Sector using Exchange Traded Funds | |
|
The following table shows list of key exchange traded funds (ETF) that
help investors track Financial Index. For detailed view, check out our ETF Funds section of our website. Quick View: Move mouse or cursor over ETF symbol (ticker) to view short-term Technical chart and over ETF name to view long term chart. Click on ticker or stock name for detailed view. Click on to add stock symbol to your watchlist and to view watchlist. |
12Stocks.com List of ETFs that track Financial Index
| Ticker | ETF Name | Watchlist | Recent Price | Smart Investing & Trading Score | Change % | Week % | Year-to-date % |
| XLF | Financial | | 41.64 | 78 | 1.46 | 0.07 | 10.74% |
| IAI | Broker-Dealers & Secs | | 116.64 | 58 | 0.53 | -1.91 | 7.47% |
| IYF | Financials | | 95.25 | 78 | 1.32 | 0.03 | 11.52% |
| IYG | Financial Services | | 65.74 | 71 | 1.14 | -0.33 | 10.05% |
| KRE | Regional Banking | | 48.85 | 61 | 1.41 | -0.14 | -6.83% |
| IXG | Global Financials | | 87.05 | 76 | 0.80 | -0.54 | 10.77% |
| VFH | Financials | | 101.01 | 78 | 1.28 | -0.12 | 9.48% |
| KBE | Bank | | 46.23 | 68 | 1.34 | 0 | 0.46% |
| FAS | Financial Bull 3X | | 105.34 | 78 | 4.16 | -0.02 | 27.45% |
| FAZ | Financial Bear 3X | | 10.35 | 17 | -4.08 | -0.1 | -24.29% |
| UYG | Financials | | 65.65 | 78 | 3.19 | -0.03 | 18.93% |
| IAT | Regional Banks | | 41.90 | 68 | 1.87 | 0 | 0.14% |
| KIE | Insurance | | 51.16 | 78 | 1.11 | 0.69 | 13.14% |
| PSCF | SmallCap Financials | | 47.14 | 53 | 1.59 | -0.79 | -4.14% |
| EUFN | Europe Financials | | 24.18 | 100 | 1.02 | 0.71 | 15.36% |
| PGF | Financial Preferred | | 14.79 | 55 | 1.09 | 0.68 | 1.44% |
| 12Stocks.com: Charts, Trends, Fundamental Data and Performances of Financial Stocks | |
|
We now take in-depth look at all Financial stocks including charts, multi-period performances and overall trends (as measured by Smart Investing & Trading Score). One can sort Financial stocks (click link to choose) by Daily, Weekly and by Year-to-Date performances. Also, one can sort by size of the company or by market capitalization. |
| Select Your Default Chart Type: | |||||
| |||||
| Click on stock symbol or name for detailed view. Click on to add stock symbol to your watchlist and to view watchlist. Quick View: Move mouse or cursor over "Daily" to quickly view daily Technical stock chart and over "Weekly" to view weekly Technical stock chart. | |||||

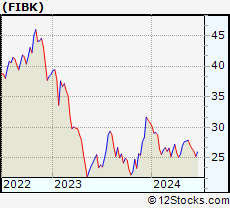 | FIBK First Interstate BancSystem, Inc. |
| Sector: Financials | |
| SubSector: Regional - Pacific Banks | |
| MarketCap: 1797.69 Millions | |
| Recent Price: 26.54 Smart Investing & Trading Score: 61 | |
| Day Percent Change: 0.11% Day Change: 0.03 | |
| Week Change: -2.1% Year-to-date Change: -13.7% | |
| FIBK Links: Profile News Message Board | |
| Charts:- Daily , Weekly | |
| Add FIBK to Watchlist: View: Get Complete FIBK Trend Analysis ➞ | |
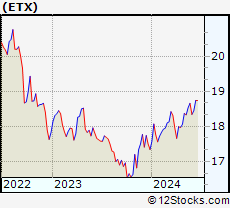 | ETX Eaton Vance Municipal Income 2028 Term Trust |
| Sector: Financials | |
| SubSector: Asset Management | |
| MarketCap: 199.103 Millions | |
| Recent Price: 18.34 Smart Investing & Trading Score: 66 | |
| Day Percent Change: 0.11% Day Change: 0.02 | |
| Week Change: -1.71% Year-to-date Change: 5.8% | |
| ETX Links: Profile News Message Board | |
| Charts:- Daily , Weekly | |
| Add ETX to Watchlist: View: Get Complete ETX Trend Analysis ➞ | |
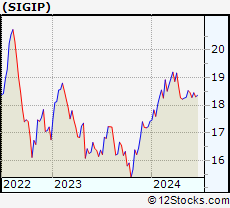 | SIGIP Selective Insurance Group, Inc. |
| Sector: Financials | |
| SubSector: Insurance Property & Casualty | |
| MarketCap: 60157 Millions | |
| Recent Price: 18.28 Smart Investing & Trading Score: 27 | |
| Day Percent Change: 0.11% Day Change: 0.02 | |
| Week Change: -0.98% Year-to-date Change: 4.9% | |
| SIGIP Links: Profile News Message Board | |
| Charts:- Daily , Weekly | |
| Add SIGIP to Watchlist: View: Get Complete SIGIP Trend Analysis ➞ | |
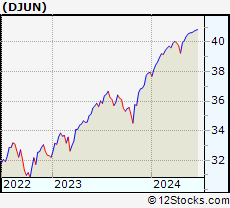 | DJUN FT Cboe Vest US Eq Deep Buffer ETF June |
| Sector: Financials | |
| SubSector: Exchange Traded Fund | |
| MarketCap: 60157 Millions | |
| Recent Price: 40.63 Smart Investing & Trading Score: 78 | |
| Day Percent Change: 0.11% Day Change: 0.04 | |
| Week Change: 0.03% Year-to-date Change: 7.1% | |
| DJUN Links: Profile News Message Board | |
| Charts:- Daily , Weekly | |
| Add DJUN to Watchlist: View: Get Complete DJUN Trend Analysis ➞ | |
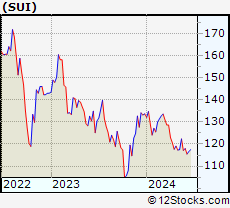 | SUI Sun Communities, Inc. |
| Sector: Financials | |
| SubSector: REIT - Residential | |
| MarketCap: 11280.5 Millions | |
| Recent Price: 117.99 Smart Investing & Trading Score: 60 | |
| Day Percent Change: 0.10% Day Change: 0.12 | |
| Week Change: 0.72% Year-to-date Change: -11.7% | |
| SUI Links: Profile News Message Board | |
| Charts:- Daily , Weekly | |
| Add SUI to Watchlist: View: Get Complete SUI Trend Analysis ➞ | |
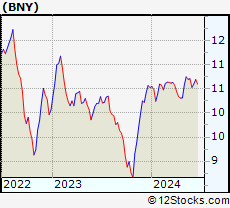 | BNY BlackRock New York Municipal Income Trust |
| Sector: Financials | |
| SubSector: Closed-End Fund - Debt | |
| MarketCap: 144.007 Millions | |
| Recent Price: 10.53 Smart Investing & Trading Score: 0 | |
| Day Percent Change: 0.10% Day Change: 0.01 | |
| Week Change: -1.68% Year-to-date Change: 0.0% | |
| BNY Links: Profile News Message Board | |
| Charts:- Daily , Weekly | |
| Add BNY to Watchlist: View: Get Complete BNY Trend Analysis ➞ | |
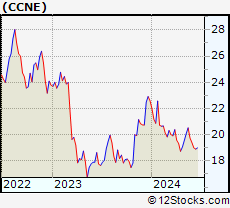 | CCNE CNB Financial Corporation |
| Sector: Financials | |
| SubSector: Regional - Northeast Banks | |
| MarketCap: 286.599 Millions | |
| Recent Price: 19.40 Smart Investing & Trading Score: 17 | |
| Day Percent Change: 0.10% Day Change: 0.02 | |
| Week Change: -1.82% Year-to-date Change: -14.1% | |
| CCNE Links: Profile News Message Board | |
| Charts:- Daily , Weekly | |
| Add CCNE to Watchlist: View: Get Complete CCNE Trend Analysis ➞ | |
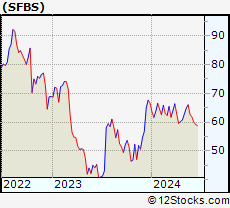 | SFBS ServisFirst Bancshares, Inc. |
| Sector: Financials | |
| SubSector: Foreign Money Center Banks | |
| MarketCap: 1596.71 Millions | |
| Recent Price: 61.80 Smart Investing & Trading Score: 35 | |
| Day Percent Change: 0.10% Day Change: 0.06 | |
| Week Change: -1.42% Year-to-date Change: -7.3% | |
| SFBS Links: Profile News Message Board | |
| Charts:- Daily , Weekly | |
| Add SFBS to Watchlist: View: Get Complete SFBS Trend Analysis ➞ | |
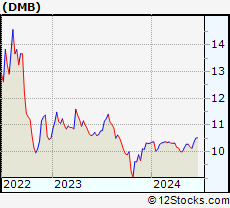 | DMB BNY Mellon Municipal Bond Infrastructure Fund, Inc. |
| Sector: Financials | |
| SubSector: Asset Management | |
| MarketCap: 202.503 Millions | |
| Recent Price: 10.12 Smart Investing & Trading Score: 35 | |
| Day Percent Change: 0.10% Day Change: 0.01 | |
| Week Change: -0.54% Year-to-date Change: -1.8% | |
| DMB Links: Profile News Message Board | |
| Charts:- Daily , Weekly | |
| Add DMB to Watchlist: View: Get Complete DMB Trend Analysis ➞ | |
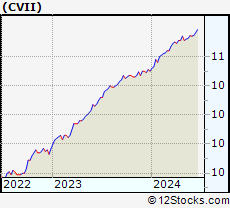 | CVII Churchill Capital Corp VII |
| Sector: Financials | |
| SubSector: SPAC | |
| MarketCap: 954 Millions | |
| Recent Price: 10.74 Smart Investing & Trading Score: 34 | |
| Day Percent Change: 0.10% Day Change: 0.01 | |
| Week Change: -0.03% Year-to-date Change: 2.3% | |
| CVII Links: Profile News Message Board | |
| Charts:- Daily , Weekly | |
| Add CVII to Watchlist: View: Get Complete CVII Trend Analysis ➞ | |
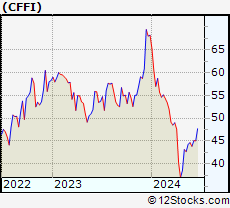 | CFFI C&F Financial Corporation |
| Sector: Financials | |
| SubSector: Regional - Mid-Atlantic Banks | |
| MarketCap: 145.559 Millions | |
| Recent Price: 43.84 Smart Investing & Trading Score: 32 | |
| Day Percent Change: 0.09% Day Change: 0.04 | |
| Week Change: -1.81% Year-to-date Change: -35.7% | |
| CFFI Links: Profile News Message Board | |
| Charts:- Daily , Weekly | |
| Add CFFI to Watchlist: View: Get Complete CFFI Trend Analysis ➞ | |
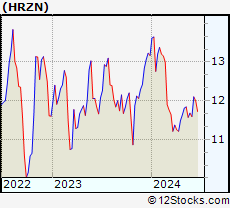 | HRZN Horizon Technology Finance Corporation |
| Sector: Financials | |
| SubSector: Asset Management | |
| MarketCap: 109.203 Millions | |
| Recent Price: 11.59 Smart Investing & Trading Score: 35 | |
| Day Percent Change: 0.09% Day Change: 0.01 | |
| Week Change: -0.77% Year-to-date Change: -12.0% | |
| HRZN Links: Profile News Message Board | |
| Charts:- Daily , Weekly | |
| Add HRZN to Watchlist: View: Get Complete HRZN Trend Analysis ➞ | |
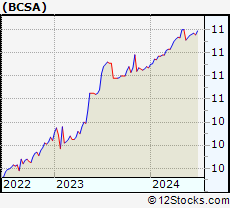 | BCSA Blockchain Coinvestors Acquisition Corp. I |
| Sector: Financials | |
| SubSector: SPAC | |
| MarketCap: 159 Millions | |
| Recent Price: 11.16 Smart Investing & Trading Score: 50 | |
| Day Percent Change: 0.09% Day Change: 0.01 | |
| Week Change: 0.09% Year-to-date Change: 2.7% | |
| BCSA Links: Profile News Message Board | |
| Charts:- Daily , Weekly | |
| Add BCSA to Watchlist: View: Get Complete BCSA Trend Analysis ➞ | |
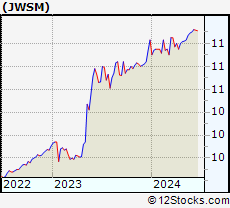 | JWSM Jaws Mustang Acquisition Corporation |
| Sector: Financials | |
| SubSector: SPAC | |
| MarketCap: 299 Millions | |
| Recent Price: 11.10 Smart Investing & Trading Score: 68 | |
| Day Percent Change: 0.09% Day Change: 0.01 | |
| Week Change: 0.09% Year-to-date Change: 0.6% | |
| JWSM Links: Profile News Message Board | |
| Charts:- Daily , Weekly | |
| Add JWSM to Watchlist: View: Get Complete JWSM Trend Analysis ➞ | |
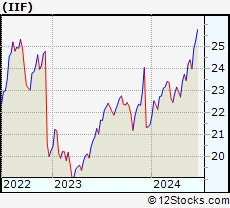 | IIF Morgan Stanley India Investment Fund, Inc. |
| Sector: Financials | |
| SubSector: Closed-End Fund - Foreign | |
| MarketCap: 166.247 Millions | |
| Recent Price: 23.99 Smart Investing & Trading Score: 69 | |
| Day Percent Change: 0.08% Day Change: 0.02 | |
| Week Change: -1.64% Year-to-date Change: 11.7% | |
| IIF Links: Profile News Message Board | |
| Charts:- Daily , Weekly | |
| Add IIF to Watchlist: View: Get Complete IIF Trend Analysis ➞ | |
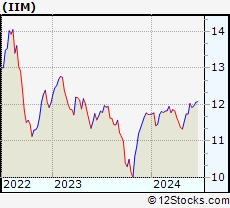 | IIM Invesco Value Municipal Income Trust |
| Sector: Financials | |
| SubSector: Closed-End Fund - Debt | |
| MarketCap: 587.207 Millions | |
| Recent Price: 11.92 Smart Investing & Trading Score: 75 | |
| Day Percent Change: 0.08% Day Change: 0.01 | |
| Week Change: -0.91% Year-to-date Change: 1.6% | |
| IIM Links: Profile News Message Board | |
| Charts:- Daily , Weekly | |
| Add IIM to Watchlist: View: Get Complete IIM Trend Analysis ➞ | |
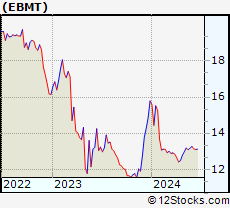 | EBMT Eagle Bancorp Montana, Inc. |
| Sector: Financials | |
| SubSector: Regional - Pacific Banks | |
| MarketCap: 106.929 Millions | |
| Recent Price: 13.27 Smart Investing & Trading Score: 75 | |
| Day Percent Change: 0.08% Day Change: 0.01 | |
| Week Change: 0.76% Year-to-date Change: -16.0% | |
| EBMT Links: Profile News Message Board | |
| Charts:- Daily , Weekly | |
| Add EBMT to Watchlist: View: Get Complete EBMT Trend Analysis ➞ | |
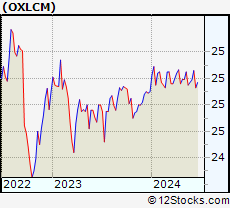 | OXLCM Oxford Lane Capital Corp. |
| Sector: Financials | |
| SubSector: Asset Management | |
| MarketCap: 672.603 Millions | |
| Recent Price: 24.99 Smart Investing & Trading Score: 49 | |
| Day Percent Change: 0.08% Day Change: 0.02 | |
| Week Change: 0.08% Year-to-date Change: 0.4% | |
| OXLCM Links: Profile News Message Board | |
| Charts:- Daily , Weekly | |
| Add OXLCM to Watchlist: View: Get Complete OXLCM Trend Analysis ➞ | |
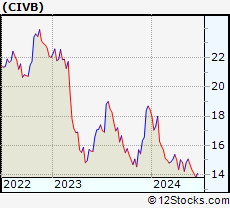 | CIVB Civista Bancshares, Inc. |
| Sector: Financials | |
| SubSector: Regional - Pacific Banks | |
| MarketCap: 255.929 Millions | |
| Recent Price: 14.33 Smart Investing & Trading Score: 35 | |
| Day Percent Change: 0.07% Day Change: 0.01 | |
| Week Change: -2.52% Year-to-date Change: -22.3% | |
| CIVB Links: Profile News Message Board | |
| Charts:- Daily , Weekly | |
| Add CIVB to Watchlist: View: Get Complete CIVB Trend Analysis ➞ | |
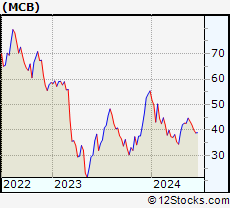 | MCB Metropolitan Bank Holding Corp. |
| Sector: Financials | |
| SubSector: Regional - Northeast Banks | |
| MarketCap: 212.999 Millions | |
| Recent Price: 42.05 Smart Investing & Trading Score: 71 | |
| Day Percent Change: 0.07% Day Change: 0.03 | |
| Week Change: -3.22% Year-to-date Change: -24.1% | |
| MCB Links: Profile News Message Board | |
| Charts:- Daily , Weekly | |
| Add MCB to Watchlist: View: Get Complete MCB Trend Analysis ➞ | |
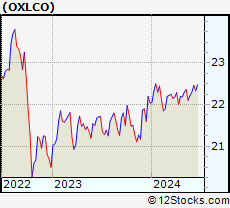 | OXLCO Oxford Lane Capital Corp. |
| Sector: Financials | |
| SubSector: Asset Management | |
| MarketCap: 718.003 Millions | |
| Recent Price: 22.31 Smart Investing & Trading Score: 55 | |
| Day Percent Change: 0.07% Day Change: 0.02 | |
| Week Change: 0.39% Year-to-date Change: 1.2% | |
| OXLCO Links: Profile News Message Board | |
| Charts:- Daily , Weekly | |
| Add OXLCO to Watchlist: View: Get Complete OXLCO Trend Analysis ➞ | |
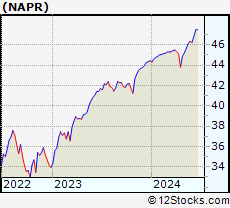 | NAPR Innovator Nasdaq 100 Power Buffer ETF April |
| Sector: Financials | |
| SubSector: Exchange Traded Fund | |
| MarketCap: 60157 Millions | |
| Recent Price: 46.24 Smart Investing & Trading Score: 56 | |
| Day Percent Change: 0.06% Day Change: 0.03 | |
| Week Change: -0.28% Year-to-date Change: 4.0% | |
| NAPR Links: Profile News Message Board | |
| Charts:- Daily , Weekly | |
| Add NAPR to Watchlist: View: Get Complete NAPR Trend Analysis ➞ | |
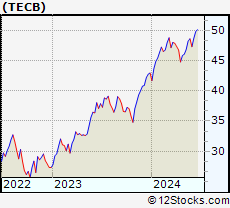 | TECB iShares U.S. Tech Breakthrough Multisector ETF |
| Sector: Financials | |
| SubSector: Exchange Traded Fund | |
| MarketCap: 60157 Millions | |
| Recent Price: 47.31 Smart Investing & Trading Score: 25 | |
| Day Percent Change: 0.06% Day Change: 0.03 | |
| Week Change: -2.7% Year-to-date Change: 10.1% | |
| TECB Links: Profile News Message Board | |
| Charts:- Daily , Weekly | |
| Add TECB to Watchlist: View: Get Complete TECB Trend Analysis ➞ | |
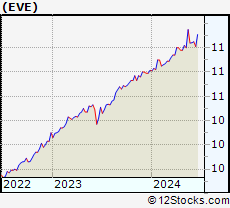 | EVE EVe Mobility Acquisition Corp |
| Sector: Financials | |
| SubSector: SPAC | |
| MarketCap: 164 Millions | |
| Recent Price: 11.04 Smart Investing & Trading Score: 58 | |
| Day Percent Change: 0.06% Day Change: 0.01 | |
| Week Change: 0.01% Year-to-date Change: 2.1% | |
| EVE Links: Profile News Message Board | |
| Charts:- Daily , Weekly | |
| Add EVE to Watchlist: View: Get Complete EVE Trend Analysis ➞ | |
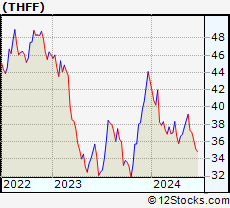 | THFF First Financial Corporation |
| Sector: Financials | |
| SubSector: Regional - Midwest Banks | |
| MarketCap: 433.07 Millions | |
| Recent Price: 37.04 Smart Investing & Trading Score: 48 | |
| Day Percent Change: 0.05% Day Change: 0.02 | |
| Week Change: -0.72% Year-to-date Change: -13.9% | |
| THFF Links: Profile News Message Board | |
| Charts:- Daily , Weekly | |
| Add THFF to Watchlist: View: Get Complete THFF Trend Analysis ➞ | |
| For tabular summary view of above stock list: Summary View ➞ 0 - 25 , 25 - 50 , 50 - 75 , 75 - 100 , 100 - 125 , 125 - 150 , 150 - 175 , 175 - 200 , 200 - 225 , 225 - 250 , 250 - 275 , 275 - 300 , 300 - 325 , 325 - 350 , 350 - 375 , 375 - 400 , 400 - 425 , 425 - 450 , 450 - 475 , 475 - 500 , 500 - 525 , 525 - 550 , 550 - 575 , 575 - 600 , 600 - 625 , 625 - 650 , 650 - 675 , 675 - 700 , 700 - 725 , 725 - 750 , 750 - 775 , 775 - 800 , 800 - 825 , 825 - 850 , 850 - 875 , 875 - 900 , 900 - 925 , 925 - 950 , 950 - 975 , 975 - 1000 , 1000 - 1025 , 1025 - 1050 , 1050 - 1075 , 1075 - 1100 , 1100 - 1125 , 1125 - 1150 , 1150 - 1175 , 1175 - 1200 , 1200 - 1225 | ||
| Click To Change The Sort Order: By Market Cap or Company Size Performance: Year-to-date, Week and Day | |
| Select Chart Type: | ||
|
Best Stocks Today 12Stocks.com |
© 2024 12Stocks.com Terms & Conditions Privacy Contact Us
All Information Provided Only For Education And Not To Be Used For Investing or Trading. See Terms & Conditions


One More Thing ... Get Best Stocks Delivered Daily!
Never Ever Miss A Move With Our Top Ten Stocks Lists
Find Best Stocks In Any Market - Bull or Bear Market
Take A Peek At Our Top Ten Stocks Lists: Daily, Weekly, Year-to-Date & Top Trends
Find Best Stocks In Any Market - Bull or Bear Market
Take A Peek At Our Top Ten Stocks Lists: Daily, Weekly, Year-to-Date & Top Trends
Financial Stocks With Best Up Trends [0-bearish to 100-bullish]: X [100], Brighthouse [100], Central and[100], Northrim BanCorp[100], Bank of America[100], Hagerty [100], Urban Edge[100], Global Blockchain[100], Ventas [100], Omega Healthcare[100], LPL [100]
Best Financial Stocks Year-to-Date:
Root [385.58%], Chimera [138.48%], Banco Macro[130.98%], SelectQuote [127.74%], Gladstone Capital[109.35%], Grupo Financiero[107.65%], Banco BBVA[107.54%], EverQuote [95.18%], Hippo [93.63%], Grupo Supervielle[78.33%], Vista Oil[64.18%] Best Financial Stocks This Week:
C3.ai [23%], Investors Title[19.4%], Banco BBVA[14.74%], Riverview Bancorp[14.25%], Banco Macro[13.7%], IRSA Inversiones[12.15%], Grupo Supervielle[11.73%], Metals Acquisition[10.74%], Grupo Financiero[10.41%], Fathom [10.24%], Vista Oil[9.32%] Best Financial Stocks Daily:
Riverview Bancorp[15.75%], Allied World[14.88%], Medical Properties[7.20%], X [6.14%], Franklin Street[5.32%], Washington Federal[5.16%], Iris Energy[5.13%], Ameris Bancorp[4.80%], Brighthouse [4.79%], Auburn National[4.70%], Central and[4.63%]