
 Login Sign Up


| |||||
 |  | ||||

| 12Stocks.com Market Intelligence |
Best Financial Stocks
| In a hurry? Financial Stocks Lists: Performance Trends Table, Stock Charts
Sort Financial stocks: Daily, Weekly, Year-to-Date, Market Cap & Trends. Filter Financial stocks list by size:All Financial Large Mid-Range Small & MicroCap |
| 12Stocks.com Financial Stocks Performances & Trends Daily | |||||||||
|
|  The overall Smart Investing & Trading Score is 78 (0-bearish to 100-bullish) which puts Financial sector in short term neutral to bullish trend. The Smart Investing & Trading Score from previous trading session is 46 and hence an improvement of trend.
| ||||||||
Here are the Smart Investing & Trading Scores of the most requested Financial stocks at 12Stocks.com (click stock name for detailed review):
|


| 12Stocks.com: Investing in Financial sector with Stocks | |
|
The following table helps investors and traders sort through current performance and trends (as measured by Smart Investing & Trading Score) of various
stocks in the Financial sector. Quick View: Move mouse or cursor over stock symbol (ticker) to view short-term Technical chart and over stock name to view long term chart. Click on  to add stock symbol to your watchlist and to add stock symbol to your watchlist and  to view watchlist. Click on any ticker or stock name for detailed market intelligence report for that stock. to view watchlist. Click on any ticker or stock name for detailed market intelligence report for that stock. |
12Stocks.com Performance of Stocks in Financial Sector
| Ticker | Stock Name | Watchlist | Category | Recent Price | Smart Investing & Trading Score | Change % | YTD Change% |
| STHO | Star |   | Financials Services | 12.87 | 83 | 0.31 | -14.17% |
| BCH | Banco de | | Foreign Banks | 23.68 | 61 | 0.30 | 2.60% |
| BFK | BlackRock Municipal | | Closed-End Fund - Debt | 9.94 | 27 | 0.30 | -1.29% |
| BTA | BlackRock Long-Term | | Closed-End Fund - Debt | 10.02 | 30 | 0.30 | -2.05% |
| AWAY | ETFMG Travel | | Exchange Traded Fund | 19.86 | 49 | 0.30 | 1.59% |
| MCBC | Macatawa Bank | | Regional Banks | 14.06 | 61 | 0.29 | 24.65% |
| MSD | Morgan Stanley | | Closed-End Fund - Debt | 7.16 | 55 | 0.29 | 3.02% |
| KW | Kennedy-Wilson | | Property Mgmt | 10.22 | 86 | 0.29 | -17.45% |
| IBTJ | iShares iBonds | | Exchange Traded Fund | 21.22 | 42 | 0.29 | -2.59% |
| PFEB | Innovator S&P | | Exchange Traded Fund | 34.61 | 71 | 0.29 | 5.97% |
| PMAY | Innovator S&P | | Exchange Traded Fund | 33.56 | 86 | 0.29 | 6.70% |
| AFB | AllianceBernstein National | | Closed-End Fund - Debt | 10.74 | 55 | 0.28 | -0.92% |
| MHN | BlackRock Muni | | Closed-End Fund - Debt | 10.56 | 58 | 0.28 | 0.48% |
| JPC | Nuveen Preferred | | Closed-End Fund - Debt | 7.17 | 58 | 0.28 | 6.07% |
| CASH | Meta | | S&L | 53.31 | 86 | 0.28 | 0.72% |
| NRK | Nuveen New | | Investments | 10.73 | 15 | 0.28 | 1.90% |
| BWBBP | Bridgewater Bancshares | | Banks - Regional | 17.75 | 10 | 0.28 | -6.58% |
| ELS | Equity LifeStyle | | REIT | 62.77 | 42 | 0.27 | -11.02% |
| DSU | BlackRock Debt | | Closed-End Fund - Debt | 10.96 | 50 | 0.27 | 1.58% |
| SKGR | SK Growth | | SPAC | 11.11 | 38 | 0.27 | 2.78% |
| MPA | BlackRock MuniYield | | Closed-End Fund - Debt | 11.88 | 38 | 0.25 | 2.15% |
| GDL | GDL Fund | | Closed-End Fund - Equity | 7.89 | 51 | 0.25 | -1.87% |
| GGN | GAMCO Global | | Investments | 4.09 | 44 | 0.25 | 8.78% |
| CSQ | Calamos Strategic | | Closed-End Fund - Debt | 16.23 | 61 | 0.25 | 9.15% |
| MMI | Marcus & Millichap | | Real Estatet | 32.33 | 25 | 0.25 | -25.98% |
| For chart view version of above stock list: Chart View ➞ 0 - 25 , 25 - 50 , 50 - 75 , 75 - 100 , 100 - 125 , 125 - 150 , 150 - 175 , 175 - 200 , 200 - 225 , 225 - 250 , 250 - 275 , 275 - 300 , 300 - 325 , 325 - 350 , 350 - 375 , 375 - 400 , 400 - 425 , 425 - 450 , 450 - 475 , 475 - 500 , 500 - 525 , 525 - 550 , 550 - 575 , 575 - 600 , 600 - 625 , 625 - 650 , 650 - 675 , 675 - 700 , 700 - 725 , 725 - 750 , 750 - 775 , 775 - 800 , 800 - 825 , 825 - 850 , 850 - 875 , 875 - 900 , 900 - 925 , 925 - 950 , 950 - 975 , 975 - 1000 , 1000 - 1025 , 1025 - 1050 , 1050 - 1075 , 1075 - 1100 , 1100 - 1125 , 1125 - 1150 , 1150 - 1175 , 1175 - 1200 , 1200 - 1225 | ||
 | Click To Change The Sort Order: By Market Cap or Company Size Performance: Year-to-date, Week and Day |  |
|
Get the most comprehensive stock market coverage daily at 12Stocks.com ➞ Best Stocks Today ➞ Best Stocks Weekly ➞ Best Stocks Year-to-Date ➞ Best Stocks Trends ➞  Best Stocks Today 12Stocks.com Best Nasdaq Stocks ➞ Best S&P 500 Stocks ➞ Best Tech Stocks ➞ Best Biotech Stocks ➞ |
| Detailed Overview of Financial Stocks |
| Financial Technical Overview, Leaders & Laggards, Top Financial ETF Funds & Detailed Financial Stocks List, Charts, Trends & More |
| Financial Sector: Technical Analysis, Trends & YTD Performance | |
| Financial sector is composed of stocks
from banks, brokers, insurance, REITs
and services subsectors. Financial sector, as represented by XLF, an exchange-traded fund [ETF] that holds basket of Financial stocks (e.g, Bank of America, Goldman Sachs) is up by 10.74% and is currently outperforming the overall market by 0.95% year-to-date. Below is a quick view of Technical charts and trends: |
|
 XLF Weekly Chart |
|
| Long Term Trend: Very Good | |
| Medium Term Trend: Good | |
 XLF Daily Chart |
|
| Short Term Trend: Very Good | |
| Overall Trend Score: 78 | |
| YTD Performance: 10.74% | |
| **Trend Scores & Views Are Only For Educational Purposes And Not For Investing | |
| 12Stocks.com: Top Performing Financial Sector Stocks | ||||||||||||||||||||||||||||||||||||||||||||||||
 The top performing Financial sector stocks year to date are
Now, more recently, over last week, the top performing Financial sector stocks on the move are


|
||||||||||||||||||||||||||||||||||||||||||||||||
| 12Stocks.com: Investing in Financial Sector using Exchange Traded Funds | |
|
The following table shows list of key exchange traded funds (ETF) that
help investors track Financial Index. For detailed view, check out our ETF Funds section of our website. Quick View: Move mouse or cursor over ETF symbol (ticker) to view short-term Technical chart and over ETF name to view long term chart. Click on ticker or stock name for detailed view. Click on to add stock symbol to your watchlist and to view watchlist. |
12Stocks.com List of ETFs that track Financial Index
| Ticker | ETF Name | Watchlist | Recent Price | Smart Investing & Trading Score | Change % | Week % | Year-to-date % |
| XLF | Financial | | 41.64 | 78 | 1.46 | 0.07 | 10.74% |
| IAI | Broker-Dealers & Secs | | 116.64 | 58 | 0.53 | -1.91 | 7.47% |
| IYF | Financials | | 95.25 | 78 | 1.32 | 0.03 | 11.52% |
| IYG | Financial Services | | 65.74 | 71 | 1.14 | -0.33 | 10.05% |
| KRE | Regional Banking | | 48.85 | 61 | 1.41 | -0.14 | -6.83% |
| IXG | Global Financials | | 87.05 | 76 | 0.80 | -0.54 | 10.77% |
| VFH | Financials | | 101.01 | 78 | 1.28 | -0.12 | 9.48% |
| KBE | Bank | | 46.23 | 68 | 1.34 | 0 | 0.46% |
| FAS | Financial Bull 3X | | 105.34 | 78 | 4.16 | -0.02 | 27.45% |
| FAZ | Financial Bear 3X | | 10.35 | 17 | -4.08 | -0.1 | -24.29% |
| UYG | Financials | | 65.65 | 78 | 3.19 | -0.03 | 18.93% |
| IAT | Regional Banks | | 41.90 | 68 | 1.87 | 0 | 0.14% |
| KIE | Insurance | | 51.16 | 78 | 1.11 | 0.69 | 13.14% |
| PSCF | SmallCap Financials | | 47.14 | 53 | 1.59 | -0.79 | -4.14% |
| EUFN | Europe Financials | | 24.18 | 100 | 1.02 | 0.71 | 15.36% |
| PGF | Financial Preferred | | 14.79 | 55 | 1.09 | 0.68 | 1.44% |
| 12Stocks.com: Charts, Trends, Fundamental Data and Performances of Financial Stocks | |
|
We now take in-depth look at all Financial stocks including charts, multi-period performances and overall trends (as measured by Smart Investing & Trading Score). One can sort Financial stocks (click link to choose) by Daily, Weekly and by Year-to-Date performances. Also, one can sort by size of the company or by market capitalization. |
| Select Your Default Chart Type: | |||||
| |||||
| Click on stock symbol or name for detailed view. Click on to add stock symbol to your watchlist and to view watchlist. Quick View: Move mouse or cursor over "Daily" to quickly view daily Technical stock chart and over "Weekly" to view weekly Technical stock chart. | |||||

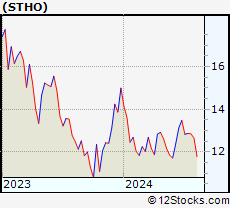 | STHO Star Holdings |
| Sector: Financials | |
| SubSector: Financials Services | |
| MarketCap: 195 Millions | |
| Recent Price: 12.87 Smart Investing & Trading Score: 83 | |
| Day Percent Change: 0.31% Day Change: 0.04 | |
| Week Change: 0.31% Year-to-date Change: -14.2% | |
| STHO Links: Profile News Message Board | |
| Charts:- Daily , Weekly | |
| Add STHO to Watchlist: View: Get Complete STHO Trend Analysis ➞ | |
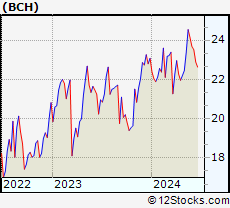 | BCH Banco de Chile |
| Sector: Financials | |
| SubSector: Foreign Regional Banks | |
| MarketCap: 8439.69 Millions | |
| Recent Price: 23.68 Smart Investing & Trading Score: 61 | |
| Day Percent Change: 0.30% Day Change: 0.07 | |
| Week Change: -1.91% Year-to-date Change: 2.6% | |
| BCH Links: Profile News Message Board | |
| Charts:- Daily , Weekly | |
| Add BCH to Watchlist: View: Get Complete BCH Trend Analysis ➞ | |
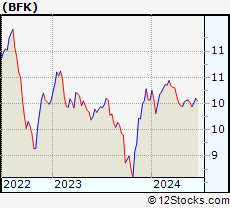 | BFK BlackRock Municipal Income Trust |
| Sector: Financials | |
| SubSector: Closed-End Fund - Debt | |
| MarketCap: 500.707 Millions | |
| Recent Price: 9.94 Smart Investing & Trading Score: 27 | |
| Day Percent Change: 0.30% Day Change: 0.03 | |
| Week Change: -0.8% Year-to-date Change: -1.3% | |
| BFK Links: Profile News Message Board | |
| Charts:- Daily , Weekly | |
| Add BFK to Watchlist: View: Get Complete BFK Trend Analysis ➞ | |
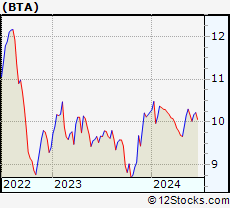 | BTA BlackRock Long-Term Municipal Advantage Trust |
| Sector: Financials | |
| SubSector: Closed-End Fund - Debt | |
| MarketCap: 133.907 Millions | |
| Recent Price: 10.02 Smart Investing & Trading Score: 30 | |
| Day Percent Change: 0.30% Day Change: 0.03 | |
| Week Change: -1.47% Year-to-date Change: -2.1% | |
| BTA Links: Profile News Message Board | |
| Charts:- Daily , Weekly | |
| Add BTA to Watchlist: View: Get Complete BTA Trend Analysis ➞ | |
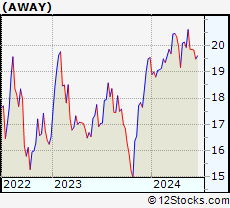 | AWAY ETFMG Travel Tech ETF |
| Sector: Financials | |
| SubSector: Exchange Traded Fund | |
| MarketCap: 60157 Millions | |
| Recent Price: 19.86 Smart Investing & Trading Score: 49 | |
| Day Percent Change: 0.30% Day Change: 0.06 | |
| Week Change: -0.05% Year-to-date Change: 1.6% | |
| AWAY Links: Profile News Message Board | |
| Charts:- Daily , Weekly | |
| Add AWAY to Watchlist: View: Get Complete AWAY Trend Analysis ➞ | |
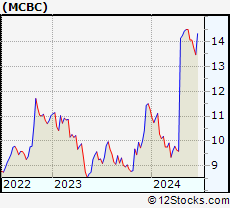 | MCBC Macatawa Bank Corporation |
| Sector: Financials | |
| SubSector: Regional - Midwest Banks | |
| MarketCap: 264.37 Millions | |
| Recent Price: 14.06 Smart Investing & Trading Score: 61 | |
| Day Percent Change: 0.29% Day Change: 0.04 | |
| Week Change: 0% Year-to-date Change: 24.7% | |
| MCBC Links: Profile News Message Board | |
| Charts:- Daily , Weekly | |
| Add MCBC to Watchlist: View: Get Complete MCBC Trend Analysis ➞ | |
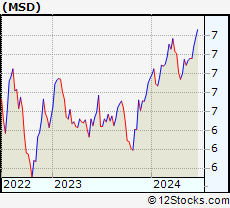 | MSD Morgan Stanley Emerging Markets Debt Fund, Inc. |
| Sector: Financials | |
| SubSector: Closed-End Fund - Debt | |
| MarketCap: 149.407 Millions | |
| Recent Price: 7.16 Smart Investing & Trading Score: 55 | |
| Day Percent Change: 0.29% Day Change: 0.02 | |
| Week Change: 0% Year-to-date Change: 3.0% | |
| MSD Links: Profile News Message Board | |
| Charts:- Daily , Weekly | |
| Add MSD to Watchlist: View: Get Complete MSD Trend Analysis ➞ | |
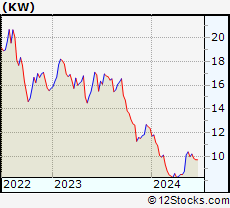 | KW Kennedy-Wilson Holdings, Inc. |
| Sector: Financials | |
| SubSector: Property Management | |
| MarketCap: 2025.42 Millions | |
| Recent Price: 10.22 Smart Investing & Trading Score: 86 | |
| Day Percent Change: 0.29% Day Change: 0.03 | |
| Week Change: 2.2% Year-to-date Change: -17.5% | |
| KW Links: Profile News Message Board | |
| Charts:- Daily , Weekly | |
| Add KW to Watchlist: View: Get Complete KW Trend Analysis ➞ | |
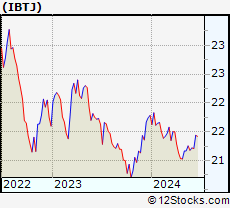 | IBTJ iShares iBonds Dec 2029 Term Treasury ETF |
| Sector: Financials | |
| SubSector: Exchange Traded Fund | |
| MarketCap: 60157 Millions | |
| Recent Price: 21.22 Smart Investing & Trading Score: 42 | |
| Day Percent Change: 0.29% Day Change: 0.06 | |
| Week Change: 0.19% Year-to-date Change: -2.6% | |
| IBTJ Links: Profile News Message Board | |
| Charts:- Daily , Weekly | |
| Add IBTJ to Watchlist: View: Get Complete IBTJ Trend Analysis ➞ | |
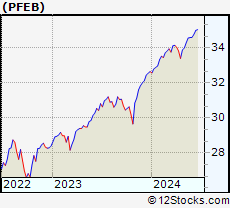 | PFEB Innovator S&P 500 Power Buffer ETF February |
| Sector: Financials | |
| SubSector: Exchange Traded Fund | |
| MarketCap: 60157 Millions | |
| Recent Price: 34.61 Smart Investing & Trading Score: 71 | |
| Day Percent Change: 0.29% Day Change: 0.10 | |
| Week Change: 0.03% Year-to-date Change: 6.0% | |
| PFEB Links: Profile News Message Board | |
| Charts:- Daily , Weekly | |
| Add PFEB to Watchlist: View: Get Complete PFEB Trend Analysis ➞ | |
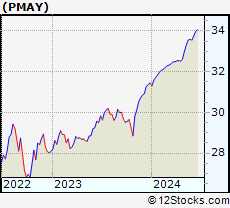 | PMAY Innovator S&P 500 Power Buffer ETF May |
| Sector: Financials | |
| SubSector: Exchange Traded Fund | |
| MarketCap: 60157 Millions | |
| Recent Price: 33.56 Smart Investing & Trading Score: 86 | |
| Day Percent Change: 0.29% Day Change: 0.10 | |
| Week Change: -0.11% Year-to-date Change: 6.7% | |
| PMAY Links: Profile News Message Board | |
| Charts:- Daily , Weekly | |
| Add PMAY to Watchlist: View: Get Complete PMAY Trend Analysis ➞ | |
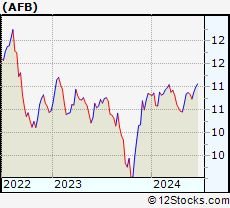 | AFB AllianceBernstein National Municipal Income Fund |
| Sector: Financials | |
| SubSector: Closed-End Fund - Debt | |
| MarketCap: 342.307 Millions | |
| Recent Price: 10.74 Smart Investing & Trading Score: 55 | |
| Day Percent Change: 0.28% Day Change: 0.03 | |
| Week Change: -0.97% Year-to-date Change: -0.9% | |
| AFB Links: Profile News Message Board | |
| Charts:- Daily , Weekly | |
| Add AFB to Watchlist: View: Get Complete AFB Trend Analysis ➞ | |
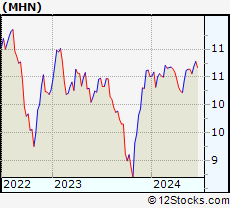 | MHN BlackRock MuniHoldings New York Quality Fund, Inc. |
| Sector: Financials | |
| SubSector: Closed-End Fund - Debt | |
| MarketCap: 369.207 Millions | |
| Recent Price: 10.56 Smart Investing & Trading Score: 58 | |
| Day Percent Change: 0.28% Day Change: 0.03 | |
| Week Change: -0.75% Year-to-date Change: 0.5% | |
| MHN Links: Profile News Message Board | |
| Charts:- Daily , Weekly | |
| Add MHN to Watchlist: View: Get Complete MHN Trend Analysis ➞ | |
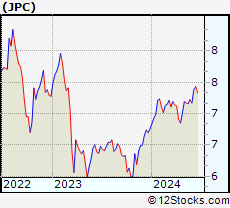 | JPC Nuveen Preferred & Income Opportunities Fund |
| Sector: Financials | |
| SubSector: Closed-End Fund - Debt | |
| MarketCap: 621.007 Millions | |
| Recent Price: 7.17 Smart Investing & Trading Score: 58 | |
| Day Percent Change: 0.28% Day Change: 0.02 | |
| Week Change: -0.69% Year-to-date Change: 6.1% | |
| JPC Links: Profile News Message Board | |
| Charts:- Daily , Weekly | |
| Add JPC to Watchlist: View: Get Complete JPC Trend Analysis ➞ | |
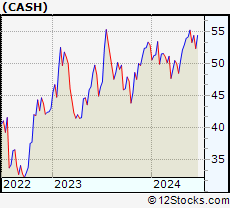 | CASH Meta Financial Group, Inc. |
| Sector: Financials | |
| SubSector: Savings & Loans | |
| MarketCap: 849.33 Millions | |
| Recent Price: 53.31 Smart Investing & Trading Score: 86 | |
| Day Percent Change: 0.28% Day Change: 0.15 | |
| Week Change: -3.51% Year-to-date Change: 0.7% | |
| CASH Links: Profile News Message Board | |
| Charts:- Daily , Weekly | |
| Add CASH to Watchlist: View: Get Complete CASH Trend Analysis ➞ | |
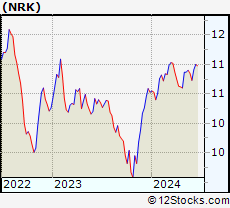 | NRK Nuveen New York AMT-Free Quality Municipal Income Fund |
| Sector: Financials | |
| SubSector: Diversified Investments | |
| MarketCap: 1006.7 Millions | |
| Recent Price: 10.73 Smart Investing & Trading Score: 15 | |
| Day Percent Change: 0.28% Day Change: 0.03 | |
| Week Change: -1.11% Year-to-date Change: 1.9% | |
| NRK Links: Profile News Message Board | |
| Charts:- Daily , Weekly | |
| Add NRK to Watchlist: View: Get Complete NRK Trend Analysis ➞ | |
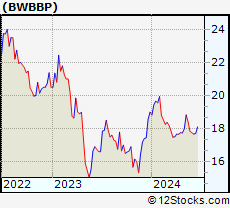 | BWBBP Bridgewater Bancshares, Inc. |
| Sector: Financials | |
| SubSector: Banks - Regional | |
| MarketCap: 285 Millions | |
| Recent Price: 17.75 Smart Investing & Trading Score: 10 | |
| Day Percent Change: 0.28% Day Change: 0.05 | |
| Week Change: -0.45% Year-to-date Change: -6.6% | |
| BWBBP Links: Profile News Message Board | |
| Charts:- Daily , Weekly | |
| Add BWBBP to Watchlist: View: Get Complete BWBBP Trend Analysis ➞ | |
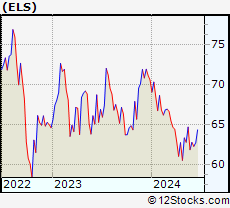 | ELS Equity LifeStyle Properties, Inc. |
| Sector: Financials | |
| SubSector: REIT - Residential | |
| MarketCap: 9570.61 Millions | |
| Recent Price: 62.77 Smart Investing & Trading Score: 42 | |
| Day Percent Change: 0.27% Day Change: 0.17 | |
| Week Change: 1.49% Year-to-date Change: -11.0% | |
| ELS Links: Profile News Message Board | |
| Charts:- Daily , Weekly | |
| Add ELS to Watchlist: View: Get Complete ELS Trend Analysis ➞ | |
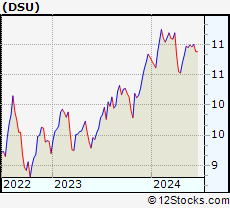 | DSU BlackRock Debt Strategies Fund, Inc. |
| Sector: Financials | |
| SubSector: Closed-End Fund - Debt | |
| MarketCap: 347.307 Millions | |
| Recent Price: 10.96 Smart Investing & Trading Score: 50 | |
| Day Percent Change: 0.27% Day Change: 0.03 | |
| Week Change: -0.27% Year-to-date Change: 1.6% | |
| DSU Links: Profile News Message Board | |
| Charts:- Daily , Weekly | |
| Add DSU to Watchlist: View: Get Complete DSU Trend Analysis ➞ | |
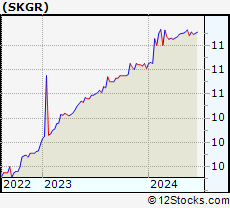 | SKGR SK Growth Opportunities Corporation |
| Sector: Financials | |
| SubSector: SPAC | |
| MarketCap: 277 Millions | |
| Recent Price: 11.11 Smart Investing & Trading Score: 38 | |
| Day Percent Change: 0.27% Day Change: 0.03 | |
| Week Change: 0.27% Year-to-date Change: 2.8% | |
| SKGR Links: Profile News Message Board | |
| Charts:- Daily , Weekly | |
| Add SKGR to Watchlist: View: Get Complete SKGR Trend Analysis ➞ | |
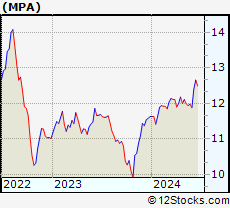 | MPA BlackRock MuniYield Pennsylvania Quality Fund |
| Sector: Financials | |
| SubSector: Closed-End Fund - Debt | |
| MarketCap: 155.107 Millions | |
| Recent Price: 11.88 Smart Investing & Trading Score: 38 | |
| Day Percent Change: 0.25% Day Change: 0.03 | |
| Week Change: -0.83% Year-to-date Change: 2.2% | |
| MPA Links: Profile News Message Board | |
| Charts:- Daily , Weekly | |
| Add MPA to Watchlist: View: Get Complete MPA Trend Analysis ➞ | |
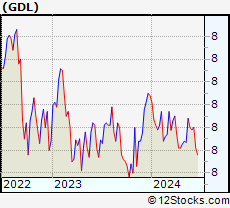 | GDL The GDL Fund |
| Sector: Financials | |
| SubSector: Closed-End Fund - Equity | |
| MarketCap: 104.847 Millions | |
| Recent Price: 7.89 Smart Investing & Trading Score: 51 | |
| Day Percent Change: 0.25% Day Change: 0.02 | |
| Week Change: -0.13% Year-to-date Change: -1.9% | |
| GDL Links: Profile News Message Board | |
| Charts:- Daily , Weekly | |
| Add GDL to Watchlist: View: Get Complete GDL Trend Analysis ➞ | |
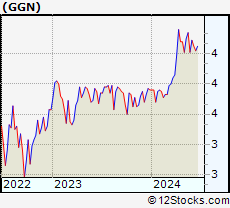 | GGN GAMCO Global Gold, Natural Resources & Income Trust |
| Sector: Financials | |
| SubSector: Diversified Investments | |
| MarketCap: 375.67 Millions | |
| Recent Price: 4.09 Smart Investing & Trading Score: 44 | |
| Day Percent Change: 0.25% Day Change: 0.01 | |
| Week Change: 2% Year-to-date Change: 8.8% | |
| GGN Links: Profile News Message Board | |
| Charts:- Daily , Weekly | |
| Add GGN to Watchlist: View: Get Complete GGN Trend Analysis ➞ | |
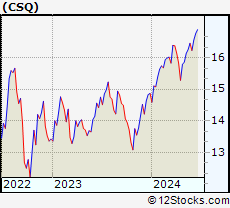 | CSQ Calamos Strategic Total Return Fund |
| Sector: Financials | |
| SubSector: Closed-End Fund - Debt | |
| MarketCap: 1196.17 Millions | |
| Recent Price: 16.23 Smart Investing & Trading Score: 61 | |
| Day Percent Change: 0.25% Day Change: 0.04 | |
| Week Change: -1.4% Year-to-date Change: 9.2% | |
| CSQ Links: Profile News Message Board | |
| Charts:- Daily , Weekly | |
| Add CSQ to Watchlist: View: Get Complete CSQ Trend Analysis ➞ | |
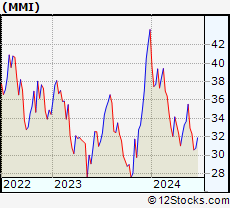 | MMI Marcus & Millichap, Inc. |
| Sector: Financials | |
| SubSector: Real Estate Development | |
| MarketCap: 1005.19 Millions | |
| Recent Price: 32.33 Smart Investing & Trading Score: 25 | |
| Day Percent Change: 0.25% Day Change: 0.08 | |
| Week Change: -1.85% Year-to-date Change: -26.0% | |
| MMI Links: Profile News Message Board | |
| Charts:- Daily , Weekly | |
| Add MMI to Watchlist: View: Get Complete MMI Trend Analysis ➞ | |
| For tabular summary view of above stock list: Summary View ➞ 0 - 25 , 25 - 50 , 50 - 75 , 75 - 100 , 100 - 125 , 125 - 150 , 150 - 175 , 175 - 200 , 200 - 225 , 225 - 250 , 250 - 275 , 275 - 300 , 300 - 325 , 325 - 350 , 350 - 375 , 375 - 400 , 400 - 425 , 425 - 450 , 450 - 475 , 475 - 500 , 500 - 525 , 525 - 550 , 550 - 575 , 575 - 600 , 600 - 625 , 625 - 650 , 650 - 675 , 675 - 700 , 700 - 725 , 725 - 750 , 750 - 775 , 775 - 800 , 800 - 825 , 825 - 850 , 850 - 875 , 875 - 900 , 900 - 925 , 925 - 950 , 950 - 975 , 975 - 1000 , 1000 - 1025 , 1025 - 1050 , 1050 - 1075 , 1075 - 1100 , 1100 - 1125 , 1125 - 1150 , 1150 - 1175 , 1175 - 1200 , 1200 - 1225 | ||
| Click To Change The Sort Order: By Market Cap or Company Size Performance: Year-to-date, Week and Day | |
| Select Chart Type: | ||
|
Best Stocks Today 12Stocks.com |
© 2024 12Stocks.com Terms & Conditions Privacy Contact Us
All Information Provided Only For Education And Not To Be Used For Investing or Trading. See Terms & Conditions


One More Thing ... Get Best Stocks Delivered Daily!
Never Ever Miss A Move With Our Top Ten Stocks Lists
Find Best Stocks In Any Market - Bull or Bear Market
Take A Peek At Our Top Ten Stocks Lists: Daily, Weekly, Year-to-Date & Top Trends
Find Best Stocks In Any Market - Bull or Bear Market
Take A Peek At Our Top Ten Stocks Lists: Daily, Weekly, Year-to-Date & Top Trends
Financial Stocks With Best Up Trends [0-bearish to 100-bullish]: X [100], Brighthouse [100], Central and[100], Northrim BanCorp[100], Bank of America[100], Hagerty [100], Urban Edge[100], Global Blockchain[100], Ventas [100], Omega Healthcare[100], LPL [100]
Best Financial Stocks Year-to-Date:
Root [385.58%], Chimera [138.48%], Banco Macro[130.98%], SelectQuote [127.74%], Gladstone Capital[109.35%], Grupo Financiero[107.65%], Banco BBVA[107.54%], EverQuote [95.18%], Hippo [93.63%], Grupo Supervielle[78.33%], Vista Oil[64.18%] Best Financial Stocks This Week:
C3.ai [23%], Investors Title[19.4%], Banco BBVA[14.74%], Riverview Bancorp[14.25%], Banco Macro[13.7%], IRSA Inversiones[12.15%], Grupo Supervielle[11.73%], Metals Acquisition[10.74%], Grupo Financiero[10.41%], Fathom [10.24%], Vista Oil[9.32%] Best Financial Stocks Daily:
Riverview Bancorp[15.75%], Allied World[14.88%], Medical Properties[7.20%], X [6.14%], Franklin Street[5.32%], Washington Federal[5.16%], Iris Energy[5.13%], Ameris Bancorp[4.80%], Brighthouse [4.79%], Auburn National[4.70%], Central and[4.63%]