
 Login Sign Up


| |||||
 |  | ||||

| 12Stocks.com Market Intelligence |
Best Financial Stocks
| In a hurry? Financial Stocks Lists: Performance Trends Table, Stock Charts
Sort Financial stocks: Daily, Weekly, Year-to-Date, Market Cap & Trends. Filter Financial stocks list by size:All Financial Large Mid-Range Small & MicroCap |
| 12Stocks.com Financial Stocks Performances & Trends Daily | |||||||||
|
|  The overall Smart Investing & Trading Score is 78 (0-bearish to 100-bullish) which puts Financial sector in short term neutral to bullish trend. The Smart Investing & Trading Score from previous trading session is 46 and hence an improvement of trend.
| ||||||||
Here are the Smart Investing & Trading Scores of the most requested Financial stocks at 12Stocks.com (click stock name for detailed review):
|


| 12Stocks.com: Investing in Financial sector with Stocks | |
|
The following table helps investors and traders sort through current performance and trends (as measured by Smart Investing & Trading Score) of various
stocks in the Financial sector. Quick View: Move mouse or cursor over stock symbol (ticker) to view short-term Technical chart and over stock name to view long term chart. Click on  to add stock symbol to your watchlist and to add stock symbol to your watchlist and  to view watchlist. Click on any ticker or stock name for detailed market intelligence report for that stock. to view watchlist. Click on any ticker or stock name for detailed market intelligence report for that stock. |
12Stocks.com Performance of Stocks in Financial Sector
| Ticker | Stock Name | Watchlist | Category | Recent Price | Smart Investing & Trading Score | Change % | Weekly Change% |
| DSM | BNY |   | Closed-End Fund - Debt | 5.69 | 27 | 0.89% | 0.00% |
| FOF | Cohen & Steers Closed-End Opportunity Fund | | Closed-End Fund - Equity | 11.72 | 68 | 0.17% | 0.00% |
| HIX | Western Asset | | Closed-End Fund - Debt | 4.39 | 35 | 0.92% | 0.00% |
| RQI | Cohen & Steers Quality ome Realty Fund | | Closed-End Fund - Equity | 11.40 | 67 | 2.43% | 0.00% |
| BDJ | BlackRock Enhanced | | Closed-End Fund - Equity | 8.25 | 71 | 1.35% | 0.00% |
| PPT | Putnam Premier | | Closed-End Fund - Debt | 3.48 | 32 | 1.16% | 0.00% |
| FAX | Aberdeen Asia-Pacific | | Closed-End Fund - Debt | 2.66 | 32 | 1.92% | 0.00% |
| ACP | Aberdeen ome | | Closed-End Fund - Debt | 6.70 | 42 | 1.06% | 0.00% |
| PDT | John Hancock | | Closed-End Fund - Debt | 11.50 | 55 | 1.41% | 0.00% |
| VBF | Invesco Bond | | Closed-End Fund - Debt | 15.73 | 67 | 0.58% | 0.00% |
| MSD | Morgan Stanley | | Closed-End Fund - Debt | 7.16 | 55 | 0.29% | 0.00% |
| MGF | MFS Government | | Closed-End Fund - Debt | 3.07 | 17 | 0.99% | 0.00% |
| NZF | Nuveen Municipal | | Asset Mgmt | 11.92 | 58 | 1.02% | 0.00% |
| EOI | Eaton Vance | | Closed-End Fund - Equity | 18.45 | 86 | 0.99% | 0.00% |
| NUV | Nuveen Municipal | | Closed-End Fund - Debt | 8.47 | 25 | 0.95% | 0.00% |
| IGR | CBRE Clarion | | Closed-End Fund - Foreign | 4.98 | 42 | 2.05% | 0.00% |
| NEN | New England | | Real Estatet | 71.50 | 75 | -0.63% | 0.00% |
| ESBA | Empire State | | REIT - Office | 9.25 | 49 | 1.98% | 0.00% |
| AC | Associated Capital | | Asset Mgmt | 34.35 | 83 | -0.09% | 0.00% |
| FFWM | First Foundation | | Regional Banks | 5.92 | 62 | 4.04% | 0.00% |
| ECC | Eagle Point | | Closed-End Fund - Debt | 10.19 | 76 | 0.20% | 0.00% |
| BTT | Blackrock Municipal | | Closed-End Fund - Debt | 20.47 | 25 | 0.64% | 0.00% |
| BSL | Blackstone/GSO Senior | | Closed-End Fund - Debt | 14.11 | 50 | 1.15% | 0.00% |
| NMRK | Newmark | | Property Mgmt | 10.41 | 52 | 1.26% | 0.00% |
| AMAL | Amalgamated Bank | | Regional Banks | 25.28 | 59 | 0.32% | 0.00% |
| For chart view version of above stock list: Chart View ➞ 0 - 25 , 25 - 50 , 50 - 75 , 75 - 100 , 100 - 125 , 125 - 150 , 150 - 175 , 175 - 200 , 200 - 225 , 225 - 250 , 250 - 275 , 275 - 300 , 300 - 325 , 325 - 350 , 350 - 375 , 375 - 400 , 400 - 425 , 425 - 450 , 450 - 475 , 475 - 500 , 500 - 525 , 525 - 550 , 550 - 575 , 575 - 600 , 600 - 625 , 625 - 650 , 650 - 675 , 675 - 700 , 700 - 725 , 725 - 750 , 750 - 775 , 775 - 800 , 800 - 825 , 825 - 850 , 850 - 875 , 875 - 900 , 900 - 925 , 925 - 950 , 950 - 975 , 975 - 1000 , 1000 - 1025 , 1025 - 1050 , 1050 - 1075 , 1075 - 1100 , 1100 - 1125 , 1125 - 1150 , 1150 - 1175 , 1175 - 1200 , 1200 - 1225 | ||
 | Click To Change The Sort Order: By Market Cap or Company Size Performance: Year-to-date, Week and Day |  |
|
Get the most comprehensive stock market coverage daily at 12Stocks.com ➞ Best Stocks Today ➞ Best Stocks Weekly ➞ Best Stocks Year-to-Date ➞ Best Stocks Trends ➞  Best Stocks Today 12Stocks.com Best Nasdaq Stocks ➞ Best S&P 500 Stocks ➞ Best Tech Stocks ➞ Best Biotech Stocks ➞ |
| Detailed Overview of Financial Stocks |
| Financial Technical Overview, Leaders & Laggards, Top Financial ETF Funds & Detailed Financial Stocks List, Charts, Trends & More |
| Financial Sector: Technical Analysis, Trends & YTD Performance | |
| Financial sector is composed of stocks
from banks, brokers, insurance, REITs
and services subsectors. Financial sector, as represented by XLF, an exchange-traded fund [ETF] that holds basket of Financial stocks (e.g, Bank of America, Goldman Sachs) is up by 10.74% and is currently outperforming the overall market by 0.95% year-to-date. Below is a quick view of Technical charts and trends: |
|
 XLF Weekly Chart |
|
| Long Term Trend: Very Good | |
| Medium Term Trend: Good | |
 XLF Daily Chart |
|
| Short Term Trend: Very Good | |
| Overall Trend Score: 78 | |
| YTD Performance: 10.74% | |
| **Trend Scores & Views Are Only For Educational Purposes And Not For Investing | |
| 12Stocks.com: Top Performing Financial Sector Stocks | ||||||||||||||||||||||||||||||||||||||||||||||||
 The top performing Financial sector stocks year to date are
Now, more recently, over last week, the top performing Financial sector stocks on the move are


|
||||||||||||||||||||||||||||||||||||||||||||||||
| 12Stocks.com: Investing in Financial Sector using Exchange Traded Funds | |
|
The following table shows list of key exchange traded funds (ETF) that
help investors track Financial Index. For detailed view, check out our ETF Funds section of our website. Quick View: Move mouse or cursor over ETF symbol (ticker) to view short-term Technical chart and over ETF name to view long term chart. Click on ticker or stock name for detailed view. Click on to add stock symbol to your watchlist and to view watchlist. |
12Stocks.com List of ETFs that track Financial Index
| Ticker | ETF Name | Watchlist | Recent Price | Smart Investing & Trading Score | Change % | Week % | Year-to-date % |
| XLF | Financial | | 41.64 | 78 | 1.46 | 0.07 | 10.74% |
| IAI | Broker-Dealers & Secs | | 116.64 | 58 | 0.53 | -1.91 | 7.47% |
| IYF | Financials | | 95.25 | 78 | 1.32 | 0.03 | 11.52% |
| IYG | Financial Services | | 65.74 | 71 | 1.14 | -0.33 | 10.05% |
| KRE | Regional Banking | | 48.85 | 61 | 1.41 | -0.14 | -6.83% |
| IXG | Global Financials | | 87.05 | 76 | 0.80 | -0.54 | 10.77% |
| VFH | Financials | | 101.01 | 78 | 1.28 | -0.12 | 9.48% |
| KBE | Bank | | 46.23 | 68 | 1.34 | 0 | 0.46% |
| FAS | Financial Bull 3X | | 105.34 | 78 | 4.16 | -0.02 | 27.45% |
| FAZ | Financial Bear 3X | | 10.35 | 17 | -4.08 | -0.1 | -24.29% |
| UYG | Financials | | 65.65 | 78 | 3.19 | -0.03 | 18.93% |
| IAT | Regional Banks | | 41.90 | 68 | 1.87 | 0 | 0.14% |
| KIE | Insurance | | 51.16 | 78 | 1.11 | 0.69 | 13.14% |
| PSCF | SmallCap Financials | | 47.14 | 53 | 1.59 | -0.79 | -4.14% |
| EUFN | Europe Financials | | 24.18 | 100 | 1.02 | 0.71 | 15.36% |
| PGF | Financial Preferred | | 14.79 | 55 | 1.09 | 0.68 | 1.44% |
| 12Stocks.com: Charts, Trends, Fundamental Data and Performances of Financial Stocks | |
|
We now take in-depth look at all Financial stocks including charts, multi-period performances and overall trends (as measured by Smart Investing & Trading Score). One can sort Financial stocks (click link to choose) by Daily, Weekly and by Year-to-Date performances. Also, one can sort by size of the company or by market capitalization. |
| Select Your Default Chart Type: | |||||
| |||||
| Click on stock symbol or name for detailed view. Click on to add stock symbol to your watchlist and to view watchlist. Quick View: Move mouse or cursor over "Daily" to quickly view daily Technical stock chart and over "Weekly" to view weekly Technical stock chart. | |||||

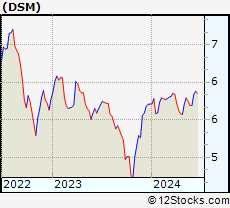 | DSM BNY Mellon Strategic Municipal Bond Fund, Inc. |
| Sector: Financials | |
| SubSector: Closed-End Fund - Debt | |
| MarketCap: 315.907 Millions | |
| Recent Price: 5.69 Smart Investing & Trading Score: 27 | |
| Day Percent Change: 0.89% Day Change: 0.05 | |
| Week Change: 0% Year-to-date Change: -0.4% | |
| DSM Links: Profile News Message Board | |
| Charts:- Daily , Weekly | |
| Add DSM to Watchlist: View: Get Complete DSM Trend Analysis ➞ | |
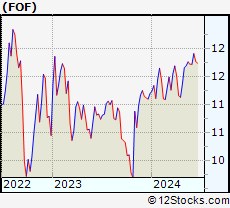 | FOF Cohen & Steers Closed-End Opportunity Fund, Inc. |
| Sector: Financials | |
| SubSector: Closed-End Fund - Equity | |
| MarketCap: 199.747 Millions | |
| Recent Price: 11.72 Smart Investing & Trading Score: 68 | |
| Day Percent Change: 0.17% Day Change: 0.02 | |
| Week Change: 0% Year-to-date Change: 4.6% | |
| FOF Links: Profile News Message Board | |
| Charts:- Daily , Weekly | |
| Add FOF to Watchlist: View: Get Complete FOF Trend Analysis ➞ | |
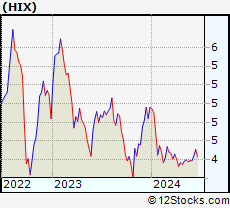 | HIX Western Asset High Income Fund II Inc. |
| Sector: Financials | |
| SubSector: Closed-End Fund - Debt | |
| MarketCap: 356.807 Millions | |
| Recent Price: 4.39 Smart Investing & Trading Score: 35 | |
| Day Percent Change: 0.92% Day Change: 0.04 | |
| Week Change: 0% Year-to-date Change: -11.5% | |
| HIX Links: Profile News Message Board | |
| Charts:- Daily , Weekly | |
| Add HIX to Watchlist: View: Get Complete HIX Trend Analysis ➞ | |
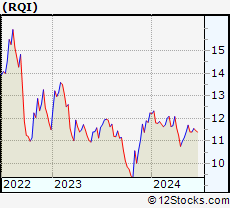 | RQI Cohen & Steers Quality Income Realty Fund, Inc. |
| Sector: Financials | |
| SubSector: Closed-End Fund - Equity | |
| MarketCap: 811.847 Millions | |
| Recent Price: 11.40 Smart Investing & Trading Score: 67 | |
| Day Percent Change: 2.43% Day Change: 0.27 | |
| Week Change: 0% Year-to-date Change: -6.9% | |
| RQI Links: Profile News Message Board | |
| Charts:- Daily , Weekly | |
| Add RQI to Watchlist: View: Get Complete RQI Trend Analysis ➞ | |
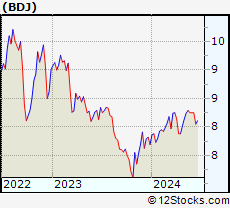 | BDJ BlackRock Enhanced Equity Dividend Trust |
| Sector: Financials | |
| SubSector: Closed-End Fund - Equity | |
| MarketCap: 1031.47 Millions | |
| Recent Price: 8.25 Smart Investing & Trading Score: 71 | |
| Day Percent Change: 1.35% Day Change: 0.11 | |
| Week Change: 0% Year-to-date Change: 7.3% | |
| BDJ Links: Profile News Message Board | |
| Charts:- Daily , Weekly | |
| Add BDJ to Watchlist: View: Get Complete BDJ Trend Analysis ➞ | |
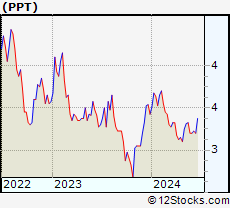 | PPT Putnam Premier Income Trust |
| Sector: Financials | |
| SubSector: Closed-End Fund - Debt | |
| MarketCap: 419.607 Millions | |
| Recent Price: 3.48 Smart Investing & Trading Score: 32 | |
| Day Percent Change: 1.16% Day Change: 0.04 | |
| Week Change: 0% Year-to-date Change: -2.5% | |
| PPT Links: Profile News Message Board | |
| Charts:- Daily , Weekly | |
| Add PPT to Watchlist: View: Get Complete PPT Trend Analysis ➞ | |
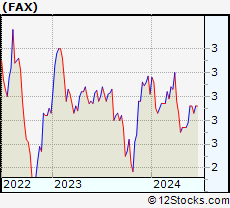 | FAX Aberdeen Asia-Pacific Income Fund, Inc. |
| Sector: Financials | |
| SubSector: Closed-End Fund - Debt | |
| MarketCap: 807.407 Millions | |
| Recent Price: 2.66 Smart Investing & Trading Score: 32 | |
| Day Percent Change: 1.92% Day Change: 0.05 | |
| Week Change: 0% Year-to-date Change: -1.9% | |
| FAX Links: Profile News Message Board | |
| Charts:- Daily , Weekly | |
| Add FAX to Watchlist: View: Get Complete FAX Trend Analysis ➞ | |
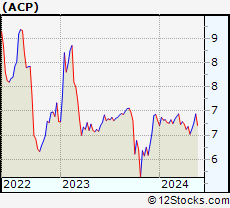 | ACP Aberdeen Income Credit Strategies Fund |
| Sector: Financials | |
| SubSector: Closed-End Fund - Debt | |
| MarketCap: 119.207 Millions | |
| Recent Price: 6.70 Smart Investing & Trading Score: 42 | |
| Day Percent Change: 1.06% Day Change: 0.07 | |
| Week Change: 0% Year-to-date Change: -1.5% | |
| ACP Links: Profile News Message Board | |
| Charts:- Daily , Weekly | |
| Add ACP to Watchlist: View: Get Complete ACP Trend Analysis ➞ | |
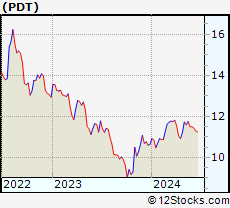 | PDT John Hancock Premium Dividend Fund |
| Sector: Financials | |
| SubSector: Closed-End Fund - Debt | |
| MarketCap: 404.207 Millions | |
| Recent Price: 11.50 Smart Investing & Trading Score: 55 | |
| Day Percent Change: 1.41% Day Change: 0.16 | |
| Week Change: 0% Year-to-date Change: 8.0% | |
| PDT Links: Profile News Message Board | |
| Charts:- Daily , Weekly | |
| Add PDT to Watchlist: View: Get Complete PDT Trend Analysis ➞ | |
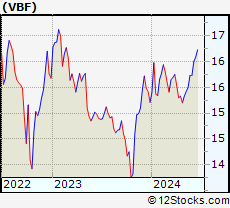 | VBF Invesco Bond Fund |
| Sector: Financials | |
| SubSector: Closed-End Fund - Debt | |
| MarketCap: 177.307 Millions | |
| Recent Price: 15.73 Smart Investing & Trading Score: 67 | |
| Day Percent Change: 0.58% Day Change: 0.09 | |
| Week Change: 0% Year-to-date Change: 3.4% | |
| VBF Links: Profile News Message Board | |
| Charts:- Daily , Weekly | |
| Add VBF to Watchlist: View: Get Complete VBF Trend Analysis ➞ | |
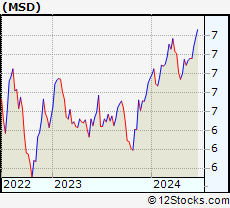 | MSD Morgan Stanley Emerging Markets Debt Fund, Inc. |
| Sector: Financials | |
| SubSector: Closed-End Fund - Debt | |
| MarketCap: 149.407 Millions | |
| Recent Price: 7.16 Smart Investing & Trading Score: 55 | |
| Day Percent Change: 0.29% Day Change: 0.02 | |
| Week Change: 0% Year-to-date Change: 3.0% | |
| MSD Links: Profile News Message Board | |
| Charts:- Daily , Weekly | |
| Add MSD to Watchlist: View: Get Complete MSD Trend Analysis ➞ | |
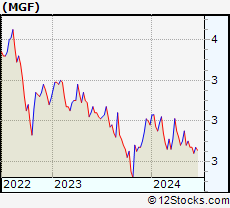 | MGF MFS Government Markets Income Trust |
| Sector: Financials | |
| SubSector: Closed-End Fund - Debt | |
| MarketCap: 141.807 Millions | |
| Recent Price: 3.07 Smart Investing & Trading Score: 17 | |
| Day Percent Change: 0.99% Day Change: 0.03 | |
| Week Change: 0% Year-to-date Change: -3.5% | |
| MGF Links: Profile News Message Board | |
| Charts:- Daily , Weekly | |
| Add MGF to Watchlist: View: Get Complete MGF Trend Analysis ➞ | |
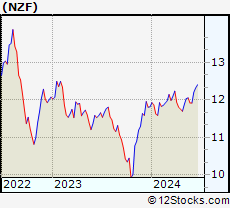 | NZF Nuveen Municipal Credit Income Fund |
| Sector: Financials | |
| SubSector: Asset Management | |
| MarketCap: 1779.43 Millions | |
| Recent Price: 11.92 Smart Investing & Trading Score: 58 | |
| Day Percent Change: 1.02% Day Change: 0.12 | |
| Week Change: 0% Year-to-date Change: 0.9% | |
| NZF Links: Profile News Message Board | |
| Charts:- Daily , Weekly | |
| Add NZF to Watchlist: View: Get Complete NZF Trend Analysis ➞ | |
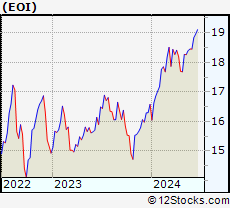 | EOI Eaton Vance Enhanced Equity Income Fund |
| Sector: Financials | |
| SubSector: Closed-End Fund - Equity | |
| MarketCap: 406.247 Millions | |
| Recent Price: 18.45 Smart Investing & Trading Score: 86 | |
| Day Percent Change: 0.99% Day Change: 0.18 | |
| Week Change: 0% Year-to-date Change: 11.3% | |
| EOI Links: Profile News Message Board | |
| Charts:- Daily , Weekly | |
| Add EOI to Watchlist: View: Get Complete EOI Trend Analysis ➞ | |
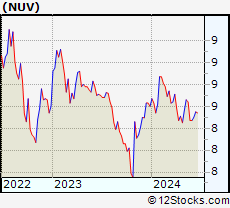 | NUV Nuveen Municipal Value Fund, Inc. |
| Sector: Financials | |
| SubSector: Closed-End Fund - Debt | |
| MarketCap: 1890.87 Millions | |
| Recent Price: 8.47 Smart Investing & Trading Score: 25 | |
| Day Percent Change: 0.95% Day Change: 0.08 | |
| Week Change: 0% Year-to-date Change: -1.5% | |
| NUV Links: Profile News Message Board | |
| Charts:- Daily , Weekly | |
| Add NUV to Watchlist: View: Get Complete NUV Trend Analysis ➞ | |
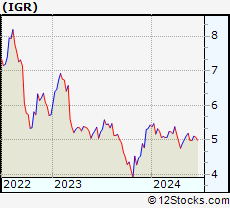 | IGR CBRE Clarion Global Real Estate Income Fund |
| Sector: Financials | |
| SubSector: Closed-End Fund - Foreign | |
| MarketCap: 494.347 Millions | |
| Recent Price: 4.98 Smart Investing & Trading Score: 42 | |
| Day Percent Change: 2.05% Day Change: 0.10 | |
| Week Change: 0% Year-to-date Change: -8.3% | |
| IGR Links: Profile News Message Board | |
| Charts:- Daily , Weekly | |
| Add IGR to Watchlist: View: Get Complete IGR Trend Analysis ➞ | |
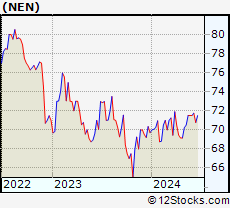 | NEN New England Realty Associates Limited Partnership |
| Sector: Financials | |
| SubSector: Real Estate Development | |
| MarketCap: 153.819 Millions | |
| Recent Price: 71.50 Smart Investing & Trading Score: 75 | |
| Day Percent Change: -0.63% Day Change: -0.45 | |
| Week Change: 0% Year-to-date Change: 2.6% | |
| NEN Links: Profile News Message Board | |
| Charts:- Daily , Weekly | |
| Add NEN to Watchlist: View: Get Complete NEN Trend Analysis ➞ | |
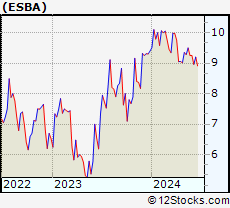 | ESBA Empire State Realty OP, L.P. |
| Sector: Financials | |
| SubSector: REIT - Office | |
| MarketCap: 220.866 Millions | |
| Recent Price: 9.25 Smart Investing & Trading Score: 49 | |
| Day Percent Change: 1.98% Day Change: 0.18 | |
| Week Change: 0% Year-to-date Change: -1.6% | |
| ESBA Links: Profile News Message Board | |
| Charts:- Daily , Weekly | |
| Add ESBA to Watchlist: View: Get Complete ESBA Trend Analysis ➞ | |
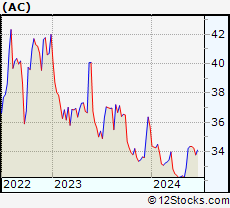 | AC Associated Capital Group, Inc. |
| Sector: Financials | |
| SubSector: Asset Management | |
| MarketCap: 657.503 Millions | |
| Recent Price: 34.35 Smart Investing & Trading Score: 83 | |
| Day Percent Change: -0.09% Day Change: -0.03 | |
| Week Change: 0% Year-to-date Change: -3.8% | |
| AC Links: Profile News Message Board | |
| Charts:- Daily , Weekly | |
| Add AC to Watchlist: View: Get Complete AC Trend Analysis ➞ | |
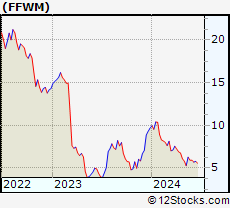 | FFWM First Foundation Inc. |
| Sector: Financials | |
| SubSector: Regional - Midwest Banks | |
| MarketCap: 457.17 Millions | |
| Recent Price: 5.92 Smart Investing & Trading Score: 62 | |
| Day Percent Change: 4.04% Day Change: 0.23 | |
| Week Change: 0% Year-to-date Change: -38.8% | |
| FFWM Links: Profile News Message Board | |
| Charts:- Daily , Weekly | |
| Add FFWM to Watchlist: View: Get Complete FFWM Trend Analysis ➞ | |
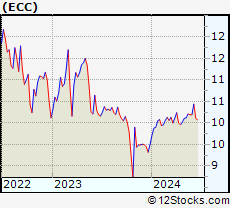 | ECC Eagle Point Credit Company Inc. |
| Sector: Financials | |
| SubSector: Closed-End Fund - Debt | |
| MarketCap: 173.207 Millions | |
| Recent Price: 10.19 Smart Investing & Trading Score: 76 | |
| Day Percent Change: 0.20% Day Change: 0.02 | |
| Week Change: 0% Year-to-date Change: 7.3% | |
| ECC Links: Profile News Message Board | |
| Charts:- Daily , Weekly | |
| Add ECC to Watchlist: View: Get Complete ECC Trend Analysis ➞ | |
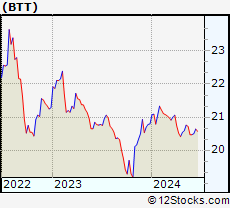 | BTT Blackrock Municipal 2030 Target Term Trust |
| Sector: Financials | |
| SubSector: Closed-End Fund - Debt | |
| MarketCap: 1438.37 Millions | |
| Recent Price: 20.47 Smart Investing & Trading Score: 25 | |
| Day Percent Change: 0.64% Day Change: 0.13 | |
| Week Change: 0% Year-to-date Change: -1.6% | |
| BTT Links: Profile News Message Board | |
| Charts:- Daily , Weekly | |
| Add BTT to Watchlist: View: Get Complete BTT Trend Analysis ➞ | |
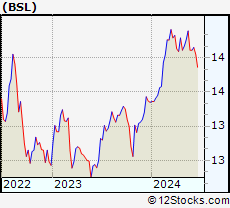 | BSL Blackstone/GSO Senior Floating Rate Term Fund |
| Sector: Financials | |
| SubSector: Closed-End Fund - Debt | |
| MarketCap: 174.807 Millions | |
| Recent Price: 14.11 Smart Investing & Trading Score: 50 | |
| Day Percent Change: 1.15% Day Change: 0.16 | |
| Week Change: 0% Year-to-date Change: 5.7% | |
| BSL Links: Profile News Message Board | |
| Charts:- Daily , Weekly | |
| Add BSL to Watchlist: View: Get Complete BSL Trend Analysis ➞ | |
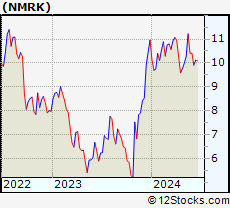 | NMRK Newmark Group, Inc. |
| Sector: Financials | |
| SubSector: Property Management | |
| MarketCap: 767.542 Millions | |
| Recent Price: 10.41 Smart Investing & Trading Score: 52 | |
| Day Percent Change: 1.26% Day Change: 0.13 | |
| Week Change: 0% Year-to-date Change: -5.0% | |
| NMRK Links: Profile News Message Board | |
| Charts:- Daily , Weekly | |
| Add NMRK to Watchlist: View: Get Complete NMRK Trend Analysis ➞ | |
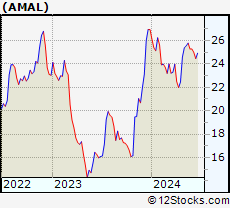 | AMAL Amalgamated Bank |
| Sector: Financials | |
| SubSector: Regional - Northeast Banks | |
| MarketCap: 321.899 Millions | |
| Recent Price: 25.28 Smart Investing & Trading Score: 59 | |
| Day Percent Change: 0.32% Day Change: 0.08 | |
| Week Change: 0% Year-to-date Change: -6.2% | |
| AMAL Links: Profile News Message Board | |
| Charts:- Daily , Weekly | |
| Add AMAL to Watchlist: View: Get Complete AMAL Trend Analysis ➞ | |
| For tabular summary view of above stock list: Summary View ➞ 0 - 25 , 25 - 50 , 50 - 75 , 75 - 100 , 100 - 125 , 125 - 150 , 150 - 175 , 175 - 200 , 200 - 225 , 225 - 250 , 250 - 275 , 275 - 300 , 300 - 325 , 325 - 350 , 350 - 375 , 375 - 400 , 400 - 425 , 425 - 450 , 450 - 475 , 475 - 500 , 500 - 525 , 525 - 550 , 550 - 575 , 575 - 600 , 600 - 625 , 625 - 650 , 650 - 675 , 675 - 700 , 700 - 725 , 725 - 750 , 750 - 775 , 775 - 800 , 800 - 825 , 825 - 850 , 850 - 875 , 875 - 900 , 900 - 925 , 925 - 950 , 950 - 975 , 975 - 1000 , 1000 - 1025 , 1025 - 1050 , 1050 - 1075 , 1075 - 1100 , 1100 - 1125 , 1125 - 1150 , 1150 - 1175 , 1175 - 1200 , 1200 - 1225 | ||
| Click To Change The Sort Order: By Market Cap or Company Size Performance: Year-to-date, Week and Day | |
| Select Chart Type: | ||
|
Best Stocks Today 12Stocks.com |
© 2024 12Stocks.com Terms & Conditions Privacy Contact Us
All Information Provided Only For Education And Not To Be Used For Investing or Trading. See Terms & Conditions


One More Thing ... Get Best Stocks Delivered Daily!
Never Ever Miss A Move With Our Top Ten Stocks Lists
Find Best Stocks In Any Market - Bull or Bear Market
Take A Peek At Our Top Ten Stocks Lists: Daily, Weekly, Year-to-Date & Top Trends
Find Best Stocks In Any Market - Bull or Bear Market
Take A Peek At Our Top Ten Stocks Lists: Daily, Weekly, Year-to-Date & Top Trends
Financial Stocks With Best Up Trends [0-bearish to 100-bullish]: X [100], Brighthouse [100], Central and[100], Northrim BanCorp[100], Bank of America[100], Hagerty [100], Urban Edge[100], Global Blockchain[100], Ventas [100], Omega Healthcare[100], LPL [100]
Best Financial Stocks Year-to-Date:
Root [385.58%], Chimera [138.48%], Banco Macro[130.98%], SelectQuote [127.74%], Gladstone Capital[109.35%], Grupo Financiero[107.65%], Banco BBVA[107.54%], EverQuote [95.18%], Hippo [93.63%], Grupo Supervielle[78.33%], Vista Oil[64.18%] Best Financial Stocks This Week:
C3.ai [23%], Investors Title[19.4%], Banco BBVA[14.74%], Riverview Bancorp[14.25%], Banco Macro[13.7%], IRSA Inversiones[12.15%], Grupo Supervielle[11.73%], Metals Acquisition[10.74%], Grupo Financiero[10.41%], Fathom [10.24%], Vista Oil[9.32%] Best Financial Stocks Daily:
Riverview Bancorp[15.75%], Allied World[14.88%], Medical Properties[7.20%], X [6.14%], Franklin Street[5.32%], Washington Federal[5.16%], Iris Energy[5.13%], Ameris Bancorp[4.80%], Brighthouse [4.79%], Auburn National[4.70%], Central and[4.63%]