
 Login Sign Up


| |||||
 |  | ||||

| 12Stocks.com Market Intelligence |
Best Financial Stocks
| In a hurry? Financial Stocks Lists: Performance Trends Table, Stock Charts
Sort Financial stocks: Daily, Weekly, Year-to-Date, Market Cap & Trends. Filter Financial stocks list by size:All Financial Large Mid-Range Small & MicroCap |
| 12Stocks.com Financial Stocks Performances & Trends Daily | |||||||||
|
|  The overall Smart Investing & Trading Score is 78 (0-bearish to 100-bullish) which puts Financial sector in short term neutral to bullish trend. The Smart Investing & Trading Score from previous trading session is 46 and hence an improvement of trend.
| ||||||||
Here are the Smart Investing & Trading Scores of the most requested Financial stocks at 12Stocks.com (click stock name for detailed review):
|


| 12Stocks.com: Investing in Financial sector with Stocks | |
|
The following table helps investors and traders sort through current performance and trends (as measured by Smart Investing & Trading Score) of various
stocks in the Financial sector. Quick View: Move mouse or cursor over stock symbol (ticker) to view short-term Technical chart and over stock name to view long term chart. Click on  to add stock symbol to your watchlist and to add stock symbol to your watchlist and  to view watchlist. Click on any ticker or stock name for detailed market intelligence report for that stock. to view watchlist. Click on any ticker or stock name for detailed market intelligence report for that stock. |
12Stocks.com Performance of Stocks in Financial Sector
| Ticker | Stock Name | Watchlist | Category | Recent Price | Trend Score | Change % | YTD Change% |
| PRLH | Pearl |   | SPAC | 11.10 | 88 | -0.89% | 4.03% |
| VEL | Velocity | | Mortgage Finance | 18.50 | 88 | 2.38% | 11.31% |
| CGBD | TCG BDC | | Asset Mgmt | 17.92 | 88 | 0.73% | 19.79% |
| WSR | Whitestone REIT | | REIT - Retail | 13.04 | 88 | 0.62% | 6.10% |
| PTY | PIMCO Corporate | | Closed-End Fund - Debt | 14.44 | 88 | 0.56% | 9.06% |
| AGNCM | AGNC | | Mortgage | 25.18 | 88 | 0.36% | 7.10% |
| APO | Apollo Global | | Investments | 116.16 | 88 | -0.52% | 24.65% |
| PML | PIMCO Municipal | | Closed-End Fund - Debt | 8.57 | 87 | 1.54% | 3.25% |
| GBAB | Guggenheim Taxable | | Closed-End Fund - Debt | 16.25 | 87 | 0.93% | 0.37% |
| LDP | Cohen & Steers Duration Preferred and ome Fund | | Closed-End Fund - Debt | 19.94 | 87 | 0.45% | 8.19% |
| FBMS | First Bancshares | | Regional Banks | 25.35 | 86 | 1.73% | -13.57% |
| BNL | Broadstone Net | | REIT | 15.35 | 86 | 1.66% | -10.86% |
| WAL | Western Alliance | | Regional Banks | 63.03 | 86 | 1.56% | -4.20% |
| AMP | Ameriprise | | Asset Mgmt | 436.61 | 86 | 1.42% | 14.95% |
| PDO | Pimco Dynamic | | Closed-End Fund - Debt | 13.28 | 86 | 1.37% | 9.12% |
| TY | Tri-Continental | | Closed-End Fund - Equity | 30.79 | 86 | 1.32% | 6.80% |
| ALEX | Alexander & Baldwin | | Real Estatet | 16.80 | 86 | 1.14% | -11.67% |
| JCE | Nuveen Core | | Closed-End Fund - Equity | 14.24 | 86 | 1.14% | 5.09% |
| SSUS | Day Hagan/Ned | | Exchange Traded Fund | 38.34 | 86 | 1.03% | 7.55% |
| RVT | Royce Value | | Closed-End Fund - Equity | 14.92 | 86 | 1.02% | 2.47% |
| DFAI | Dimensional | | Exchange Traded Fund | 30.71 | 86 | 1.02% | 7.23% |
| TDSC | Cabana Target | | Exchange Traded Fund | 24.12 | 86 | 1.01% | 3.48% |
| EOI | Eaton Vance | | Closed-End Fund - Equity | 18.45 | 86 | 0.99% | 11.28% |
| SQEW | LeaderShares Equity | | Exchange Traded Fund | 32.66 | 86 | 0.83% | 4.50% |
| IQSI | IQ Candriam | | Exchange Traded Fund | 30.08 | 86 | 0.76% | 6.62% |
| For chart view version of above stock list: Chart View ➞ 0 - 25 , 25 - 50 , 50 - 75 , 75 - 100 , 100 - 125 , 125 - 150 , 150 - 175 , 175 - 200 , 200 - 225 , 225 - 250 , 250 - 275 , 275 - 300 , 300 - 325 , 325 - 350 , 350 - 375 , 375 - 400 , 400 - 425 , 425 - 450 , 450 - 475 , 475 - 500 , 500 - 525 , 525 - 550 , 550 - 575 , 575 - 600 , 600 - 625 , 625 - 650 , 650 - 675 , 675 - 700 , 700 - 725 , 725 - 750 , 750 - 775 , 775 - 800 , 800 - 825 , 825 - 850 , 850 - 875 , 875 - 900 , 900 - 925 , 925 - 950 , 950 - 975 , 975 - 1000 , 1000 - 1025 , 1025 - 1050 , 1050 - 1075 , 1075 - 1100 , 1100 - 1125 , 1125 - 1150 , 1150 - 1175 , 1175 - 1200 , 1200 - 1225 | ||
 | Click To Change The Sort Order: By Market Cap or Company Size Performance: Year-to-date, Week and Day |  |
|
Get the most comprehensive stock market coverage daily at 12Stocks.com ➞ Best Stocks Today ➞ Best Stocks Weekly ➞ Best Stocks Year-to-Date ➞ Best Stocks Trends ➞  Best Stocks Today 12Stocks.com Best Nasdaq Stocks ➞ Best S&P 500 Stocks ➞ Best Tech Stocks ➞ Best Biotech Stocks ➞ |
| Detailed Overview of Financial Stocks |
| Financial Technical Overview, Leaders & Laggards, Top Financial ETF Funds & Detailed Financial Stocks List, Charts, Trends & More |
| Financial Sector: Technical Analysis, Trends & YTD Performance | |
| Financial sector is composed of stocks
from banks, brokers, insurance, REITs
and services subsectors. Financial sector, as represented by XLF, an exchange-traded fund [ETF] that holds basket of Financial stocks (e.g, Bank of America, Goldman Sachs) is up by 10.74% and is currently outperforming the overall market by 0.95% year-to-date. Below is a quick view of Technical charts and trends: |
|
 XLF Weekly Chart |
|
| Long Term Trend: Very Good | |
| Medium Term Trend: Good | |
 XLF Daily Chart |
|
| Short Term Trend: Very Good | |
| Overall Trend Score: 78 | |
| YTD Performance: 10.74% | |
| **Trend Scores & Views Are Only For Educational Purposes And Not For Investing | |
| 12Stocks.com: Top Performing Financial Sector Stocks | ||||||||||||||||||||||||||||||||||||||||||||||||
 The top performing Financial sector stocks year to date are
Now, more recently, over last week, the top performing Financial sector stocks on the move are


|
||||||||||||||||||||||||||||||||||||||||||||||||
| 12Stocks.com: Investing in Financial Sector using Exchange Traded Funds | |
|
The following table shows list of key exchange traded funds (ETF) that
help investors track Financial Index. For detailed view, check out our ETF Funds section of our website. Quick View: Move mouse or cursor over ETF symbol (ticker) to view short-term Technical chart and over ETF name to view long term chart. Click on ticker or stock name for detailed view. Click on to add stock symbol to your watchlist and to view watchlist. |
12Stocks.com List of ETFs that track Financial Index
| Ticker | ETF Name | Watchlist | Recent Price | Smart Investing & Trading Score | Change % | Week % | Year-to-date % |
| XLF | Financial | | 41.64 | 78 | 1.46 | 0.07 | 10.74% |
| IAI | Broker-Dealers & Secs | | 116.64 | 58 | 0.53 | -1.91 | 7.47% |
| IYF | Financials | | 95.25 | 78 | 1.32 | 0.03 | 11.52% |
| IYG | Financial Services | | 65.74 | 71 | 1.14 | -0.33 | 10.05% |
| KRE | Regional Banking | | 48.85 | 61 | 1.41 | -0.14 | -6.83% |
| IXG | Global Financials | | 87.05 | 76 | 0.80 | -0.54 | 10.77% |
| VFH | Financials | | 101.01 | 78 | 1.28 | -0.12 | 9.48% |
| KBE | Bank | | 46.23 | 68 | 1.34 | 0 | 0.46% |
| FAS | Financial Bull 3X | | 105.34 | 78 | 4.16 | -0.02 | 27.45% |
| FAZ | Financial Bear 3X | | 10.35 | 17 | -4.08 | -0.1 | -24.29% |
| UYG | Financials | | 65.65 | 78 | 3.19 | -0.03 | 18.93% |
| IAT | Regional Banks | | 41.90 | 68 | 1.87 | 0 | 0.14% |
| KIE | Insurance | | 51.16 | 78 | 1.11 | 0.69 | 13.14% |
| PSCF | SmallCap Financials | | 47.14 | 53 | 1.59 | -0.79 | -4.14% |
| EUFN | Europe Financials | | 24.18 | 100 | 1.02 | 0.71 | 15.36% |
| PGF | Financial Preferred | | 14.79 | 55 | 1.09 | 0.68 | 1.44% |
| 12Stocks.com: Charts, Trends, Fundamental Data and Performances of Financial Stocks | |
|
We now take in-depth look at all Financial stocks including charts, multi-period performances and overall trends (as measured by Smart Investing & Trading Score). One can sort Financial stocks (click link to choose) by Daily, Weekly and by Year-to-Date performances. Also, one can sort by size of the company or by market capitalization. |
| Select Your Default Chart Type: | |||||
| |||||
| Click on stock symbol or name for detailed view. Click on to add stock symbol to your watchlist and to view watchlist. Quick View: Move mouse or cursor over "Daily" to quickly view daily Technical stock chart and over "Weekly" to view weekly Technical stock chart. | |||||

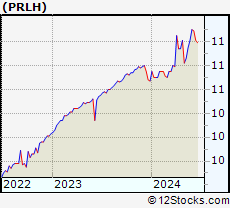 | PRLH Pearl Holdings Acquisition Corp |
| Sector: Financials | |
| SubSector: SPAC | |
| MarketCap: 264 Millions | |
| Recent Price: 11.10 Smart Investing & Trading Score: 88 | |
| Day Percent Change: -0.89% Day Change: -0.10 | |
| Week Change: 0.82% Year-to-date Change: 4.0% | |
| PRLH Links: Profile News Message Board | |
| Charts:- Daily , Weekly | |
| Add PRLH to Watchlist: View: Get Complete PRLH Trend Analysis ➞ | |
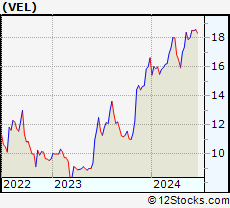 | VEL Velocity Financial, Inc. |
| Sector: Financials | |
| SubSector: Mortgage Finance | |
| MarketCap: 12157 Millions | |
| Recent Price: 18.50 Smart Investing & Trading Score: 88 | |
| Day Percent Change: 2.38% Day Change: 0.43 | |
| Week Change: 2.83% Year-to-date Change: 11.3% | |
| VEL Links: Profile News Message Board | |
| Charts:- Daily , Weekly | |
| Add VEL to Watchlist: View: Get Complete VEL Trend Analysis ➞ | |
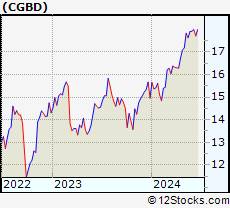 | CGBD TCG BDC, Inc. |
| Sector: Financials | |
| SubSector: Asset Management | |
| MarketCap: 379.003 Millions | |
| Recent Price: 17.92 Smart Investing & Trading Score: 88 | |
| Day Percent Change: 0.73% Day Change: 0.13 | |
| Week Change: 0.08% Year-to-date Change: 19.8% | |
| CGBD Links: Profile News Message Board | |
| Charts:- Daily , Weekly | |
| Add CGBD to Watchlist: View: Get Complete CGBD Trend Analysis ➞ | |
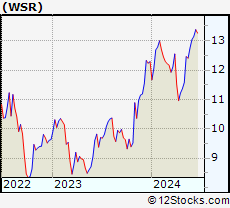 | WSR Whitestone REIT |
| Sector: Financials | |
| SubSector: REIT - Retail | |
| MarketCap: 316.114 Millions | |
| Recent Price: 13.04 Smart Investing & Trading Score: 88 | |
| Day Percent Change: 0.62% Day Change: 0.08 | |
| Week Change: 2.27% Year-to-date Change: 6.1% | |
| WSR Links: Profile News Message Board | |
| Charts:- Daily , Weekly | |
| Add WSR to Watchlist: View: Get Complete WSR Trend Analysis ➞ | |
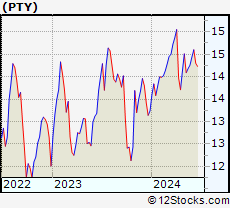 | PTY PIMCO Corporate & Income Opportunity Fund |
| Sector: Financials | |
| SubSector: Closed-End Fund - Debt | |
| MarketCap: 1085.87 Millions | |
| Recent Price: 14.44 Smart Investing & Trading Score: 88 | |
| Day Percent Change: 0.56% Day Change: 0.08 | |
| Week Change: 1.26% Year-to-date Change: 9.1% | |
| PTY Links: Profile News Message Board | |
| Charts:- Daily , Weekly | |
| Add PTY to Watchlist: View: Get Complete PTY Trend Analysis ➞ | |
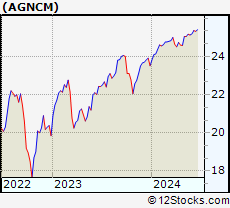 | AGNCM AGNC Investment Corp. |
| Sector: Financials | |
| SubSector: Mortgage Investment | |
| MarketCap: 7568.89 Millions | |
| Recent Price: 25.18 Smart Investing & Trading Score: 88 | |
| Day Percent Change: 0.36% Day Change: 0.09 | |
| Week Change: 0.24% Year-to-date Change: 7.1% | |
| AGNCM Links: Profile News Message Board | |
| Charts:- Daily , Weekly | |
| Add AGNCM to Watchlist: View: Get Complete AGNCM Trend Analysis ➞ | |
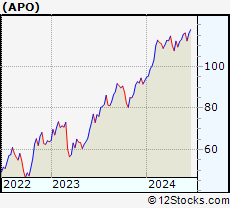 | APO Apollo Global Management, Inc. |
| Sector: Financials | |
| SubSector: Diversified Investments | |
| MarketCap: 12706 Millions | |
| Recent Price: 116.16 Smart Investing & Trading Score: 88 | |
| Day Percent Change: -0.52% Day Change: -0.61 | |
| Week Change: 0.55% Year-to-date Change: 24.7% | |
| APO Links: Profile News Message Board | |
| Charts:- Daily , Weekly | |
| Add APO to Watchlist: View: Get Complete APO Trend Analysis ➞ | |
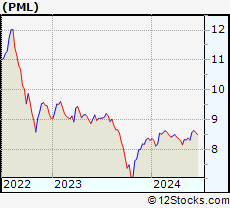 | PML PIMCO Municipal Income Fund II |
| Sector: Financials | |
| SubSector: Closed-End Fund - Debt | |
| MarketCap: 688.207 Millions | |
| Recent Price: 8.57 Smart Investing & Trading Score: 87 | |
| Day Percent Change: 1.54% Day Change: 0.13 | |
| Week Change: 3.13% Year-to-date Change: 3.3% | |
| PML Links: Profile News Message Board | |
| Charts:- Daily , Weekly | |
| Add PML to Watchlist: View: Get Complete PML Trend Analysis ➞ | |
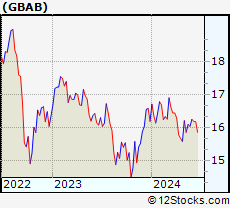 | GBAB Guggenheim Taxable Municipal Managed Duration Trust |
| Sector: Financials | |
| SubSector: Closed-End Fund - Debt | |
| MarketCap: 344.607 Millions | |
| Recent Price: 16.25 Smart Investing & Trading Score: 87 | |
| Day Percent Change: 0.93% Day Change: 0.15 | |
| Week Change: 1.31% Year-to-date Change: 0.4% | |
| GBAB Links: Profile News Message Board | |
| Charts:- Daily , Weekly | |
| Add GBAB to Watchlist: View: Get Complete GBAB Trend Analysis ➞ | |
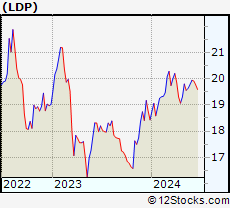 | LDP Cohen & Steers Limited Duration Preferred and Income Fund, Inc. |
| Sector: Financials | |
| SubSector: Closed-End Fund - Debt | |
| MarketCap: 491.507 Millions | |
| Recent Price: 19.94 Smart Investing & Trading Score: 87 | |
| Day Percent Change: 0.45% Day Change: 0.09 | |
| Week Change: 0.81% Year-to-date Change: 8.2% | |
| LDP Links: Profile News Message Board | |
| Charts:- Daily , Weekly | |
| Add LDP to Watchlist: View: Get Complete LDP Trend Analysis ➞ | |
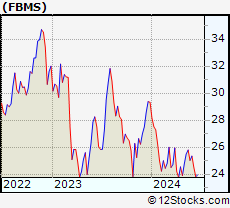 | FBMS The First Bancshares, Inc. |
| Sector: Financials | |
| SubSector: Regional - Southeast Banks | |
| MarketCap: 359.535 Millions | |
| Recent Price: 25.35 Smart Investing & Trading Score: 86 | |
| Day Percent Change: 1.73% Day Change: 0.43 | |
| Week Change: 1.32% Year-to-date Change: -13.6% | |
| FBMS Links: Profile News Message Board | |
| Charts:- Daily , Weekly | |
| Add FBMS to Watchlist: View: Get Complete FBMS Trend Analysis ➞ | |
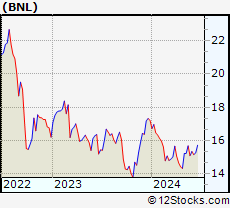 | BNL Broadstone Net Lease, Inc. |
| Sector: Financials | |
| SubSector: REIT Diversified | |
| MarketCap: 27267 Millions | |
| Recent Price: 15.35 Smart Investing & Trading Score: 86 | |
| Day Percent Change: 1.66% Day Change: 0.25 | |
| Week Change: 1.66% Year-to-date Change: -10.9% | |
| BNL Links: Profile News Message Board | |
| Charts:- Daily , Weekly | |
| Add BNL to Watchlist: View: Get Complete BNL Trend Analysis ➞ | |
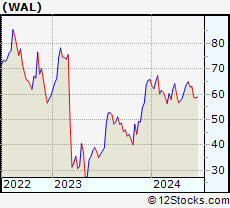 | WAL Western Alliance Bancorporation |
| Sector: Financials | |
| SubSector: Regional - Pacific Banks | |
| MarketCap: 2980.09 Millions | |
| Recent Price: 63.03 Smart Investing & Trading Score: 86 | |
| Day Percent Change: 1.56% Day Change: 0.97 | |
| Week Change: 0.11% Year-to-date Change: -4.2% | |
| WAL Links: Profile News Message Board | |
| Charts:- Daily , Weekly | |
| Add WAL to Watchlist: View: Get Complete WAL Trend Analysis ➞ | |
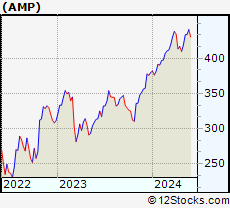 | AMP Ameriprise Financial, Inc. |
| Sector: Financials | |
| SubSector: Asset Management | |
| MarketCap: 13270.5 Millions | |
| Recent Price: 436.61 Smart Investing & Trading Score: 86 | |
| Day Percent Change: 1.42% Day Change: 6.10 | |
| Week Change: -0.99% Year-to-date Change: 15.0% | |
| AMP Links: Profile News Message Board | |
| Charts:- Daily , Weekly | |
| Add AMP to Watchlist: View: Get Complete AMP Trend Analysis ➞ | |
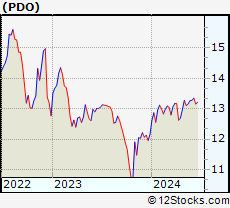 | PDO Pimco Dynamic Income Opportunities Fund |
| Sector: Financials | |
| SubSector: Closed-End Fund - Debt | |
| MarketCap: 1440 Millions | |
| Recent Price: 13.28 Smart Investing & Trading Score: 86 | |
| Day Percent Change: 1.37% Day Change: 0.18 | |
| Week Change: 0.11% Year-to-date Change: 9.1% | |
| PDO Links: Profile News Message Board | |
| Charts:- Daily , Weekly | |
| Add PDO to Watchlist: View: Get Complete PDO Trend Analysis ➞ | |
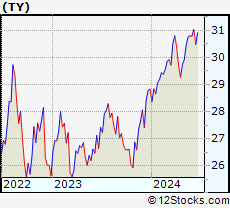 | TY Tri-Continental Corporation |
| Sector: Financials | |
| SubSector: Closed-End Fund - Equity | |
| MarketCap: 998.647 Millions | |
| Recent Price: 30.79 Smart Investing & Trading Score: 86 | |
| Day Percent Change: 1.32% Day Change: 0.40 | |
| Week Change: -0.03% Year-to-date Change: 6.8% | |
| TY Links: Profile News Message Board | |
| Charts:- Daily , Weekly | |
| Add TY to Watchlist: View: Get Complete TY Trend Analysis ➞ | |
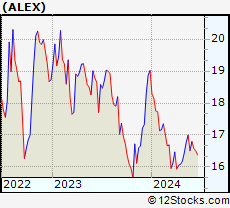 | ALEX Alexander & Baldwin, Inc. |
| Sector: Financials | |
| SubSector: Real Estate Development | |
| MarketCap: 751.419 Millions | |
| Recent Price: 16.80 Smart Investing & Trading Score: 86 | |
| Day Percent Change: 1.14% Day Change: 0.19 | |
| Week Change: 1.76% Year-to-date Change: -11.7% | |
| ALEX Links: Profile News Message Board | |
| Charts:- Daily , Weekly | |
| Add ALEX to Watchlist: View: Get Complete ALEX Trend Analysis ➞ | |
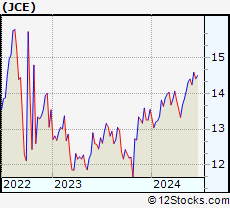 | JCE Nuveen Core Equity Alpha Fund |
| Sector: Financials | |
| SubSector: Closed-End Fund - Equity | |
| MarketCap: 144.747 Millions | |
| Recent Price: 14.24 Smart Investing & Trading Score: 86 | |
| Day Percent Change: 1.14% Day Change: 0.16 | |
| Week Change: -1.11% Year-to-date Change: 5.1% | |
| JCE Links: Profile News Message Board | |
| Charts:- Daily , Weekly | |
| Add JCE to Watchlist: View: Get Complete JCE Trend Analysis ➞ | |
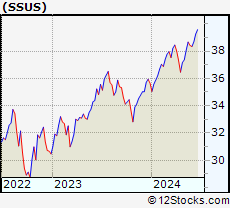 | SSUS Day Hagan/Ned Davis Research Smart Sector ETF |
| Sector: Financials | |
| SubSector: Exchange Traded Fund | |
| MarketCap: 60157 Millions | |
| Recent Price: 38.34 Smart Investing & Trading Score: 86 | |
| Day Percent Change: 1.03% Day Change: 0.39 | |
| Week Change: -0.21% Year-to-date Change: 7.6% | |
| SSUS Links: Profile News Message Board | |
| Charts:- Daily , Weekly | |
| Add SSUS to Watchlist: View: Get Complete SSUS Trend Analysis ➞ | |
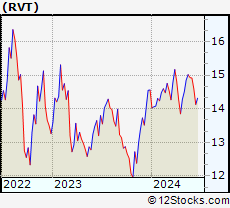 | RVT Royce Value Trust Inc. |
| Sector: Financials | |
| SubSector: Closed-End Fund - Equity | |
| MarketCap: 814.947 Millions | |
| Recent Price: 14.92 Smart Investing & Trading Score: 86 | |
| Day Percent Change: 1.02% Day Change: 0.15 | |
| Week Change: -0.07% Year-to-date Change: 2.5% | |
| RVT Links: Profile News Message Board | |
| Charts:- Daily , Weekly | |
| Add RVT to Watchlist: View: Get Complete RVT Trend Analysis ➞ | |
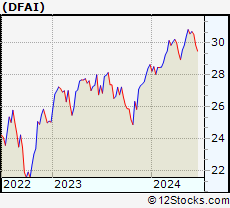 | DFAI Dimensional International Core Equity Market ETF |
| Sector: Financials | |
| SubSector: Exchange Traded Fund | |
| MarketCap: 60157 Millions | |
| Recent Price: 30.71 Smart Investing & Trading Score: 86 | |
| Day Percent Change: 1.02% Day Change: 0.31 | |
| Week Change: 0.45% Year-to-date Change: 7.2% | |
| DFAI Links: Profile News Message Board | |
| Charts:- Daily , Weekly | |
| Add DFAI to Watchlist: View: Get Complete DFAI Trend Analysis ➞ | |
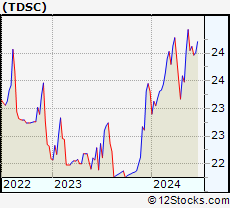 | TDSC Cabana Target Drawdown 10 ETF |
| Sector: Financials | |
| SubSector: Exchange Traded Fund | |
| MarketCap: 60157 Millions | |
| Recent Price: 24.12 Smart Investing & Trading Score: 86 | |
| Day Percent Change: 1.01% Day Change: 0.24 | |
| Week Change: 0.3% Year-to-date Change: 3.5% | |
| TDSC Links: Profile News Message Board | |
| Charts:- Daily , Weekly | |
| Add TDSC to Watchlist: View: Get Complete TDSC Trend Analysis ➞ | |
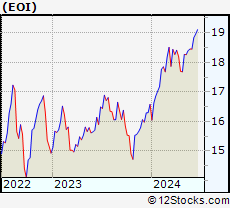 | EOI Eaton Vance Enhanced Equity Income Fund |
| Sector: Financials | |
| SubSector: Closed-End Fund - Equity | |
| MarketCap: 406.247 Millions | |
| Recent Price: 18.45 Smart Investing & Trading Score: 86 | |
| Day Percent Change: 0.99% Day Change: 0.18 | |
| Week Change: 0% Year-to-date Change: 11.3% | |
| EOI Links: Profile News Message Board | |
| Charts:- Daily , Weekly | |
| Add EOI to Watchlist: View: Get Complete EOI Trend Analysis ➞ | |
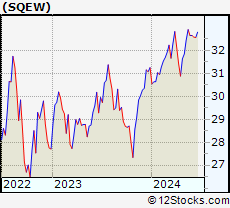 | SQEW LeaderShares Equity Skew ETF |
| Sector: Financials | |
| SubSector: Exchange Traded Fund | |
| MarketCap: 60157 Millions | |
| Recent Price: 32.66 Smart Investing & Trading Score: 86 | |
| Day Percent Change: 0.83% Day Change: 0.27 | |
| Week Change: 0.02% Year-to-date Change: 4.5% | |
| SQEW Links: Profile News Message Board | |
| Charts:- Daily , Weekly | |
| Add SQEW to Watchlist: View: Get Complete SQEW Trend Analysis ➞ | |
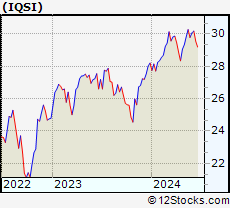 | IQSI IQ Candriam ESG International Equity ETF |
| Sector: Financials | |
| SubSector: Exchange Traded Fund | |
| MarketCap: 60157 Millions | |
| Recent Price: 30.08 Smart Investing & Trading Score: 86 | |
| Day Percent Change: 0.76% Day Change: 0.23 | |
| Week Change: 0.97% Year-to-date Change: 6.6% | |
| IQSI Links: Profile News Message Board | |
| Charts:- Daily , Weekly | |
| Add IQSI to Watchlist: View: Get Complete IQSI Trend Analysis ➞ | |
| For tabular summary view of above stock list: Summary View ➞ 0 - 25 , 25 - 50 , 50 - 75 , 75 - 100 , 100 - 125 , 125 - 150 , 150 - 175 , 175 - 200 , 200 - 225 , 225 - 250 , 250 - 275 , 275 - 300 , 300 - 325 , 325 - 350 , 350 - 375 , 375 - 400 , 400 - 425 , 425 - 450 , 450 - 475 , 475 - 500 , 500 - 525 , 525 - 550 , 550 - 575 , 575 - 600 , 600 - 625 , 625 - 650 , 650 - 675 , 675 - 700 , 700 - 725 , 725 - 750 , 750 - 775 , 775 - 800 , 800 - 825 , 825 - 850 , 850 - 875 , 875 - 900 , 900 - 925 , 925 - 950 , 950 - 975 , 975 - 1000 , 1000 - 1025 , 1025 - 1050 , 1050 - 1075 , 1075 - 1100 , 1100 - 1125 , 1125 - 1150 , 1150 - 1175 , 1175 - 1200 , 1200 - 1225 | ||
| Click To Change The Sort Order: By Market Cap or Company Size Performance: Year-to-date, Week and Day | |
| Select Chart Type: | ||
|
Best Stocks Today 12Stocks.com |
© 2024 12Stocks.com Terms & Conditions Privacy Contact Us
All Information Provided Only For Education And Not To Be Used For Investing or Trading. See Terms & Conditions


One More Thing ... Get Best Stocks Delivered Daily!
Never Ever Miss A Move With Our Top Ten Stocks Lists
Find Best Stocks In Any Market - Bull or Bear Market
Take A Peek At Our Top Ten Stocks Lists: Daily, Weekly, Year-to-Date & Top Trends
Find Best Stocks In Any Market - Bull or Bear Market
Take A Peek At Our Top Ten Stocks Lists: Daily, Weekly, Year-to-Date & Top Trends
Financial Stocks With Best Up Trends [0-bearish to 100-bullish]: X [100], Brighthouse [100], Central and[100], Northrim BanCorp[100], Bank of America[100], Hagerty [100], Urban Edge[100], Global Blockchain[100], Ventas [100], Omega Healthcare[100], LPL [100]
Best Financial Stocks Year-to-Date:
Root [385.58%], Chimera [138.48%], Banco Macro[130.98%], SelectQuote [127.74%], Gladstone Capital[109.35%], Grupo Financiero[107.65%], Banco BBVA[107.54%], EverQuote [95.18%], Hippo [93.63%], Grupo Supervielle[78.33%], Vista Oil[64.18%] Best Financial Stocks This Week:
C3.ai [23%], Investors Title[19.4%], Banco BBVA[14.74%], Riverview Bancorp[14.25%], Banco Macro[13.7%], IRSA Inversiones[12.15%], Grupo Supervielle[11.73%], Metals Acquisition[10.74%], Grupo Financiero[10.41%], Fathom [10.24%], Vista Oil[9.32%] Best Financial Stocks Daily:
Riverview Bancorp[15.75%], Allied World[14.88%], Medical Properties[7.20%], X [6.14%], Franklin Street[5.32%], Washington Federal[5.16%], Iris Energy[5.13%], Ameris Bancorp[4.80%], Brighthouse [4.79%], Auburn National[4.70%], Central and[4.63%]