
 Login Sign Up


| |||||
 |  | ||||

| 12Stocks.com Market Intelligence |
Best Financial Stocks
| In a hurry? Financial Stocks Lists: Performance Trends Table, Stock Charts
Sort Financial stocks: Daily, Weekly, Year-to-Date, Market Cap & Trends. Filter Financial stocks list by size:All Financial Large Mid-Range Small & MicroCap |
| 12Stocks.com Financial Stocks Performances & Trends Daily | |||||||||
|
|  The overall Smart Investing & Trading Score is 78 (0-bearish to 100-bullish) which puts Financial sector in short term neutral to bullish trend. The Smart Investing & Trading Score from previous trading session is 46 and hence an improvement of trend.
| ||||||||
Here are the Smart Investing & Trading Scores of the most requested Financial stocks at 12Stocks.com (click stock name for detailed review):
|


| 12Stocks.com: Investing in Financial sector with Stocks | |
|
The following table helps investors and traders sort through current performance and trends (as measured by Smart Investing & Trading Score) of various
stocks in the Financial sector. Quick View: Move mouse or cursor over stock symbol (ticker) to view short-term Technical chart and over stock name to view long term chart. Click on  to add stock symbol to your watchlist and to add stock symbol to your watchlist and  to view watchlist. Click on any ticker or stock name for detailed market intelligence report for that stock. to view watchlist. Click on any ticker or stock name for detailed market intelligence report for that stock. |
12Stocks.com Performance of Stocks in Financial Sector
| Ticker | Stock Name | Watchlist | Category | Recent Price | Smart Investing & Trading Score | Change % | YTD Change% |
| ALCYU | Alchemy s |   | SPAC | 10.70 | 34 | 0.00 | 2.00% |
| PHYT | Pyrophyte Acquisition | | SPAC | 11.40 | 58 | 0.00 | 3.64% |
| AFAR | Aura FAT | | SPAC | 11.31 | 66 | 0.00 | 4.06% |
| ALSA | Alpha Star | | SPAC | 11.44 | 58 | 0.00 | 2.23% |
| SBXC | SilverBox Corp | | SPAC | 10.57 | 61 | 0.00 | 2.22% |
| ISRLU | Israel Acquisitions | | SPAC | 10.88 | 21 | 0.00 | 0.93% |
| BFAC | Battery Future | | SPAC | 11.04 | 51 | 0.00 | 1.75% |
| IPXXU | Inflection Point | | SPAC | 10.50 | 31 | 0.00 | 1.45% |
| CSLM | Consilium Acquisition | | SPAC | 11.18 | 51 | 0.00 | 2.66% |
| ASCB | A SPAC | | SPAC | 11.20 | 58 | 0.00 | 3.13% |
| VMCA | Valuence Merger | | SPAC | 11.48 | 56 | 0.00 | 3.05% |
| RENE | Cartesian Growth | | SPAC | 11.25 | 48 | 0.00 | 2.83% |
| CITE | Cartica Acquisition | | SPAC | 11.20 | 48 | 0.00 | 2.66% |
| SVIIU | Spring Valley | | SPAC | 11.18 | 51 | 0.00 | 2.19% |
| IVCA | Investcorp India | | SPAC | 11.29 | 41 | 0.00 | 2.64% |
| EQH | Equitable | | Insurance | 41.49 | 100 | -0.02 | 24.59% |
| NDAQ | Nasdaq | | Investments | 59.03 | 34 | -0.03 | 1.53% |
| HWBK | Hawthorn Bancshares | | Regional Banks | 19.19 | 35 | -0.03 | -24.36% |
| TCHP | T. Rowe | | Exchange Traded Fund | 36.22 | 56 | -0.03 | 17.18% |
| TPL | Texas Pacific | | Real Estatet | 614.31 | 40 | -0.04 | -60.93% |
| RM | Regional Management | | Credit Services | 27.50 | 61 | -0.04 | 9.65% |
| RRAC | Rigel Resource | | SPAC | 11.29 | 41 | -0.04 | 2.73% |
| AACT | Ares Acquisition | | SPAC | 10.64 | 34 | -0.05 | 2.11% |
| RGA | Reinsurance | | Life Insurance | 209.80 | 66 | -0.09 | 29.68% |
| ISRL | Israel Acquisitions | | SPAC | 10.97 | 7 | -0.09 | 2.52% |
| For chart view version of above stock list: Chart View ➞ 0 - 25 , 25 - 50 , 50 - 75 , 75 - 100 , 100 - 125 , 125 - 150 , 150 - 175 , 175 - 200 , 200 - 225 , 225 - 250 , 250 - 275 , 275 - 300 , 300 - 325 , 325 - 350 , 350 - 375 , 375 - 400 , 400 - 425 , 425 - 450 , 450 - 475 , 475 - 500 , 500 - 525 , 525 - 550 , 550 - 575 , 575 - 600 , 600 - 625 , 625 - 650 , 650 - 675 , 675 - 700 , 700 - 725 , 725 - 750 , 750 - 775 , 775 - 800 , 800 - 825 , 825 - 850 , 850 - 875 , 875 - 900 , 900 - 925 , 925 - 950 , 950 - 975 , 975 - 1000 , 1000 - 1025 , 1025 - 1050 , 1050 - 1075 , 1075 - 1100 , 1100 - 1125 , 1125 - 1150 , 1150 - 1175 , 1175 - 1200 , 1200 - 1225 | ||
 | Click To Change The Sort Order: By Market Cap or Company Size Performance: Year-to-date, Week and Day |  |
|
Get the most comprehensive stock market coverage daily at 12Stocks.com ➞ Best Stocks Today ➞ Best Stocks Weekly ➞ Best Stocks Year-to-Date ➞ Best Stocks Trends ➞  Best Stocks Today 12Stocks.com Best Nasdaq Stocks ➞ Best S&P 500 Stocks ➞ Best Tech Stocks ➞ Best Biotech Stocks ➞ |
| Detailed Overview of Financial Stocks |
| Financial Technical Overview, Leaders & Laggards, Top Financial ETF Funds & Detailed Financial Stocks List, Charts, Trends & More |
| Financial Sector: Technical Analysis, Trends & YTD Performance | |
| Financial sector is composed of stocks
from banks, brokers, insurance, REITs
and services subsectors. Financial sector, as represented by XLF, an exchange-traded fund [ETF] that holds basket of Financial stocks (e.g, Bank of America, Goldman Sachs) is up by 10.74% and is currently outperforming the overall market by 0.95% year-to-date. Below is a quick view of Technical charts and trends: |
|
 XLF Weekly Chart |
|
| Long Term Trend: Very Good | |
| Medium Term Trend: Good | |
 XLF Daily Chart |
|
| Short Term Trend: Very Good | |
| Overall Trend Score: 78 | |
| YTD Performance: 10.74% | |
| **Trend Scores & Views Are Only For Educational Purposes And Not For Investing | |
| 12Stocks.com: Top Performing Financial Sector Stocks | ||||||||||||||||||||||||||||||||||||||||||||||||
 The top performing Financial sector stocks year to date are
Now, more recently, over last week, the top performing Financial sector stocks on the move are


|
||||||||||||||||||||||||||||||||||||||||||||||||
| 12Stocks.com: Investing in Financial Sector using Exchange Traded Funds | |
|
The following table shows list of key exchange traded funds (ETF) that
help investors track Financial Index. For detailed view, check out our ETF Funds section of our website. Quick View: Move mouse or cursor over ETF symbol (ticker) to view short-term Technical chart and over ETF name to view long term chart. Click on ticker or stock name for detailed view. Click on to add stock symbol to your watchlist and to view watchlist. |
12Stocks.com List of ETFs that track Financial Index
| Ticker | ETF Name | Watchlist | Recent Price | Smart Investing & Trading Score | Change % | Week % | Year-to-date % |
| XLF | Financial | | 41.64 | 78 | 1.46 | 0.07 | 10.74% |
| IAI | Broker-Dealers & Secs | | 116.64 | 58 | 0.53 | -1.91 | 7.47% |
| IYF | Financials | | 95.25 | 78 | 1.32 | 0.03 | 11.52% |
| IYG | Financial Services | | 65.74 | 71 | 1.14 | -0.33 | 10.05% |
| KRE | Regional Banking | | 48.85 | 61 | 1.41 | -0.14 | -6.83% |
| IXG | Global Financials | | 87.05 | 76 | 0.80 | -0.54 | 10.77% |
| VFH | Financials | | 101.01 | 78 | 1.28 | -0.12 | 9.48% |
| KBE | Bank | | 46.23 | 68 | 1.34 | 0 | 0.46% |
| FAS | Financial Bull 3X | | 105.34 | 78 | 4.16 | -0.02 | 27.45% |
| FAZ | Financial Bear 3X | | 10.35 | 17 | -4.08 | -0.1 | -24.29% |
| UYG | Financials | | 65.65 | 78 | 3.19 | -0.03 | 18.93% |
| IAT | Regional Banks | | 41.90 | 68 | 1.87 | 0 | 0.14% |
| KIE | Insurance | | 51.16 | 78 | 1.11 | 0.69 | 13.14% |
| PSCF | SmallCap Financials | | 47.14 | 53 | 1.59 | -0.79 | -4.14% |
| EUFN | Europe Financials | | 24.18 | 100 | 1.02 | 0.71 | 15.36% |
| PGF | Financial Preferred | | 14.79 | 55 | 1.09 | 0.68 | 1.44% |
| 12Stocks.com: Charts, Trends, Fundamental Data and Performances of Financial Stocks | |
|
We now take in-depth look at all Financial stocks including charts, multi-period performances and overall trends (as measured by Smart Investing & Trading Score). One can sort Financial stocks (click link to choose) by Daily, Weekly and by Year-to-Date performances. Also, one can sort by size of the company or by market capitalization. |
| Select Your Default Chart Type: | |||||
| |||||
| Click on stock symbol or name for detailed view. Click on to add stock symbol to your watchlist and to view watchlist. Quick View: Move mouse or cursor over "Daily" to quickly view daily Technical stock chart and over "Weekly" to view weekly Technical stock chart. | |||||

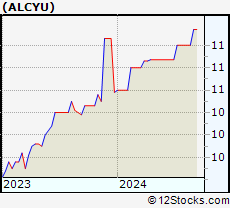 | ALCYU Alchemy Investments Acquisition Corp 1 |
| Sector: Financials | |
| SubSector: SPAC | |
| MarketCap: 147 Millions | |
| Recent Price: 10.70 Smart Investing & Trading Score: 34 | |
| Day Percent Change: 0.00% Day Change: 0.00 | |
| Week Change: 0% Year-to-date Change: 2.0% | |
| ALCYU Links: Profile News Message Board | |
| Charts:- Daily , Weekly | |
| Add ALCYU to Watchlist: View: Get Complete ALCYU Trend Analysis ➞ | |
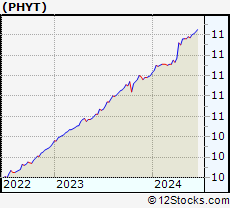 | PHYT Pyrophyte Acquisition Corp. |
| Sector: Financials | |
| SubSector: SPAC | |
| MarketCap: 149 Millions | |
| Recent Price: 11.40 Smart Investing & Trading Score: 58 | |
| Day Percent Change: 0.00% Day Change: 0.00 | |
| Week Change: 0.26% Year-to-date Change: 3.6% | |
| PHYT Links: Profile News Message Board | |
| Charts:- Daily , Weekly | |
| Add PHYT to Watchlist: View: Get Complete PHYT Trend Analysis ➞ | |
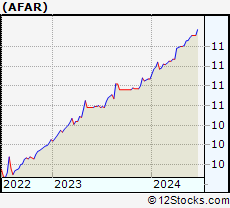 | AFAR Aura FAT Projects Acquisition Corp |
| Sector: Financials | |
| SubSector: SPAC | |
| MarketCap: 153 Millions | |
| Recent Price: 11.31 Smart Investing & Trading Score: 66 | |
| Day Percent Change: 0.00% Day Change: 0.00 | |
| Week Change: 0.19% Year-to-date Change: 4.1% | |
| AFAR Links: Profile News Message Board | |
| Charts:- Daily , Weekly | |
| Add AFAR to Watchlist: View: Get Complete AFAR Trend Analysis ➞ | |
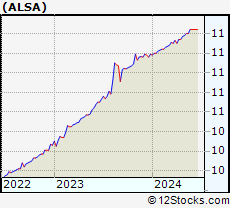 | ALSA Alpha Star Acquisition Corporation |
| Sector: Financials | |
| SubSector: SPAC | |
| MarketCap: 158 Millions | |
| Recent Price: 11.44 Smart Investing & Trading Score: 58 | |
| Day Percent Change: 0.00% Day Change: 0.00 | |
| Week Change: 0% Year-to-date Change: 2.2% | |
| ALSA Links: Profile News Message Board | |
| Charts:- Daily , Weekly | |
| Add ALSA to Watchlist: View: Get Complete ALSA Trend Analysis ➞ | |
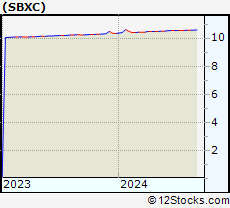 | SBXC SilverBox Corp III |
| Sector: Financials | |
| SubSector: SPAC | |
| MarketCap: 174 Millions | |
| Recent Price: 10.57 Smart Investing & Trading Score: 61 | |
| Day Percent Change: 0.00% Day Change: 0.00 | |
| Week Change: 0.19% Year-to-date Change: 2.2% | |
| SBXC Links: Profile News Message Board | |
| Charts:- Daily , Weekly | |
| Add SBXC to Watchlist: View: Get Complete SBXC Trend Analysis ➞ | |
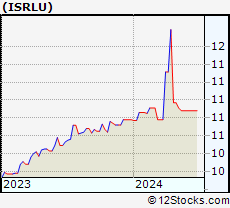 | ISRLU Israel Acquisitions Corp |
| Sector: Financials | |
| SubSector: SPAC | |
| MarketCap: 208 Millions | |
| Recent Price: 10.88 Smart Investing & Trading Score: 21 | |
| Day Percent Change: 0.00% Day Change: 0.00 | |
| Week Change: 0% Year-to-date Change: 0.9% | |
| ISRLU Links: Profile News Message Board | |
| Charts:- Daily , Weekly | |
| Add ISRLU to Watchlist: View: Get Complete ISRLU Trend Analysis ➞ | |
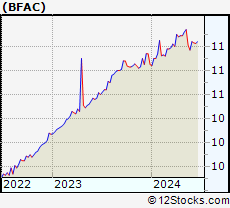 | BFAC Battery Future Acquisition Corp. |
| Sector: Financials | |
| SubSector: SPAC | |
| MarketCap: 213 Millions | |
| Recent Price: 11.04 Smart Investing & Trading Score: 51 | |
| Day Percent Change: 0.00% Day Change: 0.00 | |
| Week Change: 0.64% Year-to-date Change: 1.8% | |
| BFAC Links: Profile News Message Board | |
| Charts:- Daily , Weekly | |
| Add BFAC to Watchlist: View: Get Complete BFAC Trend Analysis ➞ | |
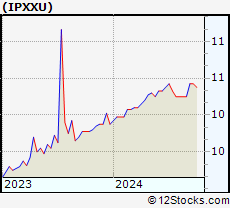 | IPXXU Inflection Point Acquisition Corp. II |
| Sector: Financials | |
| SubSector: SPAC | |
| MarketCap: 223 Millions | |
| Recent Price: 10.50 Smart Investing & Trading Score: 31 | |
| Day Percent Change: 0.00% Day Change: 0.00 | |
| Week Change: 0% Year-to-date Change: 1.5% | |
| IPXXU Links: Profile News Message Board | |
| Charts:- Daily , Weekly | |
| Add IPXXU to Watchlist: View: Get Complete IPXXU Trend Analysis ➞ | |
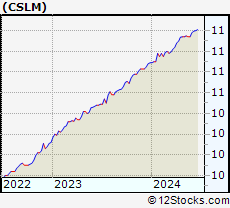 | CSLM Consilium Acquisition Corp I, Ltd. |
| Sector: Financials | |
| SubSector: SPAC | |
| MarketCap: 249 Millions | |
| Recent Price: 11.18 Smart Investing & Trading Score: 51 | |
| Day Percent Change: 0.00% Day Change: 0.00 | |
| Week Change: 0.36% Year-to-date Change: 2.7% | |
| CSLM Links: Profile News Message Board | |
| Charts:- Daily , Weekly | |
| Add CSLM to Watchlist: View: Get Complete CSLM Trend Analysis ➞ | |
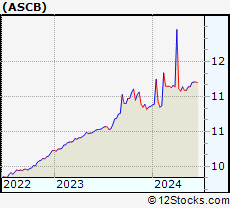 | ASCB A SPAC II Acquisition Corporation |
| Sector: Financials | |
| SubSector: SPAC | |
| MarketCap: 267 Millions | |
| Recent Price: 11.20 Smart Investing & Trading Score: 58 | |
| Day Percent Change: 0.00% Day Change: 0.00 | |
| Week Change: 0.54% Year-to-date Change: 3.1% | |
| ASCB Links: Profile News Message Board | |
| Charts:- Daily , Weekly | |
| Add ASCB to Watchlist: View: Get Complete ASCB Trend Analysis ➞ | |
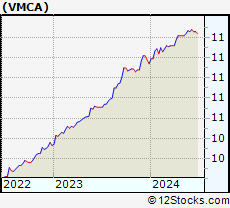 | VMCA Valuence Merger Corp. I |
| Sector: Financials | |
| SubSector: SPAC | |
| MarketCap: 295 Millions | |
| Recent Price: 11.48 Smart Investing & Trading Score: 56 | |
| Day Percent Change: 0.00% Day Change: 0.00 | |
| Week Change: 0.17% Year-to-date Change: 3.1% | |
| VMCA Links: Profile News Message Board | |
| Charts:- Daily , Weekly | |
| Add VMCA to Watchlist: View: Get Complete VMCA Trend Analysis ➞ | |
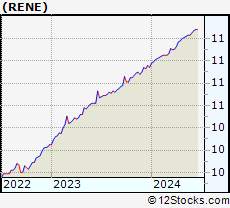 | RENE Cartesian Growth Corporation II |
| Sector: Financials | |
| SubSector: SPAC | |
| MarketCap: 307 Millions | |
| Recent Price: 11.25 Smart Investing & Trading Score: 48 | |
| Day Percent Change: 0.00% Day Change: 0.00 | |
| Week Change: 0.18% Year-to-date Change: 2.8% | |
| RENE Links: Profile News Message Board | |
| Charts:- Daily , Weekly | |
| Add RENE to Watchlist: View: Get Complete RENE Trend Analysis ➞ | |
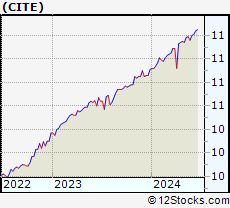 | CITE Cartica Acquisition Corp |
| Sector: Financials | |
| SubSector: SPAC | |
| MarketCap: 308 Millions | |
| Recent Price: 11.20 Smart Investing & Trading Score: 48 | |
| Day Percent Change: 0.00% Day Change: 0.00 | |
| Week Change: 0.36% Year-to-date Change: 2.7% | |
| CITE Links: Profile News Message Board | |
| Charts:- Daily , Weekly | |
| Add CITE to Watchlist: View: Get Complete CITE Trend Analysis ➞ | |
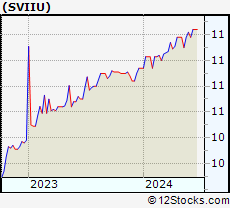 | SVIIU Spring Valley Acquisition Corp. II |
| Sector: Financials | |
| SubSector: SPAC | |
| MarketCap: 324 Millions | |
| Recent Price: 11.18 Smart Investing & Trading Score: 51 | |
| Day Percent Change: 0.00% Day Change: 0.00 | |
| Week Change: -0.36% Year-to-date Change: 2.2% | |
| SVIIU Links: Profile News Message Board | |
| Charts:- Daily , Weekly | |
| Add SVIIU to Watchlist: View: Get Complete SVIIU Trend Analysis ➞ | |
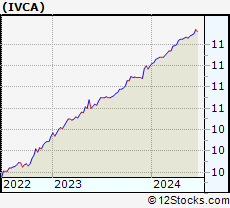 | IVCA Investcorp India Acquisition Corp |
| Sector: Financials | |
| SubSector: SPAC | |
| MarketCap: 345 Millions | |
| Recent Price: 11.29 Smart Investing & Trading Score: 41 | |
| Day Percent Change: 0.00% Day Change: 0.00 | |
| Week Change: 0.09% Year-to-date Change: 2.6% | |
| IVCA Links: Profile News Message Board | |
| Charts:- Daily , Weekly | |
| Add IVCA to Watchlist: View: Get Complete IVCA Trend Analysis ➞ | |
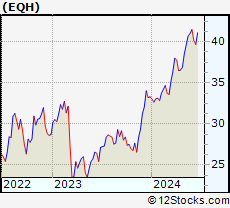 | EQH Equitable Holdings, Inc. |
| Sector: Financials | |
| SubSector: Insurance Brokers | |
| MarketCap: 5520.07 Millions | |
| Recent Price: 41.49 Smart Investing & Trading Score: 100 | |
| Day Percent Change: -0.02% Day Change: -0.01 | |
| Week Change: 1.22% Year-to-date Change: 24.6% | |
| EQH Links: Profile News Message Board | |
| Charts:- Daily , Weekly | |
| Add EQH to Watchlist: View: Get Complete EQH Trend Analysis ➞ | |
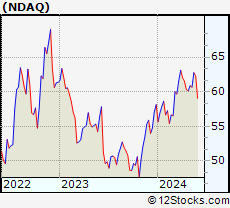 | NDAQ Nasdaq, Inc. |
| Sector: Financials | |
| SubSector: Diversified Investments | |
| MarketCap: 14885.2 Millions | |
| Recent Price: 59.03 Smart Investing & Trading Score: 34 | |
| Day Percent Change: -0.03% Day Change: -0.02 | |
| Week Change: -5.14% Year-to-date Change: 1.5% | |
| NDAQ Links: Profile News Message Board | |
| Charts:- Daily , Weekly | |
| Add NDAQ to Watchlist: View: Get Complete NDAQ Trend Analysis ➞ | |
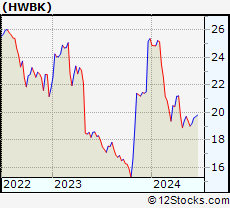 | HWBK Hawthorn Bancshares, Inc. |
| Sector: Financials | |
| SubSector: Regional - Northeast Banks | |
| MarketCap: 129.099 Millions | |
| Recent Price: 19.19 Smart Investing & Trading Score: 35 | |
| Day Percent Change: -0.03% Day Change: 0.00 | |
| Week Change: 0.95% Year-to-date Change: -24.4% | |
| HWBK Links: Profile News Message Board | |
| Charts:- Daily , Weekly | |
| Add HWBK to Watchlist: View: Get Complete HWBK Trend Analysis ➞ | |
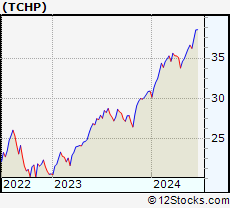 | TCHP T. Rowe Price Blue Chip Growth ETF |
| Sector: Financials | |
| SubSector: Exchange Traded Fund | |
| MarketCap: 60157 Millions | |
| Recent Price: 36.22 Smart Investing & Trading Score: 56 | |
| Day Percent Change: -0.03% Day Change: -0.01 | |
| Week Change: -1.07% Year-to-date Change: 17.2% | |
| TCHP Links: Profile News Message Board | |
| Charts:- Daily , Weekly | |
| Add TCHP to Watchlist: View: Get Complete TCHP Trend Analysis ➞ | |
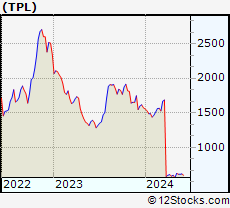 | TPL Texas Pacific Land Trust |
| Sector: Financials | |
| SubSector: Real Estate Development | |
| MarketCap: 3052.29 Millions | |
| Recent Price: 614.31 Smart Investing & Trading Score: 40 | |
| Day Percent Change: -0.04% Day Change: -0.23 | |
| Week Change: 0.5% Year-to-date Change: -60.9% | |
| TPL Links: Profile News Message Board | |
| Charts:- Daily , Weekly | |
| Add TPL to Watchlist: View: Get Complete TPL Trend Analysis ➞ | |
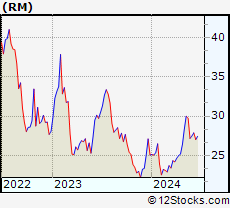 | RM Regional Management Corp. |
| Sector: Financials | |
| SubSector: Credit Services | |
| MarketCap: 148.008 Millions | |
| Recent Price: 27.50 Smart Investing & Trading Score: 61 | |
| Day Percent Change: -0.04% Day Change: -0.01 | |
| Week Change: 1.18% Year-to-date Change: 9.7% | |
| RM Links: Profile News Message Board | |
| Charts:- Daily , Weekly | |
| Add RM to Watchlist: View: Get Complete RM Trend Analysis ➞ | |
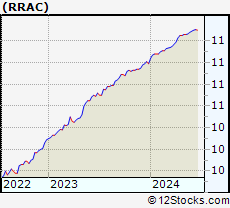 | RRAC Rigel Resource Acquisition Corp. |
| Sector: Financials | |
| SubSector: SPAC | |
| MarketCap: 402 Millions | |
| Recent Price: 11.29 Smart Investing & Trading Score: 41 | |
| Day Percent Change: -0.04% Day Change: -0.01 | |
| Week Change: 0.09% Year-to-date Change: 2.7% | |
| RRAC Links: Profile News Message Board | |
| Charts:- Daily , Weekly | |
| Add RRAC to Watchlist: View: Get Complete RRAC Trend Analysis ➞ | |
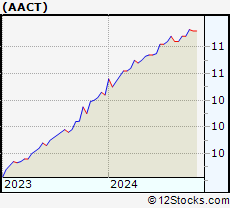 | AACT Ares Acquisition Corporation II |
| Sector: Financials | |
| SubSector: SPAC | |
| MarketCap: 639 Millions | |
| Recent Price: 10.64 Smart Investing & Trading Score: 34 | |
| Day Percent Change: -0.05% Day Change: 0.00 | |
| Week Change: 0% Year-to-date Change: 2.1% | |
| AACT Links: Profile News Message Board | |
| Charts:- Daily , Weekly | |
| Add AACT to Watchlist: View: Get Complete AACT Trend Analysis ➞ | |
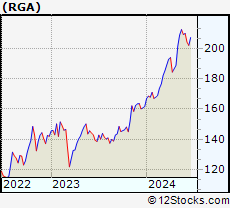 | RGA Reinsurance Group of America, Incorporated |
| Sector: Financials | |
| SubSector: Life Insurance | |
| MarketCap: 4423.36 Millions | |
| Recent Price: 209.80 Smart Investing & Trading Score: 66 | |
| Day Percent Change: -0.09% Day Change: -0.19 | |
| Week Change: 0.27% Year-to-date Change: 29.7% | |
| RGA Links: Profile News Message Board | |
| Charts:- Daily , Weekly | |
| Add RGA to Watchlist: View: Get Complete RGA Trend Analysis ➞ | |
 | ISRL Israel Acquisitions Corp |
| Sector: Financials | |
| SubSector: SPAC | |
| MarketCap: 207 Millions | |
| Recent Price: 10.97 Smart Investing & Trading Score: 7 | |
| Day Percent Change: -0.09% Day Change: -0.01 | |
| Week Change: 0.27% Year-to-date Change: 2.5% | |
| ISRL Links: Profile News Message Board | |
| Charts:- Daily , Weekly | |
| Add ISRL to Watchlist: View: Get Complete ISRL Trend Analysis ➞ | |
| For tabular summary view of above stock list: Summary View ➞ 0 - 25 , 25 - 50 , 50 - 75 , 75 - 100 , 100 - 125 , 125 - 150 , 150 - 175 , 175 - 200 , 200 - 225 , 225 - 250 , 250 - 275 , 275 - 300 , 300 - 325 , 325 - 350 , 350 - 375 , 375 - 400 , 400 - 425 , 425 - 450 , 450 - 475 , 475 - 500 , 500 - 525 , 525 - 550 , 550 - 575 , 575 - 600 , 600 - 625 , 625 - 650 , 650 - 675 , 675 - 700 , 700 - 725 , 725 - 750 , 750 - 775 , 775 - 800 , 800 - 825 , 825 - 850 , 850 - 875 , 875 - 900 , 900 - 925 , 925 - 950 , 950 - 975 , 975 - 1000 , 1000 - 1025 , 1025 - 1050 , 1050 - 1075 , 1075 - 1100 , 1100 - 1125 , 1125 - 1150 , 1150 - 1175 , 1175 - 1200 , 1200 - 1225 | ||
| Click To Change The Sort Order: By Market Cap or Company Size Performance: Year-to-date, Week and Day | |
| Select Chart Type: | ||
|
Best Stocks Today 12Stocks.com |
© 2024 12Stocks.com Terms & Conditions Privacy Contact Us
All Information Provided Only For Education And Not To Be Used For Investing or Trading. See Terms & Conditions


One More Thing ... Get Best Stocks Delivered Daily!
Never Ever Miss A Move With Our Top Ten Stocks Lists
Find Best Stocks In Any Market - Bull or Bear Market
Take A Peek At Our Top Ten Stocks Lists: Daily, Weekly, Year-to-Date & Top Trends
Find Best Stocks In Any Market - Bull or Bear Market
Take A Peek At Our Top Ten Stocks Lists: Daily, Weekly, Year-to-Date & Top Trends
Financial Stocks With Best Up Trends [0-bearish to 100-bullish]: X [100], Brighthouse [100], Central and[100], Northrim BanCorp[100], Bank of America[100], Hagerty [100], Urban Edge[100], Global Blockchain[100], Ventas [100], Omega Healthcare[100], LPL [100]
Best Financial Stocks Year-to-Date:
Root [385.58%], Chimera [138.48%], Banco Macro[130.98%], SelectQuote [127.74%], Gladstone Capital[109.35%], Grupo Financiero[107.65%], Banco BBVA[107.54%], EverQuote [95.18%], Hippo [93.63%], Grupo Supervielle[78.33%], Vista Oil[64.18%] Best Financial Stocks This Week:
C3.ai [23%], Investors Title[19.4%], Banco BBVA[14.74%], Riverview Bancorp[14.25%], Banco Macro[13.7%], IRSA Inversiones[12.15%], Grupo Supervielle[11.73%], Metals Acquisition[10.74%], Grupo Financiero[10.41%], Fathom [10.24%], Vista Oil[9.32%] Best Financial Stocks Daily:
Riverview Bancorp[15.75%], Allied World[14.88%], Medical Properties[7.20%], X [6.14%], Franklin Street[5.32%], Washington Federal[5.16%], Iris Energy[5.13%], Ameris Bancorp[4.80%], Brighthouse [4.79%], Auburn National[4.70%], Central and[4.63%]