
 Login Sign Up


| |||||
 |  | ||||

| 12Stocks.com Market Intelligence |
Best Europe Stocks
|
On this page, you will find the most comprehensive analysis of European stocks and ETFs - from latest trends to performances to charts ➞. First, here are the year-to-date (YTD) performances of the most requested Europe stocks at 12Stocks.com (click stock for review):
| Deutsche Bank 26% | ||
| SAP SE 25% | ||
| ASML Holding 22% | ||
| GlaxoSmithKline 21% | ||
| Koninklijke Philips 20% | ||
| AstraZeneca 14% | ||
| HSBC 10% | ||
| British American 8% | ||
| BP 6% | ||
| Fresenius Medical 5% | ||
| Novartis AG 2% | ||
| UBS -2% | ||
| Diageo -2% | ||
| Transocean -5% | ||
| In a hurry? Europe Stocks Lists: Performance Trends Table, Stock Charts
Sort Europe stocks: Daily, Weekly, Year-to-Date, Market Cap & Trends. Filter Europe stocks list by sector: Show all, Tech, Finance, Energy, Staples, Retail, Industrial, Materials, Utilities and HealthCare Filter Europe stocks list by size:All Europe Large Medium Small and MicroCap |
| 12Stocks.com Europe Stocks Performances & Trends Daily | |||||||||
|
|  The overall Smart Investing & Trading Score is 76 (0-bearish to 100-bullish) which puts Europe index in short term neutral to bullish trend. The Smart Investing & Trading Score from previous trading session is 95 and hence a deterioration of trend.
| ||||||||
Here are the Smart Investing & Trading Scores of the most requested Europe stocks at 12Stocks.com (click stock name for detailed review):
|


| 12Stocks.com: Top Performing Europe Index Stocks | ||||||||||||||||||||||||||||||||||||||||||||||||
 The top performing Europe Index stocks year to date are
Now, more recently, over last week, the top performing Europe Index stocks on the move are


|
||||||||||||||||||||||||||||||||||||||||||||||||
| 12Stocks.com: Investing in Europe Index with Stocks | |
|
The following table helps investors and traders sort through current performance and trends (as measured by Smart Investing & Trading Score) of various
stocks in the Europe Index. Quick View: Move mouse or cursor over stock symbol (ticker) to view short-term technical chart and over stock name to view long term chart. Click on  to add stock symbol to your watchlist and to add stock symbol to your watchlist and  to view watchlist. Click on any ticker or stock name for detailed market intelligence report for that stock. to view watchlist. Click on any ticker or stock name for detailed market intelligence report for that stock. |
12Stocks.com Performance of Stocks in Europe Index
| Ticker | Stock Name | Watchlist | Category | Recent Price | Smart Investing & Trading Score | Change % | YTD Change% |
| IPHA | Innate Pharma |   | Health Care | 2.71 | 100 | 5.28% | -3.22% |
| ONON | On Holding | | Services & Goods | 38.12 | 100 | 4.04% | 39.74% |
| IVA | Inventiva S.A | | Health Care | 3.79 | 100 | 3.89% | -15.87% |
| SGHC | Super | | Services & Goods | 3.60 | 100 | 2.86% | 12.68% |
| RIO | Rio Tinto | | Materials | 73.61 | 100 | 2.36% | -1.14% |
| ING | ING Groep | | Financials | 17.98 | 100 | 2.16% | 19.71% |
| AFRI | Forafric Global | | Consumer Staples | 11.17 | 100 | 1.45% | 5.48% |
| VALN | Valneva SE | | Health Care | 8.88 | 100 | 0.74% | -14.37% |
| MANU | Manchester United | | Services & Goods | 16.84 | 100 | 0.48% | -17.37% |
| SRAD | Sportradar | | Technology | 10.65 | 100 | 0.47% | -4.48% |
| VOD | Vodafone | | Technology | 9.79 | 100 | 0.00% | 12.53% |
| LYG | Lloyds Banking | | Financials | 2.82 | 95 | 2.92% | 17.99% |
| NVGS | Navigator | | Transports | 16.69 | 95 | 2.90% | 14.71% |
| JMIA | Jumia | | Services & Goods | 6.77 | 95 | 1.65% | 91.78% |
| BCS | Barclays | | Financials | 11.12 | 95 | 1.65% | 41.12% |
| AEG | Aegon N.V | | Financials | 6.88 | 95 | 0.88% | 19.44% |
| ERIC | Telefonaktiebolaget LM | | Technology | 5.74 | 95 | 0.88% | -8.89% |
| CVAC | CureVac N.V | | Health Care | 3.49 | 95 | 0.29% | -17.20% |
| ACP | Aberdeen ome | | Financials | 6.94 | 95 | 0.29% | 2.06% |
| PHG | Koninklijke Philips | | Technology | 27.98 | 90 | 1.89% | 19.93% |
| UL | Unilever | | Consumer Staples | 54.75 | 90 | 1.26% | 12.93% |
| SAP | SAP SE | | Technology | 192.80 | 90 | 1.12% | 24.72% |
| LOGI | Logitech | | Technology | 89.96 | 90 | 0.82% | -5.37% |
| GF | New Germany | | Financials | 8.86 | 90 | 0.80% | 1.37% |
| AEF | Aberdeen Emerging | | Financials | 5.36 | 90 | 0.56% | 4.79% |
| For chart view version of above stock list: Chart View ➞ 0 - 25 , 25 - 50 , 50 - 75 , 75 - 100 , 100 - 125 , 125 - 150 | ||
 | Click To Change The Sort Order: By Market Cap or Company Size Performance: Year-to-date, Week and Day |  |
|
Get the most comprehensive stock market coverage daily at 12Stocks.com ➞ Best Stocks Today ➞ Best Stocks Weekly ➞ Best Stocks Year-to-Date ➞ Best Stocks Trends ➞  Best Stocks Today 12Stocks.com Best Nasdaq Stocks ➞ Best S&P 500 Stocks ➞ Best Tech Stocks ➞ Best Biotech Stocks ➞ |
| Detailed Overview of Europe Stocks |
| Europe Technical Overview, Leaders & Laggards, Top Europe ETF Funds & Detailed Europe Stocks List, Charts, Trends & More |
| Europe: Technical Analysis, Trends & YTD Performance | |
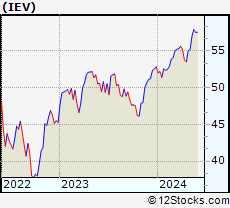
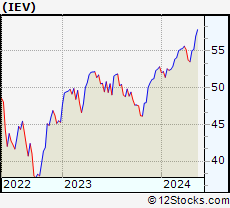
 IEV Weekly Chart |
|
| Long Term Trend: Very Good | |
| Medium Term Trend: Very Good | |
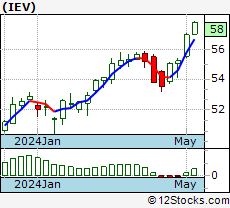
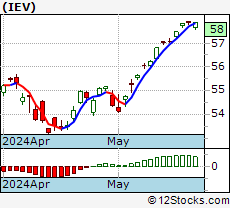 IEV Daily Chart |
|
| Short Term Trend: Good | |
| Overall Trend Score: 76 | |
| YTD Performance: 9.57% | |
| **Trend Scores & Views Are Only For Educational Purposes And Not For Investing | |
| 12Stocks.com: Investing in Europe Index using Exchange Traded Funds | |
|
The following table shows list of key exchange traded funds (ETF) that
help investors play Europe stock market. For detailed view, check out our ETF Funds section of our website. Quick View: Move mouse or cursor over ETF symbol (ticker) to view short-term technical chart and over ETF name to view long term chart. Click on ticker or stock name for detailed view. Click on to add stock symbol to your watchlist and to view watchlist. |
12Stocks.com List of ETFs that track Europe Index
| Ticker | ETF Name | Watchlist | Recent Price | Smart Investing & Trading Score | Change % | Week % | Year-to-date % |
| IEV | Europe | | 57.92 | 76 | 0.03 | 1.56 | 9.57% |
| VGK | Europe | | 70.09 | 83 | 0.00 | 1.68 | 8.7% |
| EURL | Europe Bull 3X | | 28.58 | 83 | -1.45 | 2.66 | 20.54% |
| EPV | Short Europe | | 7.25 | 17 | -0.62 | -3.15 | -15.66% |
| IEUS | Europe Small-Cap | | 59.60 | 88 | 0.32 | 3.03 | 6.05% |
| HEDJ | Europe Hedged Equity | | 48.09 | 58 | -0.19 | 0.38 | 12.23% |
| EUSC | Europe Hedged SmallCap | | 40.54 | 76 | -0.01 | 1.25 | 12.6% |
| EUFN | Europe Financials | | 24.13 | 95 | 0.67 | 2.51 | 15.12% |
| EWU | United Kingdom | | 36.74 | 83 | 0.26 | 1.63 | 11.16% |
| EWQ | France | | 42.25 | 76 | 0.09 | 0.6 | 7.84% |
| EWG | Germany | | 32.42 | 76 | 0.22 | 0.75 | 9.2% |
| EWL | Switzerland | | 48.97 | 95 | 0.31 | 2.15 | 1.45% |
| EWN | Netherlands | | 51.72 | 83 | -0.10 | 2.11 | 15.89% |
| EWI | Italy | | 39.34 | 95 | 0.08 | 3.01 | 15.94% |
| FEP | Europe AlphaDEX | | 39.49 | 88 | -0.15 | 2.09 | 8.73% |
| FDD | European Sel Div | | 12.73 | 90 | 0.35 | 2.41 | 5.46% |
| FXE | Euro | | 100.43 | 68 | 0.07 | 0.97 | -1.58% |
| 12Stocks.com: Charts, Trends, Fundamental Data and Performances of Europe Stocks | |
|
We now take in-depth look at all Europe stocks including charts, multi-period performances and overall trends (as measured by Smart Investing & Trading Score). One can sort Europe stocks (click link to choose) by Daily, Weekly and by Year-to-Date performances. Also, one can sort by size of the company or by market capitalization. |
| Select Your Default Chart Type: | |||||
| |||||
| Click on stock symbol or name for detailed view. Click on to add stock symbol to your watchlist and to view watchlist. Quick View: Move mouse or cursor over "Daily" to quickly view daily technical stock chart and over "Weekly" to view weekly technical stock chart. | |||||
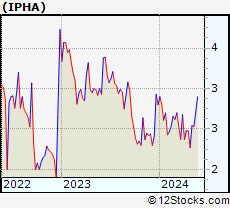 | IPHA Innate Pharma S.A. |
| Sector: Health Care | |
| SubSector: Biotechnology | |
| MarketCap: 309.485 Millions | |
| Recent Price: 2.71 Smart Investing & Trading Score: 100 | |
| Day Percent Change: 5.28% Day Change: 0.14 | |
| Week Change: 7.11% Year-to-date Change: -3.2% | |
| IPHA Links: Profile News Message Board | |
| Charts:- Daily , Weekly | |
| Add IPHA to Watchlist: View: Get Complete IPHA Trend Analysis ➞ | |
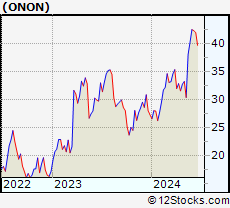 | ONON On Holding AG |
| Sector: Services & Goods | |
| SubSector: Footwear & Accessories | |
| MarketCap: 10600 Millions | |
| Recent Price: 38.12 Smart Investing & Trading Score: 100 | |
| Day Percent Change: 4.04% Day Change: 1.48 | |
| Week Change: 25.39% Year-to-date Change: 39.7% | |
| ONON Links: Profile News Message Board | |
| Charts:- Daily , Weekly | |
| Add ONON to Watchlist: View: Get Complete ONON Trend Analysis ➞ | |
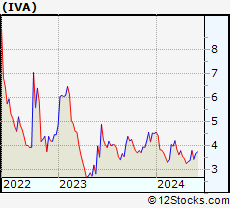 | IVA Inventiva S.A. |
| Sector: Health Care | |
| SubSector: Biotechnology | |
| MarketCap: 46487 Millions | |
| Recent Price: 3.79 Smart Investing & Trading Score: 100 | |
| Day Percent Change: 3.89% Day Change: 0.14 | |
| Week Change: 12.25% Year-to-date Change: -15.9% | |
| IVA Links: Profile News Message Board | |
| Charts:- Daily , Weekly | |
| Add IVA to Watchlist: View: Get Complete IVA Trend Analysis ➞ | |
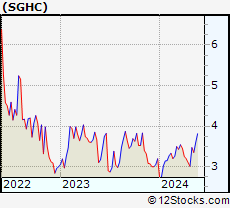 | SGHC Super Group (SGHC) Limited |
| Sector: Services & Goods | |
| SubSector: Gambling | |
| MarketCap: 1390 Millions | |
| Recent Price: 3.60 Smart Investing & Trading Score: 100 | |
| Day Percent Change: 2.86% Day Change: 0.10 | |
| Week Change: 7.46% Year-to-date Change: 12.7% | |
| SGHC Links: Profile News Message Board | |
| Charts:- Daily , Weekly | |
| Add SGHC to Watchlist: View: Get Complete SGHC Trend Analysis ➞ | |
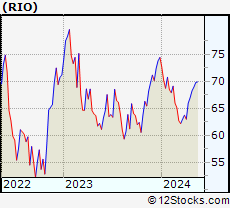 | RIO Rio Tinto Group |
| Sector: Materials | |
| SubSector: Industrial Metals & Minerals | |
| MarketCap: 69399.7 Millions | |
| Recent Price: 73.61 Smart Investing & Trading Score: 100 | |
| Day Percent Change: 2.36% Day Change: 1.70 | |
| Week Change: 5.46% Year-to-date Change: -1.1% | |
| RIO Links: Profile News Message Board | |
| Charts:- Daily , Weekly | |
| Add RIO to Watchlist: View: Get Complete RIO Trend Analysis ➞ | |
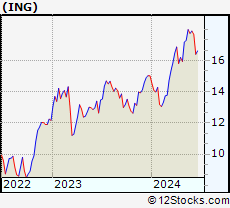 | ING ING Groep N.V. |
| Sector: Financials | |
| SubSector: Life Insurance | |
| MarketCap: 24280.9 Millions | |
| Recent Price: 17.98 Smart Investing & Trading Score: 100 | |
| Day Percent Change: 2.16% Day Change: 0.38 | |
| Week Change: 3.99% Year-to-date Change: 19.7% | |
| ING Links: Profile News Message Board | |
| Charts:- Daily , Weekly | |
| Add ING to Watchlist: View: Get Complete ING Trend Analysis ➞ | |
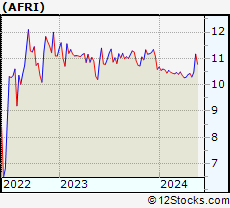 | AFRI Forafric Global PLC |
| Sector: Consumer Staples | |
| SubSector: Farm Products | |
| MarketCap: 295 Millions | |
| Recent Price: 11.17 Smart Investing & Trading Score: 100 | |
| Day Percent Change: 1.45% Day Change: 0.16 | |
| Week Change: 6.58% Year-to-date Change: 5.5% | |
| AFRI Links: Profile News Message Board | |
| Charts:- Daily , Weekly | |
| Add AFRI to Watchlist: View: Get Complete AFRI Trend Analysis ➞ | |
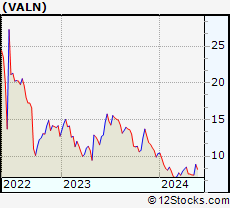 | VALN Valneva SE |
| Sector: Health Care | |
| SubSector: Biotechnology | |
| MarketCap: 1010 Millions | |
| Recent Price: 8.88 Smart Investing & Trading Score: 100 | |
| Day Percent Change: 0.74% Day Change: 0.07 | |
| Week Change: 19.68% Year-to-date Change: -14.4% | |
| VALN Links: Profile News Message Board | |
| Charts:- Daily , Weekly | |
| Add VALN to Watchlist: View: Get Complete VALN Trend Analysis ➞ | |
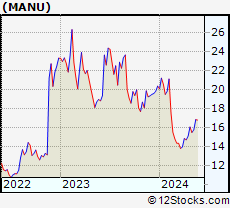 | MANU Manchester United plc |
| Sector: Services & Goods | |
| SubSector: Sporting Activities | |
| MarketCap: 2537.74 Millions | |
| Recent Price: 16.84 Smart Investing & Trading Score: 100 | |
| Day Percent Change: 0.48% Day Change: 0.08 | |
| Week Change: 6.79% Year-to-date Change: -17.4% | |
| MANU Links: Profile News Message Board | |
| Charts:- Daily , Weekly | |
| Add MANU to Watchlist: View: Get Complete MANU Trend Analysis ➞ | |
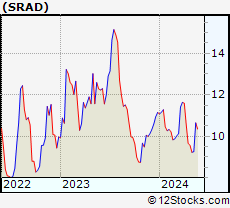 | SRAD Sportradar Group AG |
| Sector: Technology | |
| SubSector: Software - Application | |
| MarketCap: 3900 Millions | |
| Recent Price: 10.65 Smart Investing & Trading Score: 100 | |
| Day Percent Change: 0.47% Day Change: 0.05 | |
| Week Change: 15.01% Year-to-date Change: -4.5% | |
| SRAD Links: Profile News Message Board | |
| Charts:- Daily , Weekly | |
| Add SRAD to Watchlist: View: Get Complete SRAD Trend Analysis ➞ | |
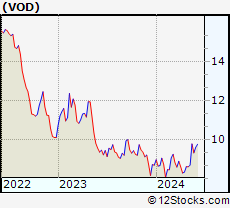 | VOD Vodafone Group Plc |
| Sector: Technology | |
| SubSector: Wireless Communications | |
| MarketCap: 38154.7 Millions | |
| Recent Price: 9.79 Smart Investing & Trading Score: 100 | |
| Day Percent Change: 0.00% Day Change: 0.00 | |
| Week Change: 12.53% Year-to-date Change: 12.5% | |
| VOD Links: Profile News Message Board | |
| Charts:- Daily , Weekly | |
| Add VOD to Watchlist: View: Get Complete VOD Trend Analysis ➞ | |
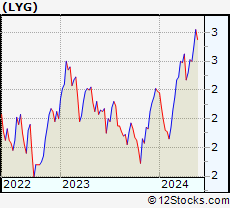 | LYG Lloyds Banking Group plc |
| Sector: Financials | |
| SubSector: Foreign Money Center Banks | |
| MarketCap: 28885.4 Millions | |
| Recent Price: 2.82 Smart Investing & Trading Score: 95 | |
| Day Percent Change: 2.92% Day Change: 0.08 | |
| Week Change: 4.44% Year-to-date Change: 18.0% | |
| LYG Links: Profile News Message Board | |
| Charts:- Daily , Weekly | |
| Add LYG to Watchlist: View: Get Complete LYG Trend Analysis ➞ | |
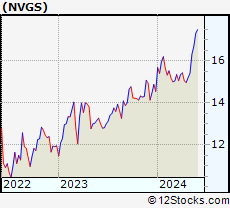 | NVGS Navigator Holdings Ltd. |
| Sector: Transports | |
| SubSector: Shipping | |
| MarketCap: 280.914 Millions | |
| Recent Price: 16.69 Smart Investing & Trading Score: 95 | |
| Day Percent Change: 2.90% Day Change: 0.47 | |
| Week Change: 2.27% Year-to-date Change: 14.7% | |
| NVGS Links: Profile News Message Board | |
| Charts:- Daily , Weekly | |
| Add NVGS to Watchlist: View: Get Complete NVGS Trend Analysis ➞ | |
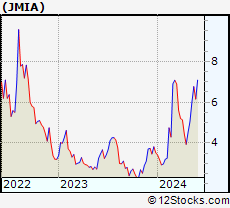 | JMIA Jumia Technologies AG |
| Sector: Services & Goods | |
| SubSector: Specialty Retail, Other | |
| MarketCap: 203.644 Millions | |
| Recent Price: 6.77 Smart Investing & Trading Score: 95 | |
| Day Percent Change: 1.65% Day Change: 0.11 | |
| Week Change: 12.65% Year-to-date Change: 91.8% | |
| JMIA Links: Profile News Message Board | |
| Charts:- Daily , Weekly | |
| Add JMIA to Watchlist: View: Get Complete JMIA Trend Analysis ➞ | |
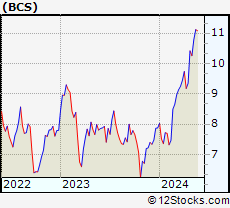 | BCS Barclays PLC |
| Sector: Financials | |
| SubSector: Foreign Money Center Banks | |
| MarketCap: 21013.4 Millions | |
| Recent Price: 11.12 Smart Investing & Trading Score: 95 | |
| Day Percent Change: 1.65% Day Change: 0.18 | |
| Week Change: 3.06% Year-to-date Change: 41.1% | |
| BCS Links: Profile News Message Board | |
| Charts:- Daily , Weekly | |
| Add BCS to Watchlist: View: Get Complete BCS Trend Analysis ➞ | |
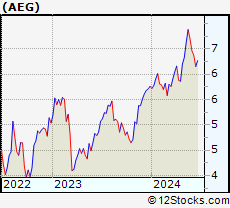 | AEG Aegon N.V. |
| Sector: Financials | |
| SubSector: Life Insurance | |
| MarketCap: 6154.26 Millions | |
| Recent Price: 6.88 Smart Investing & Trading Score: 95 | |
| Day Percent Change: 0.88% Day Change: 0.06 | |
| Week Change: 3.93% Year-to-date Change: 19.4% | |
| AEG Links: Profile News Message Board | |
| Charts:- Daily , Weekly | |
| Add AEG to Watchlist: View: Get Complete AEG Trend Analysis ➞ | |
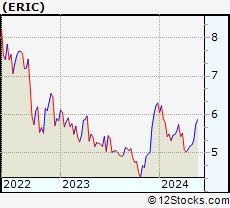 | ERIC Telefonaktiebolaget LM Ericsson (publ) |
| Sector: Technology | |
| SubSector: Communication Equipment | |
| MarketCap: 27041.1 Millions | |
| Recent Price: 5.74 Smart Investing & Trading Score: 95 | |
| Day Percent Change: 0.88% Day Change: 0.05 | |
| Week Change: 7.49% Year-to-date Change: -8.9% | |
| ERIC Links: Profile News Message Board | |
| Charts:- Daily , Weekly | |
| Add ERIC to Watchlist: View: Get Complete ERIC Trend Analysis ➞ | |
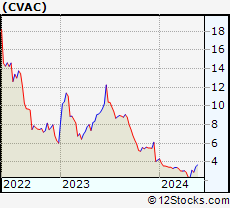 | CVAC CureVac N.V. |
| Sector: Health Care | |
| SubSector: Biotechnology | |
| MarketCap: 22957 Millions | |
| Recent Price: 3.49 Smart Investing & Trading Score: 95 | |
| Day Percent Change: 0.29% Day Change: 0.01 | |
| Week Change: 19.93% Year-to-date Change: -17.2% | |
| CVAC Links: Profile News Message Board | |
| Charts:- Daily , Weekly | |
| Add CVAC to Watchlist: View: Get Complete CVAC Trend Analysis ➞ | |
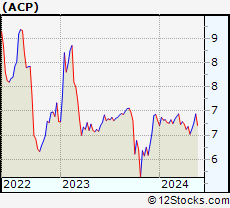 | ACP Aberdeen Income Credit Strategies Fund |
| Sector: Financials | |
| SubSector: Closed-End Fund - Debt | |
| MarketCap: 119.207 Millions | |
| Recent Price: 6.94 Smart Investing & Trading Score: 95 | |
| Day Percent Change: 0.29% Day Change: 0.02 | |
| Week Change: 2.81% Year-to-date Change: 2.1% | |
| ACP Links: Profile News Message Board | |
| Charts:- Daily , Weekly | |
| Add ACP to Watchlist: View: Get Complete ACP Trend Analysis ➞ | |
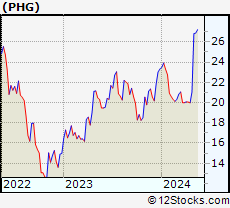 | PHG Koninklijke Philips N.V. |
| Sector: Technology | |
| SubSector: Electronic Equipment | |
| MarketCap: 32405.2 Millions | |
| Recent Price: 27.98 Smart Investing & Trading Score: 90 | |
| Day Percent Change: 1.89% Day Change: 0.52 | |
| Week Change: 4.09% Year-to-date Change: 19.9% | |
| PHG Links: Profile News Message Board | |
| Charts:- Daily , Weekly | |
| Add PHG to Watchlist: View: Get Complete PHG Trend Analysis ➞ | |
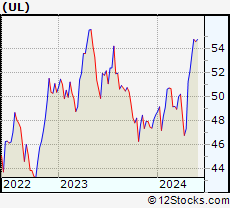 | UL The Unilever Group |
| Sector: Consumer Staples | |
| SubSector: Personal Products | |
| MarketCap: 132687 Millions | |
| Recent Price: 54.75 Smart Investing & Trading Score: 90 | |
| Day Percent Change: 1.26% Day Change: 0.68 | |
| Week Change: 2.32% Year-to-date Change: 12.9% | |
| UL Links: Profile News Message Board | |
| Charts:- Daily , Weekly | |
| Add UL to Watchlist: View: Get Complete UL Trend Analysis ➞ | |
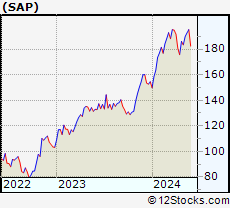 | SAP SAP SE |
| Sector: Technology | |
| SubSector: Application Software | |
| MarketCap: 129635 Millions | |
| Recent Price: 192.80 Smart Investing & Trading Score: 90 | |
| Day Percent Change: 1.12% Day Change: 2.13 | |
| Week Change: 1.45% Year-to-date Change: 24.7% | |
| SAP Links: Profile News Message Board | |
| Charts:- Daily , Weekly | |
| Add SAP to Watchlist: View: Get Complete SAP Trend Analysis ➞ | |
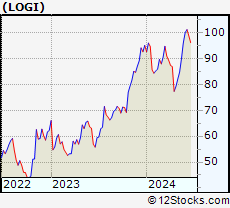 | LOGI Logitech International S.A. |
| Sector: Technology | |
| SubSector: Computer Peripherals | |
| MarketCap: 7998.19 Millions | |
| Recent Price: 89.96 Smart Investing & Trading Score: 90 | |
| Day Percent Change: 0.82% Day Change: 0.73 | |
| Week Change: 6.13% Year-to-date Change: -5.4% | |
| LOGI Links: Profile News Message Board | |
| Charts:- Daily , Weekly | |
| Add LOGI to Watchlist: View: Get Complete LOGI Trend Analysis ➞ | |
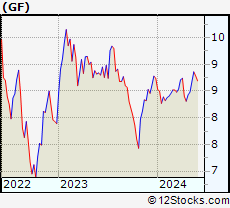 | GF The New Germany Fund, Inc. |
| Sector: Financials | |
| SubSector: Closed-End Fund - Foreign | |
| MarketCap: 152.547 Millions | |
| Recent Price: 8.86 Smart Investing & Trading Score: 90 | |
| Day Percent Change: 0.80% Day Change: 0.07 | |
| Week Change: 2.07% Year-to-date Change: 1.4% | |
| GF Links: Profile News Message Board | |
| Charts:- Daily , Weekly | |
| Add GF to Watchlist: View: Get Complete GF Trend Analysis ➞ | |
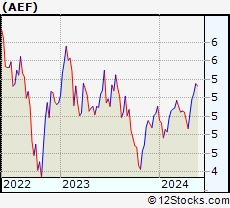 | AEF Aberdeen Emerging Markets Equity Income Fund, Inc. |
| Sector: Financials | |
| SubSector: Asset Management | |
| MarketCap: 245.803 Millions | |
| Recent Price: 5.36 Smart Investing & Trading Score: 90 | |
| Day Percent Change: 0.56% Day Change: 0.03 | |
| Week Change: 2% Year-to-date Change: 4.8% | |
| AEF Links: Profile News Message Board | |
| Charts:- Daily , Weekly | |
| Add AEF to Watchlist: View: Get Complete AEF Trend Analysis ➞ | |
| For tabular summary view of above stock list: Summary View ➞ 0 - 25 , 25 - 50 , 50 - 75 , 75 - 100 , 100 - 125 , 125 - 150 | ||
| Click To Change The Sort Order: By Market Cap or Company Size Performance: Year-to-date, Week and Day | |
| Select Chart Type: | ||
|
Best Stocks Today 12Stocks.com |
© 2024 12Stocks.com Terms & Conditions Privacy Contact Us
All Information Provided Only For Education And Not To Be Used For Investing or Trading. See Terms & Conditions


One More Thing ... Get Best Stocks Delivered Daily!
Never Ever Miss A Move With Our Top Ten Stocks Lists
Find Best Stocks In Any Market - Bull or Bear Market
Take A Peek At Our Top Ten Stocks Lists: Daily, Weekly, Year-to-Date & Top Trends
Find Best Stocks In Any Market - Bull or Bear Market
Take A Peek At Our Top Ten Stocks Lists: Daily, Weekly, Year-to-Date & Top Trends
Europe Stocks With Best Up Trends [0-bearish to 100-bullish]: Innate Pharma[100], On Holding[100], Inventiva S.A[100], Super [100], Rio Tinto[100], ING Groep[100], Forafric Global[100], Valneva SE[100], Manchester United[100], Sportradar [100], Vodafone [100]
Best Europe Stocks Year-to-Date:
NuCana [1106.9%], Affimed N.V[738.4%], ADC [146.99%], MorphoSys AG[91.92%], Jumia [91.78%], NewAmsterdam Pharma[78.74%], Summit [70.11%], Spotify [61.15%], Merus N.V[59.67%], MYT Netherlands[55.28%], Addex [44.33%] Best Europe Stocks This Week:
AC Immune[37.66%], On Holding[25.39%], CureVac N.V[19.93%], Paysafe [19.7%], Valneva SE[19.68%], Sportradar [15.01%], Lilium N.V[12.96%], Exscientia [12.8%], Jumia [12.65%], Vodafone [12.53%], Inventiva S.A[12.25%] Best Europe Stocks Daily:
Arqit Quantum[10.89%], Autolus [7.86%], Mynaric AG[5.88%], Innate Pharma[5.28%], On Holding[4.04%], Inventiva S.A[3.89%], Liberty Global[3.61%], Liberty Global[2.94%], Lloyds Banking[2.92%], Navigator [2.90%], Super [2.86%]