
 Login Sign Up


| |||||
 |  | ||||

| 12Stocks.com Market Intelligence |
Best Europe Stocks
|
On this page, you will find the most comprehensive analysis of European stocks and ETFs - from latest trends to performances to charts ➞. First, here are the year-to-date (YTD) performances of the most requested Europe stocks at 12Stocks.com (click stock for review):
| ASML Holding 27% | ||
| Deutsche Bank 23% | ||
| GlaxoSmithKline 21% | ||
| SAP SE 18% | ||
| Koninklijke Philips 16% | ||
| AstraZeneca 16% | ||
| HSBC 10% | ||
| BP 6% | ||
| British American 6% | ||
| UBS 3% | ||
| Novartis AG 2% | ||
| Fresenius Medical 2% | ||
| Transocean -2% | ||
| Diageo -7% | ||
| In a hurry? Europe Stocks Lists: Performance Trends Table, Stock Charts
Sort Europe stocks: Daily, Weekly, Year-to-Date, Market Cap & Trends. Filter Europe stocks list by sector: Show all, Tech, Finance, Energy, Staples, Retail, Industrial, Materials, Utilities and HealthCare Filter Europe stocks list by size:All Europe Large Medium Small and MicroCap |
| 12Stocks.com Europe Stocks Performances & Trends Daily | |||||||||
|
|  The overall Smart Investing & Trading Score is 86 (0-bearish to 100-bullish) which puts Europe index in short term bullish trend. The Smart Investing & Trading Score from previous trading session is 58 and hence an improvement of trend.
| ||||||||
Here are the Smart Investing & Trading Scores of the most requested Europe stocks at 12Stocks.com (click stock name for detailed review):
|


| 12Stocks.com: Top Performing Europe Index Stocks | ||||||||||||||||||||||||||||||||||||||||||||||||
 The top performing Europe Index stocks year to date are
Now, more recently, over last week, the top performing Europe Index stocks on the move are


|
||||||||||||||||||||||||||||||||||||||||||||||||
| 12Stocks.com: Investing in Europe Index with Stocks | |
|
The following table helps investors and traders sort through current performance and trends (as measured by Smart Investing & Trading Score) of various
stocks in the Europe Index. Quick View: Move mouse or cursor over stock symbol (ticker) to view short-term technical chart and over stock name to view long term chart. Click on  to add stock symbol to your watchlist and to add stock symbol to your watchlist and  to view watchlist. Click on any ticker or stock name for detailed market intelligence report for that stock. to view watchlist. Click on any ticker or stock name for detailed market intelligence report for that stock. |
12Stocks.com Performance of Stocks in Europe Index
| Ticker | Stock Name | Watchlist | Category | Recent Price | Smart Investing & Trading Score | Change % | YTD Change% |
| EXAI | Exscientia |   | Health Care | 5.30 | 69 | 7.29% | -18.08% |
| ST | Sensata | | Technology | 41.32 | 68 | 2.02% | 9.98% |
| FMS | Fresenius Medical | | Health Care | 21.27 | 68 | 0.95% | 2.11% |
| NXPI | NXP Semiconductors | | Technology | 272.10 | 68 | 0.25% | 18.47% |
| MRUS | Merus N.V | | Health Care | 53.24 | 68 | -7.09% | 93.60% |
| PSFE | Paysafe | | Technology | 18.18 | 68 | -1.41% | 40.93% |
| QURE | uniQure N.V | | Health Care | 4.93 | 67 | 5.34% | -27.18% |
| SNN | Smith & Nephew | | Health Care | 25.33 | 67 | 1.24% | -7.15% |
| SRAD | Sportradar | | Technology | 10.19 | 64 | 1.49% | -8.61% |
| JHG | Janus Henderson | | Financials | 33.50 | 64 | 1.03% | 11.11% |
| AY | Atlantica Yield | | Utilities | 21.98 | 64 | -1.83% | 2.23% |
| GRMN | Garmin | | Technology | 163.85 | 61 | 0.66% | 27.47% |
| LIVN | LivaNova | | Health Care | 61.07 | 61 | 0.39% | 18.03% |
| WPP | WPP | | Services & Goods | 52.34 | 61 | 0.08% | 10.03% |
| SGHC | Super | | Services & Goods | 3.63 | 61 | -1.63% | 13.62% |
| IPHA | Innate Pharma | | Health Care | 2.74 | 61 | -0.36% | -2.14% |
| BP | BP | | Energy | 37.57 | 61 | 1.73% | 6.13% |
| MOR | MorphoSys AG | | Health Care | 18.39 | 61 | 0.16% | 85.76% |
| OLK | Olink Holding | | Health Care | 23.95 | 59 | -0.25% | -4.88% |
| AEG | Aegon N.V | | Financials | 6.46 | 58 | 0.78% | 12.15% |
| RIO | Rio Tinto | | Materials | 70.10 | 58 | 0.52% | -5.86% |
| IHG | InterContinental Hotels | | Services & Goods | 101.55 | 57 | 2.37% | 11.37% |
| LIN | Linde | | Materials | 435.52 | 57 | 1.26% | 6.04% |
| NVT | nVent Electric | | Technology | 81.38 | 56 | -1.58% | 37.72% |
| PHG | Koninklijke Philips | | Technology | 27.14 | 56 | -0.80% | 16.33% |
| For chart view version of above stock list: Chart View ➞ 0 - 25 , 25 - 50 , 50 - 75 , 75 - 100 , 100 - 125 , 125 - 150 | ||
 | Click To Change The Sort Order: By Market Cap or Company Size Performance: Year-to-date, Week and Day |  |
|
Get the most comprehensive stock market coverage daily at 12Stocks.com ➞ Best Stocks Today ➞ Best Stocks Weekly ➞ Best Stocks Year-to-Date ➞ Best Stocks Trends ➞  Best Stocks Today 12Stocks.com Best Nasdaq Stocks ➞ Best S&P 500 Stocks ➞ Best Tech Stocks ➞ Best Biotech Stocks ➞ |
| Detailed Overview of Europe Stocks |
| Europe Technical Overview, Leaders & Laggards, Top Europe ETF Funds & Detailed Europe Stocks List, Charts, Trends & More |
| Europe: Technical Analysis, Trends & YTD Performance | |
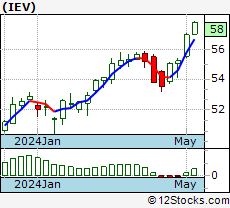 IEV Weekly Chart |
|
| Long Term Trend: Very Good | |
| Medium Term Trend: Very Good | |
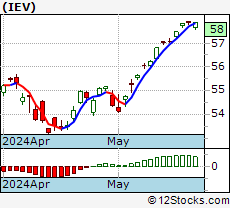 IEV Daily Chart |
|
| Short Term Trend: Very Good | |
| Overall Trend Score: 86 | |
| YTD Performance: 8.93% | |
| **Trend Scores & Views Are Only For Educational Purposes And Not For Investing | |
| 12Stocks.com: Investing in Europe Index using Exchange Traded Funds | |
|
The following table shows list of key exchange traded funds (ETF) that
help investors play Europe stock market. For detailed view, check out our ETF Funds section of our website. Quick View: Move mouse or cursor over ETF symbol (ticker) to view short-term technical chart and over ETF name to view long term chart. Click on ticker or stock name for detailed view. Click on to add stock symbol to your watchlist and to view watchlist. |
12Stocks.com List of ETFs that track Europe Index
| Ticker | ETF Name | Watchlist | Recent Price | Smart Investing & Trading Score | Change % | Week % | Year-to-date % |
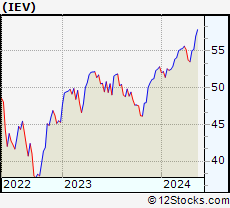
| IEV | Europe | | 57.58 | 86 | 0.86 | 0.07 | 8.93% |
| VGK | Europe | | 69.85 | 86 | 0.92 | 0.19 | 8.33% |
| EURL | Europe Bull 3X | | 27.94 | 86 | 1.09 | -1.2 | 17.84% |
| EPV | Short Europe | | 7.31 | 7 | -1.75 | -0.41 | -14.9% |
| IEUS | Europe Small-Cap | | 59.96 | 93 | 0.99 | 0.52 | 6.69% |
| HEDJ | Europe Hedged Equity | | 47.57 | 69 | 0.34 | -0.44 | 11.02% |
| EUSC | Europe Hedged SmallCap | | 40.40 | 59 | -0.07 | -0.36 | 12.21% |
| EUFN | Europe Financials | | 24.18 | 100 | 1.02 | 0.71 | 15.36% |
| EWU | United Kingdom | | 36.32 | 76 | 1.06 | -0.06 | 9.89% |
| EWQ | France | | 41.70 | 76 | 0.72 | -0.64 | 6.43% |
| EWG | Germany | | 32.06 | 76 | 0.88 | -0.68 | 7.98% |
| EWL | Switzerland | | 49.16 | 100 | 1.19 | 1.74 | 1.84% |
| EWN | Netherlands | | 51.19 | 61 | -0.02 | -1.02 | 14.7% |
| EWI | Italy | | 38.83 | 68 | 0.73 | 0.49 | 14.44% |
| FEP | Europe AlphaDEX | | 39.49 | 75 | 0.51 | 0.03 | 8.73% |
| FDD | European Sel Div | | 12.62 | 73 | 0.28 | 0.08 | 4.55% |
| FXE | Euro | | 100.29 | 68 | 0.20 | 0.03 | -1.72% |
| 12Stocks.com: Charts, Trends, Fundamental Data and Performances of Europe Stocks | |
|
We now take in-depth look at all Europe stocks including charts, multi-period performances and overall trends (as measured by Smart Investing & Trading Score). One can sort Europe stocks (click link to choose) by Daily, Weekly and by Year-to-Date performances. Also, one can sort by size of the company or by market capitalization. |
| Select Your Default Chart Type: | |||||
| |||||
| Click on stock symbol or name for detailed view. Click on to add stock symbol to your watchlist and to view watchlist. Quick View: Move mouse or cursor over "Daily" to quickly view daily technical stock chart and over "Weekly" to view weekly technical stock chart. | |||||
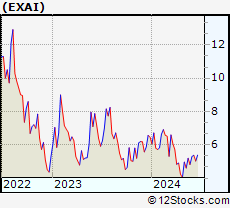 | EXAI Exscientia plc |
| Sector: Health Care | |
| SubSector: Biotechnology | |
| MarketCap: 796 Millions | |
| Recent Price: 5.30 Smart Investing & Trading Score: 69 | |
| Day Percent Change: 7.29% Day Change: 0.36 | |
| Week Change: 9.96% Year-to-date Change: -18.1% | |
| EXAI Links: Profile News Message Board | |
| Charts:- Daily , Weekly | |
| Add EXAI to Watchlist: View: Get Complete EXAI Trend Analysis ➞ | |
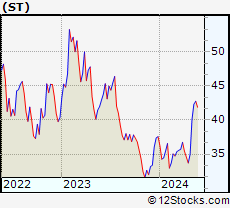 | ST Sensata Technologies Holding plc |
| Sector: Technology | |
| SubSector: Scientific & Technical Instruments | |
| MarketCap: 4434.23 Millions | |
| Recent Price: 41.32 Smart Investing & Trading Score: 68 | |
| Day Percent Change: 2.02% Day Change: 0.82 | |
| Week Change: -1.27% Year-to-date Change: 10.0% | |
| ST Links: Profile News Message Board | |
| Charts:- Daily , Weekly | |
| Add ST to Watchlist: View: Get Complete ST Trend Analysis ➞ | |
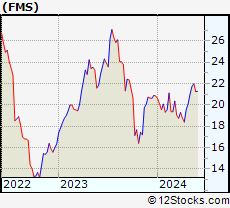 | FMS Fresenius Medical Care AG & Co. KGaA |
| Sector: Health Care | |
| SubSector: Specialized Health Services | |
| MarketCap: 17551.6 Millions | |
| Recent Price: 21.27 Smart Investing & Trading Score: 68 | |
| Day Percent Change: 0.95% Day Change: 0.20 | |
| Week Change: 0.09% Year-to-date Change: 2.1% | |
| FMS Links: Profile News Message Board | |
| Charts:- Daily , Weekly | |
| Add FMS to Watchlist: View: Get Complete FMS Trend Analysis ➞ | |
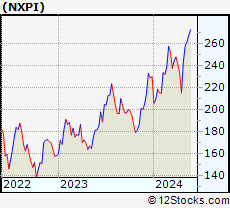 | NXPI NXP Semiconductors N.V. |
| Sector: Technology | |
| SubSector: Semiconductor - Broad Line | |
| MarketCap: 22497.9 Millions | |
| Recent Price: 272.10 Smart Investing & Trading Score: 68 | |
| Day Percent Change: 0.25% Day Change: 0.67 | |
| Week Change: -1.83% Year-to-date Change: 18.5% | |
| NXPI Links: Profile News Message Board | |
| Charts:- Daily , Weekly | |
| Add NXPI to Watchlist: View: Get Complete NXPI Trend Analysis ➞ | |
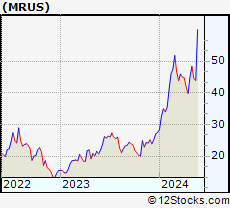 | MRUS Merus N.V. |
| Sector: Health Care | |
| SubSector: Biotechnology | |
| MarketCap: 417.385 Millions | |
| Recent Price: 53.24 Smart Investing & Trading Score: 68 | |
| Day Percent Change: -7.09% Day Change: -4.06 | |
| Week Change: -11.25% Year-to-date Change: 93.6% | |
| MRUS Links: Profile News Message Board | |
| Charts:- Daily , Weekly | |
| Add MRUS to Watchlist: View: Get Complete MRUS Trend Analysis ➞ | |
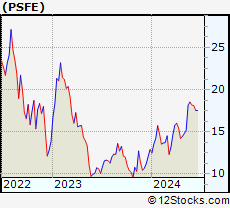 | PSFE Paysafe Limited |
| Sector: Technology | |
| SubSector: Software - Infrastructure | |
| MarketCap: 605 Millions | |
| Recent Price: 18.18 Smart Investing & Trading Score: 68 | |
| Day Percent Change: -1.41% Day Change: -0.26 | |
| Week Change: -1.94% Year-to-date Change: 40.9% | |
| PSFE Links: Profile News Message Board | |
| Charts:- Daily , Weekly | |
| Add PSFE to Watchlist: View: Get Complete PSFE Trend Analysis ➞ | |
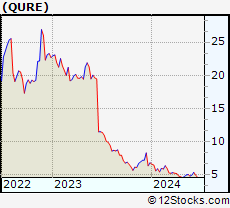 | QURE uniQure N.V. |
| Sector: Health Care | |
| SubSector: Biotechnology | |
| MarketCap: 2267.25 Millions | |
| Recent Price: 4.93 Smart Investing & Trading Score: 67 | |
| Day Percent Change: 5.34% Day Change: 0.25 | |
| Week Change: 3.57% Year-to-date Change: -27.2% | |
| QURE Links: Profile News Message Board | |
| Charts:- Daily , Weekly | |
| Add QURE to Watchlist: View: Get Complete QURE Trend Analysis ➞ | |
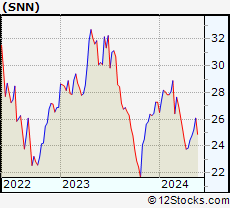 | SNN Smith & Nephew plc |
| Sector: Health Care | |
| SubSector: Medical Appliances & Equipment | |
| MarketCap: 15180.8 Millions | |
| Recent Price: 25.33 Smart Investing & Trading Score: 67 | |
| Day Percent Change: 1.24% Day Change: 0.31 | |
| Week Change: 1.85% Year-to-date Change: -7.2% | |
| SNN Links: Profile News Message Board | |
| Charts:- Daily , Weekly | |
| Add SNN to Watchlist: View: Get Complete SNN Trend Analysis ➞ | |
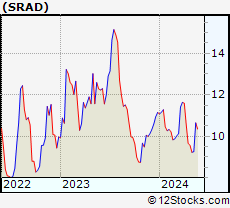 | SRAD Sportradar Group AG |
| Sector: Technology | |
| SubSector: Software - Application | |
| MarketCap: 3900 Millions | |
| Recent Price: 10.19 Smart Investing & Trading Score: 64 | |
| Day Percent Change: 1.49% Day Change: 0.15 | |
| Week Change: -2.49% Year-to-date Change: -8.6% | |
| SRAD Links: Profile News Message Board | |
| Charts:- Daily , Weekly | |
| Add SRAD to Watchlist: View: Get Complete SRAD Trend Analysis ➞ | |
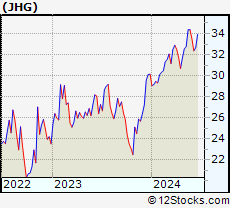 | JHG Janus Henderson Group plc |
| Sector: Financials | |
| SubSector: Asset Management | |
| MarketCap: 2992.33 Millions | |
| Recent Price: 33.50 Smart Investing & Trading Score: 64 | |
| Day Percent Change: 1.03% Day Change: 0.34 | |
| Week Change: -2.56% Year-to-date Change: 11.1% | |
| JHG Links: Profile News Message Board | |
| Charts:- Daily , Weekly | |
| Add JHG to Watchlist: View: Get Complete JHG Trend Analysis ➞ | |
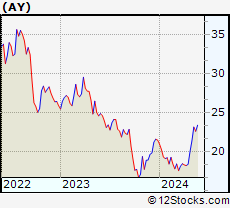 | AY Atlantica Yield plc |
| Sector: Utilities | |
| SubSector: Electric Utilities | |
| MarketCap: 2509.84 Millions | |
| Recent Price: 21.98 Smart Investing & Trading Score: 64 | |
| Day Percent Change: -1.83% Day Change: -0.41 | |
| Week Change: -6.15% Year-to-date Change: 2.2% | |
| AY Links: Profile News Message Board | |
| Charts:- Daily , Weekly | |
| Add AY to Watchlist: View: Get Complete AY Trend Analysis ➞ | |
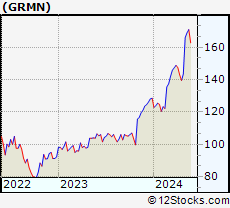 | GRMN Garmin Ltd. |
| Sector: Technology | |
| SubSector: Scientific & Technical Instruments | |
| MarketCap: 13909.3 Millions | |
| Recent Price: 163.85 Smart Investing & Trading Score: 61 | |
| Day Percent Change: 0.66% Day Change: 1.08 | |
| Week Change: 0.02% Year-to-date Change: 27.5% | |
| GRMN Links: Profile News Message Board | |
| Charts:- Daily , Weekly | |
| Add GRMN to Watchlist: View: Get Complete GRMN Trend Analysis ➞ | |
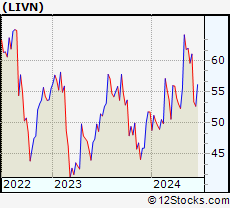 | LIVN LivaNova PLC |
| Sector: Health Care | |
| SubSector: Medical Appliances & Equipment | |
| MarketCap: 2060.5 Millions | |
| Recent Price: 61.07 Smart Investing & Trading Score: 61 | |
| Day Percent Change: 0.39% Day Change: 0.24 | |
| Week Change: 2.47% Year-to-date Change: 18.0% | |
| LIVN Links: Profile News Message Board | |
| Charts:- Daily , Weekly | |
| Add LIVN to Watchlist: View: Get Complete LIVN Trend Analysis ➞ | |
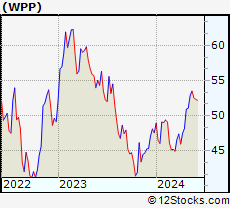 | WPP WPP plc |
| Sector: Services & Goods | |
| SubSector: Advertising Agencies | |
| MarketCap: 7840.25 Millions | |
| Recent Price: 52.34 Smart Investing & Trading Score: 61 | |
| Day Percent Change: 0.08% Day Change: 0.04 | |
| Week Change: -0.4% Year-to-date Change: 10.0% | |
| WPP Links: Profile News Message Board | |
| Charts:- Daily , Weekly | |
| Add WPP to Watchlist: View: Get Complete WPP Trend Analysis ➞ | |
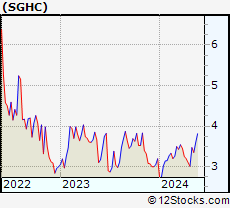 | SGHC Super Group (SGHC) Limited |
| Sector: Services & Goods | |
| SubSector: Gambling | |
| MarketCap: 1390 Millions | |
| Recent Price: 3.63 Smart Investing & Trading Score: 61 | |
| Day Percent Change: -1.63% Day Change: -0.06 | |
| Week Change: -4.85% Year-to-date Change: 13.6% | |
| SGHC Links: Profile News Message Board | |
| Charts:- Daily , Weekly | |
| Add SGHC to Watchlist: View: Get Complete SGHC Trend Analysis ➞ | |
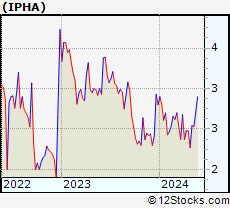 | IPHA Innate Pharma S.A. |
| Sector: Health Care | |
| SubSector: Biotechnology | |
| MarketCap: 309.485 Millions | |
| Recent Price: 2.74 Smart Investing & Trading Score: 61 | |
| Day Percent Change: -0.36% Day Change: -0.01 | |
| Week Change: -7.43% Year-to-date Change: -2.1% | |
| IPHA Links: Profile News Message Board | |
| Charts:- Daily , Weekly | |
| Add IPHA to Watchlist: View: Get Complete IPHA Trend Analysis ➞ | |
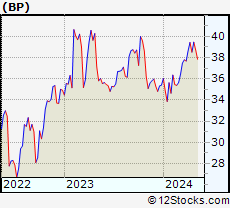 | BP BP PLC |
| Sector: Energy | |
| SubSector: Major Integrated Oil & Gas | |
| MarketCap: 66398.6 Millions | |
| Recent Price: 37.57 Smart Investing & Trading Score: 61 | |
| Day Percent Change: 1.73% Day Change: 0.64 | |
| Week Change: 2.31% Year-to-date Change: 6.1% | |
| BP Links: Profile News Message Board | |
| Charts:- Daily , Weekly | |
| Add BP to Watchlist: View: Get Complete BP Trend Analysis ➞ | |
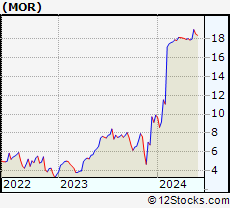 | MOR MorphoSys AG |
| Sector: Health Care | |
| SubSector: Biotechnology | |
| MarketCap: 2636.85 Millions | |
| Recent Price: 18.39 Smart Investing & Trading Score: 61 | |
| Day Percent Change: 0.16% Day Change: 0.03 | |
| Week Change: -0.81% Year-to-date Change: 85.8% | |
| MOR Links: Profile News Message Board | |
| Charts:- Daily , Weekly | |
| Add MOR to Watchlist: View: Get Complete MOR Trend Analysis ➞ | |
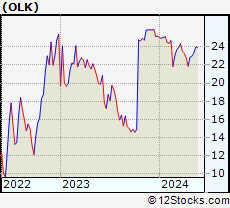 | OLK Olink Holding AB (publ) |
| Sector: Health Care | |
| SubSector: Diagnostics & Research | |
| MarketCap: 2370 Millions | |
| Recent Price: 23.95 Smart Investing & Trading Score: 59 | |
| Day Percent Change: -0.25% Day Change: -0.06 | |
| Week Change: -0.08% Year-to-date Change: -4.9% | |
| OLK Links: Profile News Message Board | |
| Charts:- Daily , Weekly | |
| Add OLK to Watchlist: View: Get Complete OLK Trend Analysis ➞ | |
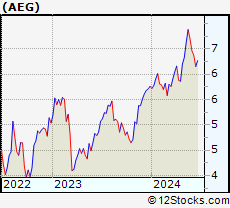 | AEG Aegon N.V. |
| Sector: Financials | |
| SubSector: Life Insurance | |
| MarketCap: 6154.26 Millions | |
| Recent Price: 6.46 Smart Investing & Trading Score: 58 | |
| Day Percent Change: 0.78% Day Change: 0.05 | |
| Week Change: -3.58% Year-to-date Change: 12.2% | |
| AEG Links: Profile News Message Board | |
| Charts:- Daily , Weekly | |
| Add AEG to Watchlist: View: Get Complete AEG Trend Analysis ➞ | |
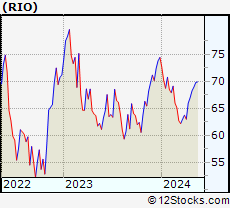 | RIO Rio Tinto Group |
| Sector: Materials | |
| SubSector: Industrial Metals & Minerals | |
| MarketCap: 69399.7 Millions | |
| Recent Price: 70.10 Smart Investing & Trading Score: 58 | |
| Day Percent Change: 0.52% Day Change: 0.36 | |
| Week Change: -2.44% Year-to-date Change: -5.9% | |
| RIO Links: Profile News Message Board | |
| Charts:- Daily , Weekly | |
| Add RIO to Watchlist: View: Get Complete RIO Trend Analysis ➞ | |
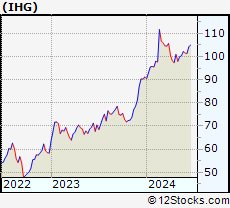 | IHG InterContinental Hotels Group PLC |
| Sector: Services & Goods | |
| SubSector: Lodging | |
| MarketCap: 6387.46 Millions | |
| Recent Price: 101.55 Smart Investing & Trading Score: 57 | |
| Day Percent Change: 2.37% Day Change: 2.35 | |
| Week Change: -0.66% Year-to-date Change: 11.4% | |
| IHG Links: Profile News Message Board | |
| Charts:- Daily , Weekly | |
| Add IHG to Watchlist: View: Get Complete IHG Trend Analysis ➞ | |
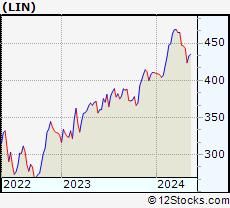 | LIN Linde plc |
| Sector: Materials | |
| SubSector: Specialty Chemicals | |
| MarketCap: 88539.2 Millions | |
| Recent Price: 435.52 Smart Investing & Trading Score: 57 | |
| Day Percent Change: 1.26% Day Change: 5.41 | |
| Week Change: -0.01% Year-to-date Change: 6.0% | |
| LIN Links: Profile News Message Board | |
| Charts:- Daily , Weekly | |
| Add LIN to Watchlist: View: Get Complete LIN Trend Analysis ➞ | |
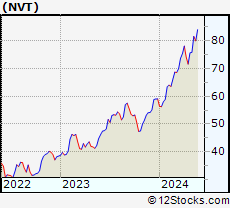 | NVT nVent Electric plc |
| Sector: Technology | |
| SubSector: Diversified Electronics | |
| MarketCap: 2752.86 Millions | |
| Recent Price: 81.38 Smart Investing & Trading Score: 56 | |
| Day Percent Change: -1.58% Day Change: -1.31 | |
| Week Change: -4.74% Year-to-date Change: 37.7% | |
| NVT Links: Profile News Message Board | |
| Charts:- Daily , Weekly | |
| Add NVT to Watchlist: View: Get Complete NVT Trend Analysis ➞ | |
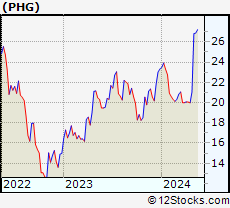 | PHG Koninklijke Philips N.V. |
| Sector: Technology | |
| SubSector: Electronic Equipment | |
| MarketCap: 32405.2 Millions | |
| Recent Price: 27.14 Smart Investing & Trading Score: 56 | |
| Day Percent Change: -0.80% Day Change: -0.22 | |
| Week Change: 0.59% Year-to-date Change: 16.3% | |
| PHG Links: Profile News Message Board | |
| Charts:- Daily , Weekly | |
| Add PHG to Watchlist: View: Get Complete PHG Trend Analysis ➞ | |
| For tabular summary view of above stock list: Summary View ➞ 0 - 25 , 25 - 50 , 50 - 75 , 75 - 100 , 100 - 125 , 125 - 150 | ||
| Click To Change The Sort Order: By Market Cap or Company Size Performance: Year-to-date, Week and Day | |
| Select Chart Type: | ||
|
Best Stocks Today 12Stocks.com |
© 2024 12Stocks.com Terms & Conditions Privacy Contact Us
All Information Provided Only For Education And Not To Be Used For Investing or Trading. See Terms & Conditions


One More Thing ... Get Best Stocks Delivered Daily!
Never Ever Miss A Move With Our Top Ten Stocks Lists
Find Best Stocks In Any Market - Bull or Bear Market
Take A Peek At Our Top Ten Stocks Lists: Daily, Weekly, Year-to-Date & Top Trends
Find Best Stocks In Any Market - Bull or Bear Market
Take A Peek At Our Top Ten Stocks Lists: Daily, Weekly, Year-to-Date & Top Trends
Europe Stocks With Best Up Trends [0-bearish to 100-bullish]: AC Immune[100], KNOT Offshore[100], Calliditas [100], Novartis AG[100], Logitech [100], Core [100], UBS [100], Jumia [100], BioNTech SE[100], Summit [100], Valneva SE[95]
Best Europe Stocks Year-to-Date:
NuCana [1120.42%], Affimed N.V[580%], Summit [232.76%], ADC [106.63%], Jumia [100.85%], Merus N.V[93.6%], MorphoSys AG[85.76%], NewAmsterdam Pharma[66.81%], MYT Netherlands[66.77%], Spotify [57.94%], On Holding[55.94%] Best Europe Stocks This Week:
Summit [156.95%], Calliditas [82.02%], AC Immune[31.36%], Jumia [15.1%], Genfit SA[13.35%], Polestar Automotive[11.98%], Metals Acquisition[10.74%], Exscientia [9.96%], IHS Holding[9.28%], Allied World[7.86%], Adaptimmune [7.62%] Best Europe Stocks Daily:
AC Immune[17.13%], Renalytix AI[15.19%], Allied World[14.88%], Adaptimmune [11.88%], ECARX [10.09%], IHS Holding[8.96%], Exscientia [7.29%], Affimed N.V[7.05%], Centessa [6.28%], Polestar Automotive[6.16%], uniQure N.V[5.34%]