
 Login Sign Up


| |||||
 |  | ||||

| 12Stocks.com Market Intelligence |
Best Biotech Stocks
|
|
| Quick Read: Best Biotech Stocks List By Performances & Trends: Daily, Weekly, Year-to-Date, Market Cap (Size) & Technical Trends | |||
| Best Biotech Stocks Views: Quick Browse View, Summary & Slide Show View | |||
| 12Stocks.com Biotech Stocks Performances & Trends Daily | |||||||||
|
|  The overall market intelligence score is 45 (0-bearish to 100-bullish) which puts Biotech sector in short term neutral trend. The market intelligence score from previous trading session is 57 and hence a deterioration of trend.
| ||||||||
Here are the market intelligence trend scores of the most requested Biotech stocks at 12Stocks.com (click stock name for detailed review):
|


| 12Stocks.com: Investing in Biotech sector with Stocks | |
|
The following table helps investors and traders sort through current performance and trends (as measured by market intelligence score) of various
stocks in the Biotech sector. Quick View: Move mouse or cursor over stock symbol (ticker) to view short-term Technical chart and over stock name to view long term chart. Click on  to add stock symbol to your watchlist and to add stock symbol to your watchlist and  to view watchlist. Click on any ticker or stock name for detailed market intelligence report for that stock. to view watchlist. Click on any ticker or stock name for detailed market intelligence report for that stock. |
12Stocks.com Performance of Stocks in Biotech Sector
| Ticker | Stock Name | Watchlist | Category | Recent Price | Market Intelligence Score | Change % | Weekly Change% |
| VAXX | Vaxxinity |   | Biotechnology | 0.08 | 42 | 45.95% | 58.82% |
| NVAX | Novavax | | Biotechnology | 13.01 | 75 | -9.65% | 46.51% |
| PROK | ProKidney | | Biotechnology | 4.05 | 80 | 6.99% | 44.31% |
| ANVS | Annovis Bio | | Biotechnology | 8.31 | 35 | 3.49% | 40.13% |
| IFRX | InflaRx N.V | | Biotechnology | 1.63 | 74 | 12.41% | 38.14% |
| ACIU | AC Immune | | Biotechnology | 3.18 | 37 | -6.74% | 37.66% |
| VXRT | Vaxart | | Biotechnology | 0.96 | 52 | -6.00% | 36.00% |
| HUMA | Humacyte | | Biotechnology | 6.33 | 68 | -1.40% | 34.68% |
| TSHA | Taysha Gene | | Biotechnology | 3.09 | 57 | -1.59% | 32.05% |
| MGNX | MacroGenics | | Biotechnology | 4.37 | 10 | -14.75% | 31.87% |
| ZURA | Zura Bio | | Biotechnology | 6.05 | 100 | 0.83% | 29.27% |
| EBS | Emergent Bio | | Biotechnology | 5.55 | 90 | 5.31% | 27.59% |
| PRME | Prime Medicine | | Biotechnology | 7.08 | 69 | 0.57% | 26.20% |
| OMGA | Omega | | Biotechnology | 2.41 | 69 | 1.26% | 22.96% |
| NRIX | Nurix | | Biotechnology | 16.59 | 100 | 7.73% | 22.80% |
| STOK | Stoke | | Biotechnology | 13.90 | 88 | -0.93% | 22.79% |
| CASI | CASI | | Biotechnology | 3.25 | 52 | -10.85% | 22.45% |
| GBIO | Generation Bio | | Biotechnology | 3.66 | 88 | -2.92% | 22.41% |
| PSTX | Poseida | | Biotechnology | 3.19 | 52 | -4.63% | 20.60% |
| ALLK | Allakos | | Biotechnology | 1.44 | 62 | -0.69% | 20.00% |
| MBIO | Mustang Bio | | Biotechnology | 0.31 | 49 | 3.97% | 20.00% |
| CVAC | CureVac N.V | | Biotechnology | 3.49 | 95 | 0.29% | 19.93% |
| VALN | Valneva SE | | Biotechnology | 8.88 | 100 | 0.74% | 19.68% |
| AVXL | Anavex Life | | Biotechnology | 4.55 | 62 | 1.11% | 19.42% |
| ATHA | Athira Pharma | | Biotechnology | 2.52 | 64 | -7.01% | 18.87% |
| To view more stocks, click on Next / Previous arrows or select different range: 0 - 25 , 25 - 50 , 50 - 75 , 75 - 100 , 100 - 125 , 125 - 150 , 150 - 175 , 175 - 200 , 200 - 225 , 225 - 250 , 250 - 275 , 275 - 300 , 300 - 325 , 325 - 350 , 350 - 375 , 375 - 400 | ||
 | Click To Change The Sort Order: By Market Cap or Company Size Performance: Year-to-date, Week and Day |  |
|
Get the most comprehensive stock market coverage daily at 12Stocks.com ➞ Best Stocks Today ➞ Best Stocks Weekly ➞ Best Stocks Year-to-Date ➞ Best Stocks Trends ➞  Best Stocks Today 12Stocks.com Best Nasdaq Stocks ➞ Best S&P 500 Stocks ➞ Best Tech Stocks ➞ Best Biotech Stocks ➞ |
| Detailed Overview of Biotech Stocks |
| Biotech Technical Overview, Leaders & Laggards, Top Biotech ETF Funds & Detailed Biotech Stocks List, Charts, Trends & More |
| Biotech Sector: Technical Analysis, Trends & YTD Performance | |
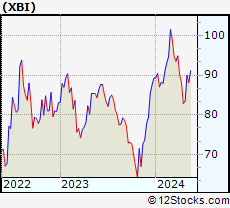
| Biotech sector, as represented by XBI, an exchange-traded fund [ETF] that holds basket of Biotech stocks (e.g, Amgen, Celgene) is up by 2.12% and is currently underperforming the overall market by -8.45% year-to-date. Below is a quick view of Technical charts and trends: | |
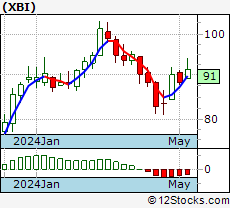 XBI Weekly Chart |
|
| Long Term Trend: Not Good | |
| Medium Term Trend: Very Good | |
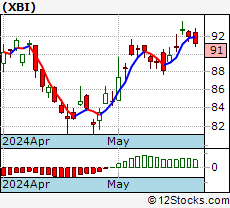 XBI Daily Chart |
|
| Short Term Trend: Good | |
| Overall Trend Score: 45 | |
| YTD Performance: 2.12% | |
| **Trend Scores & Views Are Only For Educational Purposes And Not For Investing | |
| 12Stocks.com: Top Performing Biotech Sector Stocks | ||||||||||||||||||||||||||||||||||||||||||||||||
 The top performing Biotech sector stocks year to date are
Now, more recently, over last week, the top performing Biotech sector stocks on the move are


|
||||||||||||||||||||||||||||||||||||||||||||||||
| 12Stocks.com: Investing in Biotech Sector using Exchange Traded Funds | |
|
The following table shows list of key exchange traded funds (ETF) that
help investors track Biotech Index. For detailed view, check out our ETF Funds section of our website. Quick View: Move mouse or cursor over ETF symbol (ticker) to view short-term Technical chart and over ETF name to view long term chart. Click on ticker or stock name for detailed view. Click on to add stock symbol to your watchlist and to view watchlist. |
12Stocks.com List of ETFs that track Biotech Index
| Ticker | ETF Name | Watchlist | Recent Price | Market Intelligence Score | Change % | Week % | Year-to-date % |
| LABD | Biotech Bear 3X | | 7.95 | 53 | 2.71 | -9.86 | -17.96% |
| XBI | Biotech | | 91.18 | 45 | -0.91 | 3.45 | 2.12% |
| LABU | Biotech Bull 3X | | 111.79 | 47 | -2.79 | 10 | -8.35% |
| IBB | Biotechnology | | 136.69 | 70 | -0.44 | 2.47 | 0.62% |
| IYH | Healthcare | | 61.34 | 75 | 0.08 | 1.78 | 7.15% |
| IHF | Healthcare Providers | | 53.91 | 88 | 0.50 | 1.45 | 2.67% |
| IXJ | Global Healthcare | | 93.31 | 88 | 0.01 | 1.83 | 7.6% |
| FBT | First NYSE | | 152.28 | 50 | -0.76 | 1.69 | -3.65% |
| CURE | Healthcare Bull 3X | | 119.10 | 82 | 0.46 | 5.46 | 17.06% |
| BIB | Biotechnology | | 56.96 | 57 | -0.99 | 4.57 | -0.16% |
| PTH | DWA Healthcare Momentum | | 42.63 | 52 | -0.46 | 2.03 | 8.92% |
| PBE | Biotech & Genome | | 64.62 | 50 | -0.65 | 0.87 | -1.85% |
| BBH | Biotech | | 167.99 | 83 | -0.43 | 2.4 | 1.62% |
| BBC | Bio Biotechnology Clinical | | 27.26 | 45 | -2.15 | 2.67 | 11.48% |
| BIS | Short Biotech | | 17.59 | 30 | 1.13 | -3.93 | -2.66% |
| BBP | Bio Biotechnology Products | | 56.13 | 47 | -1.06 | 1.5 | -3.38% |
| BTEC | Principal Healthcare Innovators | | 36.48 | 45 | -1.25 | 0.84 | 0.41% |
| 12Stocks.com: Charts, Trends, Fundamental Data and Performances of Biotech Stocks | |
|
We now take in-depth look at all Biotech stocks including charts, multi-period performances and overall trends (as measured by market intelligence score). One can sort Biotech stocks (click link to choose) by Daily, Weekly and by Year-to-Date performances. Also, one can sort by size of the company or by market capitalization. |
| Select Your Default Chart Type: | |||||
| |||||
| Click on stock symbol or name for detailed view. Click on to add stock symbol to your watchlist and to view watchlist. Quick View: Move mouse or cursor over "Daily" to quickly view daily Technical stock chart and over "Weekly" to view weekly Technical stock chart. | |||||
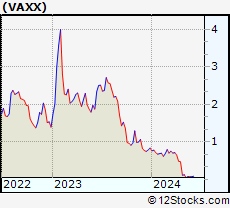 | VAXX Vaxxinity, Inc. |
| Sector: Health Care | |
| SubSector: Biotechnology | |
| MarketCap: 320 Millions | |
| Recent Price: 0.08 Market Intelligence Score: 42 | |
| Day Percent Change: 45.95% Day Change: 0.03 | |
| Week Change: 58.82% Year-to-date Change: -90.4% | |
| VAXX Links: Profile News Message Board | |
| Charts:- Daily , Weekly | |
| Add VAXX to Watchlist: View: Get Complete VAXX Trend Analysis ➞ | |
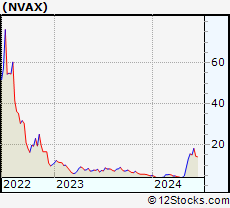 | NVAX Novavax, Inc. |
| Sector: Health Care | |
| SubSector: Biotechnology | |
| MarketCap: 376.185 Millions | |
| Recent Price: 13.01 Market Intelligence Score: 75 | |
| Day Percent Change: -9.65% Day Change: -1.39 | |
| Week Change: 46.51% Year-to-date Change: 171.0% | |
| NVAX Links: Profile News Message Board | |
| Charts:- Daily , Weekly | |
| Add NVAX to Watchlist: View: Get Complete NVAX Trend Analysis ➞ | |
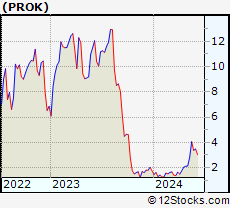 | PROK ProKidney Corp. |
| Sector: Health Care | |
| SubSector: Biotechnology | |
| MarketCap: 2470 Millions | |
| Recent Price: 4.05 Market Intelligence Score: 80 | |
| Day Percent Change: 6.99% Day Change: 0.26 | |
| Week Change: 44.31% Year-to-date Change: 132.4% | |
| PROK Links: Profile News Message Board | |
| Charts:- Daily , Weekly | |
| Add PROK to Watchlist: View: Get Complete PROK Trend Analysis ➞ | |
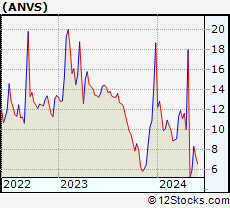 | ANVS Annovis Bio, Inc. |
| Sector: Health Care | |
| SubSector: Biotechnology | |
| MarketCap: 41487 Millions | |
| Recent Price: 8.31 Market Intelligence Score: 35 | |
| Day Percent Change: 3.49% Day Change: 0.28 | |
| Week Change: 40.13% Year-to-date Change: -55.6% | |
| ANVS Links: Profile News Message Board | |
| Charts:- Daily , Weekly | |
| Add ANVS to Watchlist: View: Get Complete ANVS Trend Analysis ➞ | |
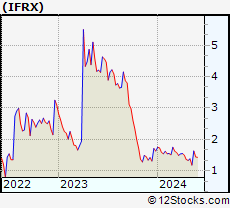 | IFRX InflaRx N.V. |
| Sector: Health Care | |
| SubSector: Biotechnology | |
| MarketCap: 103.185 Millions | |
| Recent Price: 1.63 Market Intelligence Score: 74 | |
| Day Percent Change: 12.41% Day Change: 0.18 | |
| Week Change: 38.14% Year-to-date Change: 0.0% | |
| IFRX Links: Profile News Message Board | |
| Charts:- Daily , Weekly | |
| Add IFRX to Watchlist: View: Get Complete IFRX Trend Analysis ➞ | |
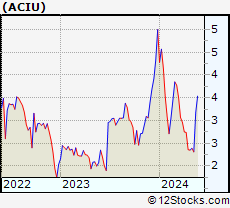 | ACIU AC Immune SA |
| Sector: Health Care | |
| SubSector: Biotechnology | |
| MarketCap: 356.585 Millions | |
| Recent Price: 3.18 Market Intelligence Score: 37 | |
| Day Percent Change: -6.74% Day Change: -0.23 | |
| Week Change: 37.66% Year-to-date Change: -36.4% | |
| ACIU Links: Profile News Message Board | |
| Charts:- Daily , Weekly | |
| Add ACIU to Watchlist: View: Get Complete ACIU Trend Analysis ➞ | |
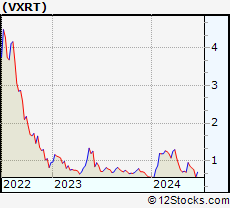 | VXRT Vaxart, Inc. |
| Sector: Health Care | |
| SubSector: Biotechnology | |
| MarketCap: 129.785 Millions | |
| Recent Price: 0.96 Market Intelligence Score: 52 | |
| Day Percent Change: -6.00% Day Change: -0.06 | |
| Week Change: 36% Year-to-date Change: 67.4% | |
| VXRT Links: Profile News Message Board | |
| Charts:- Daily , Weekly | |
| Add VXRT to Watchlist: View: Get Complete VXRT Trend Analysis ➞ | |
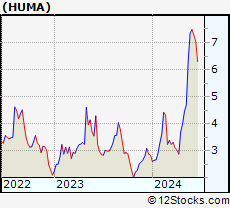 | HUMA Humacyte, Inc. |
| Sector: Health Care | |
| SubSector: Biotechnology | |
| MarketCap: 297 Millions | |
| Recent Price: 6.33 Market Intelligence Score: 68 | |
| Day Percent Change: -1.40% Day Change: -0.09 | |
| Week Change: 34.68% Year-to-date Change: 122.9% | |
| HUMA Links: Profile News Message Board | |
| Charts:- Daily , Weekly | |
| Add HUMA to Watchlist: View: Get Complete HUMA Trend Analysis ➞ | |
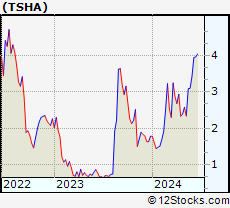 | TSHA Taysha Gene Therapies, Inc. |
| Sector: Health Care | |
| SubSector: Biotechnology | |
| MarketCap: 76487 Millions | |
| Recent Price: 3.09 Market Intelligence Score: 57 | |
| Day Percent Change: -1.59% Day Change: -0.05 | |
| Week Change: 32.05% Year-to-date Change: 73.6% | |
| TSHA Links: Profile News Message Board | |
| Charts:- Daily , Weekly | |
| Add TSHA to Watchlist: View: Get Complete TSHA Trend Analysis ➞ | |
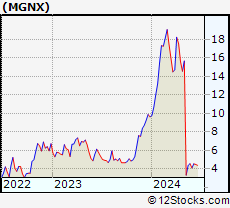 | MGNX MacroGenics, Inc. |
| Sector: Health Care | |
| SubSector: Biotechnology | |
| MarketCap: 262.785 Millions | |
| Recent Price: 4.37 Market Intelligence Score: 10 | |
| Day Percent Change: -14.75% Day Change: -0.75 | |
| Week Change: 31.87% Year-to-date Change: -54.6% | |
| MGNX Links: Profile News Message Board | |
| Charts:- Daily , Weekly | |
| Add MGNX to Watchlist: View: Get Complete MGNX Trend Analysis ➞ | |
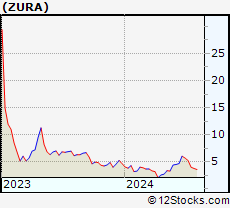 | ZURA Zura Bio Limited |
| Sector: Health Care | |
| SubSector: Biotechnology | |
| MarketCap: 242 Millions | |
| Recent Price: 6.05 Market Intelligence Score: 100 | |
| Day Percent Change: 0.83% Day Change: 0.05 | |
| Week Change: 29.27% Year-to-date Change: 29.1% | |
| ZURA Links: Profile News Message Board | |
| Charts:- Daily , Weekly | |
| Add ZURA to Watchlist: View: Get Complete ZURA Trend Analysis ➞ | |
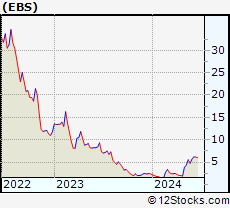 | EBS Emergent BioSolutions Inc. |
| Sector: Health Care | |
| SubSector: Biotechnology | |
| MarketCap: 2417.65 Millions | |
| Recent Price: 5.55 Market Intelligence Score: 90 | |
| Day Percent Change: 5.31% Day Change: 0.28 | |
| Week Change: 27.59% Year-to-date Change: 131.3% | |
| EBS Links: Profile News Message Board | |
| Charts:- Daily , Weekly | |
| Add EBS to Watchlist: View: Get Complete EBS Trend Analysis ➞ | |
 | PRME Prime Medicine, Inc. |
| Sector: Health Care | |
| SubSector: Biotechnology | |
| MarketCap: 1440 Millions | |
| Recent Price: 7.08 Market Intelligence Score: 69 | |
| Day Percent Change: 0.57% Day Change: 0.04 | |
| Week Change: 26.2% Year-to-date Change: -22.4% | |
| PRME Links: Profile News Message Board | |
| Charts:- Daily , Weekly | |
| Add PRME to Watchlist: View: Get Complete PRME Trend Analysis ➞ | |
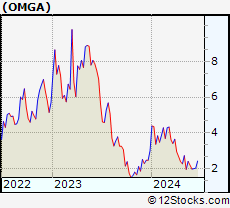 | OMGA Omega Therapeutics, Inc. |
| Sector: Health Care | |
| SubSector: Biotechnology | |
| MarketCap: 304 Millions | |
| Recent Price: 2.41 Market Intelligence Score: 69 | |
| Day Percent Change: 1.26% Day Change: 0.03 | |
| Week Change: 22.96% Year-to-date Change: -19.9% | |
| OMGA Links: Profile News Message Board | |
| Charts:- Daily , Weekly | |
| Add OMGA to Watchlist: View: Get Complete OMGA Trend Analysis ➞ | |
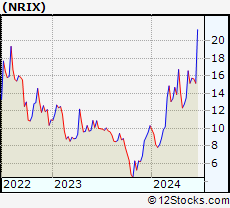 | NRIX Nurix Therapeutics, Inc. |
| Sector: Health Care | |
| SubSector: Biotechnology | |
| MarketCap: 16787 Millions | |
| Recent Price: 16.59 Market Intelligence Score: 100 | |
| Day Percent Change: 7.73% Day Change: 1.19 | |
| Week Change: 22.8% Year-to-date Change: 60.6% | |
| NRIX Links: Profile News Message Board | |
| Charts:- Daily , Weekly | |
| Add NRIX to Watchlist: View: Get Complete NRIX Trend Analysis ➞ | |
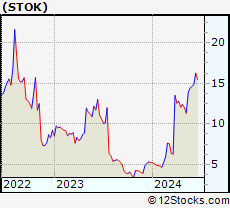 | STOK Stoke Therapeutics, Inc. |
| Sector: Health Care | |
| SubSector: Biotechnology | |
| MarketCap: 772.485 Millions | |
| Recent Price: 13.90 Market Intelligence Score: 88 | |
| Day Percent Change: -0.93% Day Change: -0.13 | |
| Week Change: 22.79% Year-to-date Change: 164.3% | |
| STOK Links: Profile News Message Board | |
| Charts:- Daily , Weekly | |
| Add STOK to Watchlist: View: Get Complete STOK Trend Analysis ➞ | |
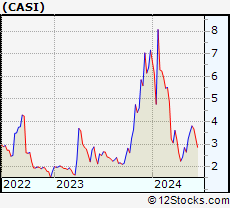 | CASI CASI Pharmaceuticals, Inc. |
| Sector: Health Care | |
| SubSector: Biotechnology | |
| MarketCap: 210.085 Millions | |
| Recent Price: 3.25 Market Intelligence Score: 52 | |
| Day Percent Change: -10.85% Day Change: -0.40 | |
| Week Change: 22.45% Year-to-date Change: -54.7% | |
| CASI Links: Profile News Message Board | |
| Charts:- Daily , Weekly | |
| Add CASI to Watchlist: View: Get Complete CASI Trend Analysis ➞ | |
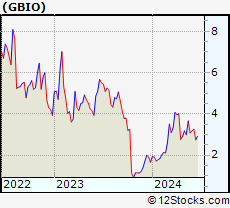 | GBIO Generation Bio Co. |
| Sector: Health Care | |
| SubSector: Biotechnology | |
| MarketCap: 17487 Millions | |
| Recent Price: 3.66 Market Intelligence Score: 88 | |
| Day Percent Change: -2.92% Day Change: -0.11 | |
| Week Change: 22.41% Year-to-date Change: 121.8% | |
| GBIO Links: Profile News Message Board | |
| Charts:- Daily , Weekly | |
| Add GBIO to Watchlist: View: Get Complete GBIO Trend Analysis ➞ | |
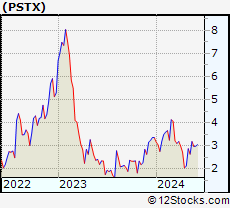 | PSTX Poseida Therapeutics, Inc. |
| Sector: Health Care | |
| SubSector: Biotechnology | |
| MarketCap: 64487 Millions | |
| Recent Price: 3.19 Market Intelligence Score: 52 | |
| Day Percent Change: -4.63% Day Change: -0.16 | |
| Week Change: 20.6% Year-to-date Change: -5.2% | |
| PSTX Links: Profile News Message Board | |
| Charts:- Daily , Weekly | |
| Add PSTX to Watchlist: View: Get Complete PSTX Trend Analysis ➞ | |
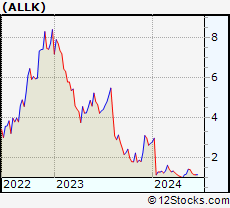 | ALLK Allakos Inc. |
| Sector: Health Care | |
| SubSector: Biotechnology | |
| MarketCap: 3233.55 Millions | |
| Recent Price: 1.44 Market Intelligence Score: 62 | |
| Day Percent Change: -0.69% Day Change: -0.01 | |
| Week Change: 20% Year-to-date Change: -47.3% | |
| ALLK Links: Profile News Message Board | |
| Charts:- Daily , Weekly | |
| Add ALLK to Watchlist: View: Get Complete ALLK Trend Analysis ➞ | |
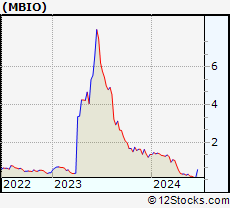 | MBIO Mustang Bio, Inc. |
| Sector: Health Care | |
| SubSector: Biotechnology | |
| MarketCap: 117.785 Millions | |
| Recent Price: 0.31 Market Intelligence Score: 49 | |
| Day Percent Change: 3.97% Day Change: 0.01 | |
| Week Change: 20% Year-to-date Change: -76.9% | |
| MBIO Links: Profile News Message Board | |
| Charts:- Daily , Weekly | |
| Add MBIO to Watchlist: View: Get Complete MBIO Trend Analysis ➞ | |
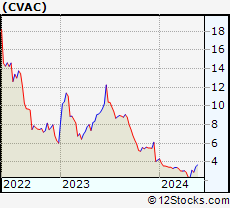 | CVAC CureVac N.V. |
| Sector: Health Care | |
| SubSector: Biotechnology | |
| MarketCap: 22957 Millions | |
| Recent Price: 3.49 Market Intelligence Score: 95 | |
| Day Percent Change: 0.29% Day Change: 0.01 | |
| Week Change: 19.93% Year-to-date Change: -17.2% | |
| CVAC Links: Profile News Message Board | |
| Charts:- Daily , Weekly | |
| Add CVAC to Watchlist: View: Get Complete CVAC Trend Analysis ➞ | |
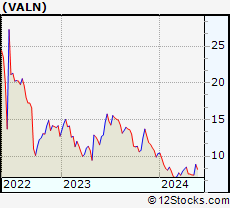 | VALN Valneva SE |
| Sector: Health Care | |
| SubSector: Biotechnology | |
| MarketCap: 1010 Millions | |
| Recent Price: 8.88 Market Intelligence Score: 100 | |
| Day Percent Change: 0.74% Day Change: 0.07 | |
| Week Change: 19.68% Year-to-date Change: -14.4% | |
| VALN Links: Profile News Message Board | |
| Charts:- Daily , Weekly | |
| Add VALN to Watchlist: View: Get Complete VALN Trend Analysis ➞ | |
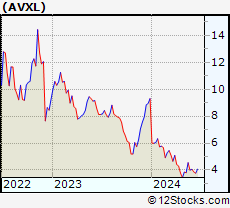 | AVXL Anavex Life Sciences Corp. |
| Sector: Health Care | |
| SubSector: Biotechnology | |
| MarketCap: 175.985 Millions | |
| Recent Price: 4.55 Market Intelligence Score: 62 | |
| Day Percent Change: 1.11% Day Change: 0.05 | |
| Week Change: 19.42% Year-to-date Change: -51.1% | |
| AVXL Links: Profile News Message Board | |
| Charts:- Daily , Weekly | |
| Add AVXL to Watchlist: View: Get Complete AVXL Trend Analysis ➞ | |
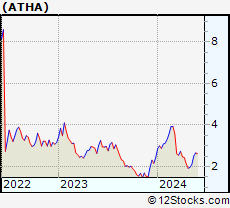 | ATHA Athira Pharma, Inc. |
| Sector: Health Care | |
| SubSector: Biotechnology | |
| MarketCap: 92487 Millions | |
| Recent Price: 2.52 Market Intelligence Score: 64 | |
| Day Percent Change: -7.01% Day Change: -0.19 | |
| Week Change: 18.87% Year-to-date Change: 3.3% | |
| ATHA Links: Profile News Message Board | |
| Charts:- Daily , Weekly | |
| Add ATHA to Watchlist: View: Get Complete ATHA Trend Analysis ➞ | |
| To view more stocks, click on Next / Previous arrows or select different range: 0 - 25 , 25 - 50 , 50 - 75 , 75 - 100 , 100 - 125 , 125 - 150 , 150 - 175 , 175 - 200 , 200 - 225 , 225 - 250 , 250 - 275 , 275 - 300 , 300 - 325 , 325 - 350 , 350 - 375 , 375 - 400 | ||
| Click To Change The Sort Order: By Market Cap or Company Size Performance: Year-to-date, Week and Day | |
| Select Chart Type: | ||
|
Best Stocks Today 12Stocks.com |
© 2024 12Stocks.com Terms & Conditions Privacy Contact Us
All Information Provided Only For Education And Not To Be Used For Investing or Trading. See Terms & Conditions


One More Thing ... Get Best Stocks Delivered Daily!
Never Ever Miss A Move With Our Top Ten Stocks Lists
Find Best Stocks In Any Market - Bull or Bear Market
Take A Peek At Our Top Ten Stocks Lists: Daily, Weekly, Year-to-Date & Top Trends
Find Best Stocks In Any Market - Bull or Bear Market
Take A Peek At Our Top Ten Stocks Lists: Daily, Weekly, Year-to-Date & Top Trends
Biotech Stocks With Best Up Trends [0-bearish to 100-bullish]: Nurix [100], Wave Life[100], Innate Pharma[100], Inventiva S.A[100], Arbutus Biopharma[100], Avidity [100], BeiGene [100], Zura Bio[100], Valneva SE[100], MannKind [100], Aurinia [100]
Best Biotech Stocks Year-to-Date:
Pieris [6081.32%], Precision [3297.26%], Inovio [2252.94%], Avenue [2216.77%], Assembly [1671.74%], Agenus [1211.75%], NuCana [1106.9%], Adverum nologies[962.7%], Affimed N.V[738.4%], Corbus [645.03%], Mesoblast [568.18%] Best Biotech Stocks This Week:
Vaxxinity [58.82%], Novavax [46.51%], ProKidney [44.31%], Annovis Bio[40.13%], InflaRx N.V[38.14%], AC Immune[37.66%], Vaxart [36%], Humacyte [34.68%], Taysha Gene[32.05%], MacroGenics [31.87%], Zura Bio[29.27%] Best Biotech Stocks Daily:
Vaxxinity [45.95%], Orchestra BioMed[12.77%], InflaRx N.V[12.41%], Fortress [9.66%], Tenaya [9.65%], Autolus [7.86%], Nurix [7.73%], Alpha Tau[7.60%], ProKidney [6.99%], Petros [6.91%], Sangamo [6.72%]