
 Login Sign Up


| |||||
 |  | ||||

| 12Stocks.com Market Intelligence |
Best Biotech Stocks
|
|
| Quick Read: Best Biotech Stocks List By Performances & Trends: Daily, Weekly, Year-to-Date, Market Cap (Size) & Technical Trends | |||
| Best Biotech Stocks Views: Quick Browse View, Summary & Slide Show View | |||
| 12Stocks.com Biotech Stocks Performances & Trends Daily | |||||||||
|
|  The overall market intelligence score is 35 (0-bearish to 100-bullish) which puts Biotech sector in short term bearish to neutral trend. The market intelligence score from previous trading session is 42 and hence a deterioration of trend.
| ||||||||
Here are the market intelligence trend scores of the most requested Biotech stocks at 12Stocks.com (click stock name for detailed review):
|


| 12Stocks.com: Investing in Biotech sector with Stocks | |
|
The following table helps investors and traders sort through current performance and trends (as measured by market intelligence score) of various
stocks in the Biotech sector. Quick View: Move mouse or cursor over stock symbol (ticker) to view short-term Technical chart and over stock name to view long term chart. Click on  to add stock symbol to your watchlist and to add stock symbol to your watchlist and  to view watchlist. Click on any ticker or stock name for detailed market intelligence report for that stock. to view watchlist. Click on any ticker or stock name for detailed market intelligence report for that stock. |
12Stocks.com Performance of Stocks in Biotech Sector
| Ticker | Stock Name | Watchlist | Category | Recent Price | Market Intelligence Score | Change % | Weekly Change% |
| TBPH | Theravance Biopharma |   | Biotechnology | 8.62 | 32 | 1.53% | 3.36% |
| UBX | Unity nology | | Biotechnology | 1.55 | 17 | -0.64% | 3.33% |
| KALV | KalVista | | Biotechnology | 11.68 | 42 | 3.87% | 3.32% |
| BIIB | Biogen | | Biotechnology | 224.94 | 93 | 2.21% | 3.27% |
| PROK | ProKidney | | Biotechnology | 3.48 | 63 | -17.14% | 3.26% |
| KALA | Kala | | Biotechnology | 6.72 | 49 | 3.23% | 3.23% |
| RPRX | Royalty Pharma | | Biotechnology | 27.40 | 17 | 3.91% | 2.93% |
| MRNS | Marinus | | Biotechnology | 1.42 | 17 | -3.40% | 2.90% |
| MDGL | Madrigal | | Biotechnology | 236.16 | 87 | 4.73% | 2.87% |
| KRON | Kronos Bio | | Biotechnology | 0.79 | 30 | 1.15% | 2.77% |
| AKRO | Akero | | Biotechnology | 18.82 | 20 | 2.79% | 2.73% |
| BPMC | Blueprint Medicines | | Biotechnology | 105.56 | 75 | -0.75% | 2.67% |
| SYRS | Syros | | Biotechnology | 5.10 | 50 | 2.00% | 2.62% |
| NAUT | Nautilus nology | | Biotechnology | 2.74 | 58 | 3.79% | 2.62% |
| ITCI | Intra-Cellular Therapies | | Biotechnology | 67.24 | 42 | 2.42% | 2.59% |
| GHRS | GH Research | | Biotechnology | 14.09 | 85 | 4.14% | 2.47% |
| TNGX | Tango | | Biotechnology | 6.92 | 42 | 3.90% | 2.37% |
| IMNM | Immunome | | Biotechnology | 14.94 | 49 | 1.56% | 2.33% |
| PCVX | Vaxcyte | | Biotechnology | 70.27 | 62 | 0.09% | 2.21% |
| OVID | Ovid | | Biotechnology | 3.06 | 27 | 0.00% | 2.17% |
| PRQR | ProQR | | Biotechnology | 1.92 | 32 | 4.35% | 2.13% |
| ABUS | Arbutus Biopharma | | Biotechnology | 3.36 | 83 | 1.20% | 2.13% |
| DYN | Dyne | | Biotechnology | 31.88 | 27 | 2.18% | 2.11% |
| VYGR | Voyager | | Biotechnology | 8.40 | 58 | 3.19% | 2.07% |
| AMRN | Amarin | | Biotechnology | 0.86 | 42 | 2.94% | 2.06% |
| To view more stocks, click on Next / Previous arrows or select different range: 0 - 25 , 25 - 50 , 50 - 75 , 75 - 100 , 100 - 125 , 125 - 150 , 150 - 175 , 175 - 200 , 200 - 225 , 225 - 250 , 250 - 275 , 275 - 300 , 300 - 325 , 325 - 350 , 350 - 375 , 375 - 400 | ||
 | Click To Change The Sort Order: By Market Cap or Company Size Performance: Year-to-date, Week and Day |  |
|
Get the most comprehensive stock market coverage daily at 12Stocks.com ➞ Best Stocks Today ➞ Best Stocks Weekly ➞ Best Stocks Year-to-Date ➞ Best Stocks Trends ➞  Best Stocks Today 12Stocks.com Best Nasdaq Stocks ➞ Best S&P 500 Stocks ➞ Best Tech Stocks ➞ Best Biotech Stocks ➞ |
| Detailed Overview of Biotech Stocks |
| Biotech Technical Overview, Leaders & Laggards, Top Biotech ETF Funds & Detailed Biotech Stocks List, Charts, Trends & More |
| Biotech Sector: Technical Analysis, Trends & YTD Performance | |
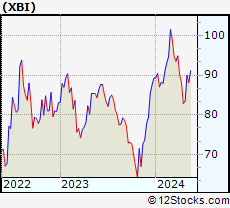
| Biotech sector, as represented by XBI, an exchange-traded fund [ETF] that holds basket of Biotech stocks (e.g, Amgen, Celgene) is down by -0.18% and is currently underperforming the overall market by -9.97% year-to-date. Below is a quick view of Technical charts and trends: | |
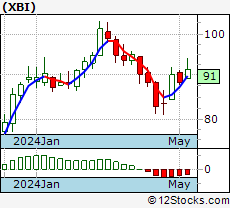 XBI Weekly Chart |
|
| Long Term Trend: Not Good | |
| Medium Term Trend: Deteriorating | |
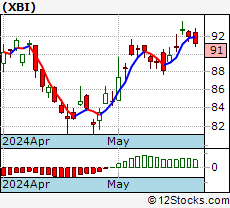 XBI Daily Chart |
|
| Short Term Trend: Very Good | |
| Overall Trend Score: 35 | |
| YTD Performance: -0.18% | |
| **Trend Scores & Views Are Only For Educational Purposes And Not For Investing | |
| 12Stocks.com: Top Performing Biotech Sector Stocks | ||||||||||||||||||||||||||||||||||||||||||||||||
 The top performing Biotech sector stocks year to date are
Now, more recently, over last week, the top performing Biotech sector stocks on the move are


|
||||||||||||||||||||||||||||||||||||||||||||||||
| 12Stocks.com: Investing in Biotech Sector using Exchange Traded Funds | |
|
The following table shows list of key exchange traded funds (ETF) that
help investors track Biotech Index. For detailed view, check out our ETF Funds section of our website. Quick View: Move mouse or cursor over ETF symbol (ticker) to view short-term Technical chart and over ETF name to view long term chart. Click on ticker or stock name for detailed view. Click on to add stock symbol to your watchlist and to view watchlist. |
12Stocks.com List of ETFs that track Biotech Index
| Ticker | ETF Name | Watchlist | Recent Price | Market Intelligence Score | Change % | Week % | Year-to-date % |
| LABD | Biotech Bear 3X | | 8.48 | 56 | -0.35 | -1.05 | -12.49% |
| XBI | Biotech | | 89.13 | 35 | 0.19 | 0.34 | -0.18% |
| LABU | Biotech Bull 3X | | 103.29 | 35 | 0.48 | 0.57 | -15.32% |
| IBB | Biotechnology | | 133.88 | 50 | 0.40 | -1.32 | -1.45% |
| IXJ | Global Healthcare | | 92.01 | 93 | 1.49 | -0.26 | 6.1% |
| IHF | Healthcare Providers | | 52.67 | 63 | 2.48 | 0.38 | 0.3% |
| IYH | Healthcare | | 59.88 | 50 | 0.73 | -1.19 | 4.6% |
| CURE | Healthcare Bull 3X | | 111.99 | 62 | 4.17 | -2.02 | 10.07% |
| BIB | Biotechnology | | 55.61 | 60 | 0.53 | -1.87 | -2.52% |
| PTH | DWA Healthcare Momentum | | 41.70 | 42 | 0.12 | -0.67 | 6.54% |
| FBT | First NYSE | | 149.94 | 60 | 1.26 | -1.02 | -5.13% |
| BIS | Short Biotech | | 17.91 | 48 | -1.49 | 1.13 | -0.89% |
| BBC | Bio Biotechnology Clinical | | 26.50 | 32 | 1.01 | 0.03 | 8.37% |
| BBH | Biotech | | 164.59 | 86 | 0.39 | -2.06 | -0.44% |
| PBE | Biotech & Genome | | 63.17 | 40 | 1.28 | -0.93 | -4.06% |
| BBP | Bio Biotechnology Products | | 56.44 | 40 | -0.60 | 2.08 | -2.85% |
| BTEC | Principal Healthcare Innovators | | 36.06 | 40 | 2.25 | 0.51 | -0.74% |
| 12Stocks.com: Charts, Trends, Fundamental Data and Performances of Biotech Stocks | |
|
We now take in-depth look at all Biotech stocks including charts, multi-period performances and overall trends (as measured by market intelligence score). One can sort Biotech stocks (click link to choose) by Daily, Weekly and by Year-to-Date performances. Also, one can sort by size of the company or by market capitalization. |
| Select Your Default Chart Type: | |||||
| |||||
| Click on stock symbol or name for detailed view. Click on to add stock symbol to your watchlist and to view watchlist. Quick View: Move mouse or cursor over "Daily" to quickly view daily Technical stock chart and over "Weekly" to view weekly Technical stock chart. | |||||
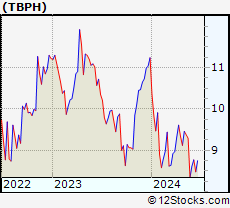 | TBPH Theravance Biopharma, Inc. |
| Sector: Health Care | |
| SubSector: Biotechnology | |
| MarketCap: 1404.55 Millions | |
| Recent Price: 8.62 Market Intelligence Score: 32 | |
| Day Percent Change: 1.53% Day Change: 0.13 | |
| Week Change: 3.36% Year-to-date Change: -23.3% | |
| TBPH Links: Profile News Message Board | |
| Charts:- Daily , Weekly | |
| Add TBPH to Watchlist: View: Get Complete TBPH Trend Analysis ➞ | |
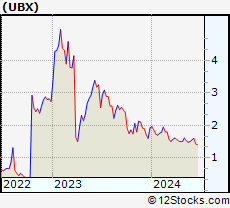 | UBX Unity Biotechnology, Inc. |
| Sector: Health Care | |
| SubSector: Biotechnology | |
| MarketCap: 254.985 Millions | |
| Recent Price: 1.55 Market Intelligence Score: 17 | |
| Day Percent Change: -0.64% Day Change: -0.01 | |
| Week Change: 3.33% Year-to-date Change: -19.7% | |
| UBX Links: Profile News Message Board | |
| Charts:- Daily , Weekly | |
| Add UBX to Watchlist: View: Get Complete UBX Trend Analysis ➞ | |
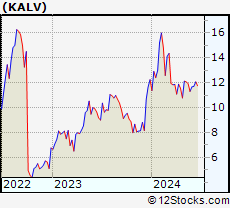 | KALV KalVista Pharmaceuticals, Inc. |
| Sector: Health Care | |
| SubSector: Biotechnology | |
| MarketCap: 138.385 Millions | |
| Recent Price: 11.68 Market Intelligence Score: 42 | |
| Day Percent Change: 3.87% Day Change: 0.44 | |
| Week Change: 3.32% Year-to-date Change: -4.7% | |
| KALV Links: Profile News Message Board | |
| Charts:- Daily , Weekly | |
| Add KALV to Watchlist: View: Get Complete KALV Trend Analysis ➞ | |
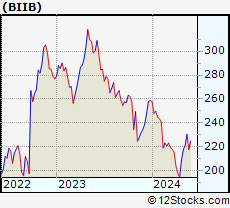 | BIIB Biogen Inc. |
| Sector: Health Care | |
| SubSector: Biotechnology | |
| MarketCap: 53102.6 Millions | |
| Recent Price: 224.94 Market Intelligence Score: 93 | |
| Day Percent Change: 2.21% Day Change: 4.87 | |
| Week Change: 3.27% Year-to-date Change: -13.1% | |
| BIIB Links: Profile News Message Board | |
| Charts:- Daily , Weekly | |
| Add BIIB to Watchlist: View: Get Complete BIIB Trend Analysis ➞ | |
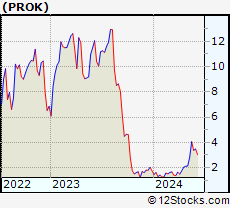 | PROK ProKidney Corp. |
| Sector: Health Care | |
| SubSector: Biotechnology | |
| MarketCap: 2470 Millions | |
| Recent Price: 3.48 Market Intelligence Score: 63 | |
| Day Percent Change: -17.14% Day Change: -0.72 | |
| Week Change: 3.26% Year-to-date Change: 99.4% | |
| PROK Links: Profile News Message Board | |
| Charts:- Daily , Weekly | |
| Add PROK to Watchlist: View: Get Complete PROK Trend Analysis ➞ | |
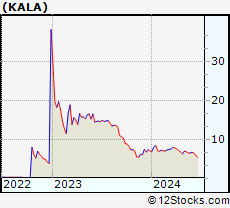 | KALA Kala Pharmaceuticals, Inc. |
| Sector: Health Care | |
| SubSector: Biotechnology | |
| MarketCap: 276.485 Millions | |
| Recent Price: 6.72 Market Intelligence Score: 49 | |
| Day Percent Change: 3.23% Day Change: 0.21 | |
| Week Change: 3.23% Year-to-date Change: -4.0% | |
| KALA Links: Profile News Message Board | |
| Charts:- Daily , Weekly | |
| Add KALA to Watchlist: View: Get Complete KALA Trend Analysis ➞ | |
 | RPRX Royalty Pharma plc |
| Sector: Health Care | |
| SubSector: Biotechnology | |
| MarketCap: 28457 Millions | |
| Recent Price: 27.40 Market Intelligence Score: 17 | |
| Day Percent Change: 3.91% Day Change: 1.03 | |
| Week Change: 2.93% Year-to-date Change: -2.5% | |
| RPRX Links: Profile News Message Board | |
| Charts:- Daily , Weekly | |
| Add RPRX to Watchlist: View: Get Complete RPRX Trend Analysis ➞ | |
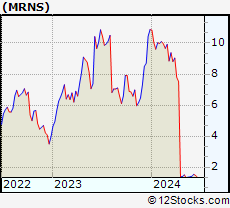 | MRNS Marinus Pharmaceuticals, Inc. |
| Sector: Health Care | |
| SubSector: Biotechnology | |
| MarketCap: 222.885 Millions | |
| Recent Price: 1.42 Market Intelligence Score: 17 | |
| Day Percent Change: -3.40% Day Change: -0.05 | |
| Week Change: 2.9% Year-to-date Change: -86.9% | |
| MRNS Links: Profile News Message Board | |
| Charts:- Daily , Weekly | |
| Add MRNS to Watchlist: View: Get Complete MRNS Trend Analysis ➞ | |
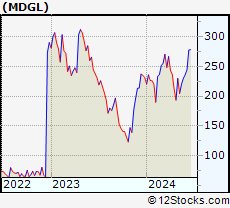 | MDGL Madrigal Pharmaceuticals, Inc. |
| Sector: Health Care | |
| SubSector: Biotechnology | |
| MarketCap: 1104.35 Millions | |
| Recent Price: 236.16 Market Intelligence Score: 87 | |
| Day Percent Change: 4.73% Day Change: 10.67 | |
| Week Change: 2.87% Year-to-date Change: 2.1% | |
| MDGL Links: Profile News Message Board | |
| Charts:- Daily , Weekly | |
| Add MDGL to Watchlist: View: Get Complete MDGL Trend Analysis ➞ | |
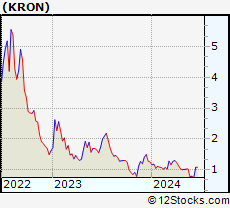 | KRON Kronos Bio, Inc. |
| Sector: Health Care | |
| SubSector: Biotechnology | |
| MarketCap: 17287 Millions | |
| Recent Price: 0.79 Market Intelligence Score: 30 | |
| Day Percent Change: 1.15% Day Change: 0.01 | |
| Week Change: 2.77% Year-to-date Change: -36.8% | |
| KRON Links: Profile News Message Board | |
| Charts:- Daily , Weekly | |
| Add KRON to Watchlist: View: Get Complete KRON Trend Analysis ➞ | |
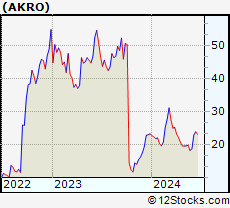 | AKRO Akero Therapeutics, Inc. |
| Sector: Health Care | |
| SubSector: Biotechnology | |
| MarketCap: 675.085 Millions | |
| Recent Price: 18.82 Market Intelligence Score: 20 | |
| Day Percent Change: 2.79% Day Change: 0.51 | |
| Week Change: 2.73% Year-to-date Change: -19.4% | |
| AKRO Links: Profile News Message Board | |
| Charts:- Daily , Weekly | |
| Add AKRO to Watchlist: View: Get Complete AKRO Trend Analysis ➞ | |
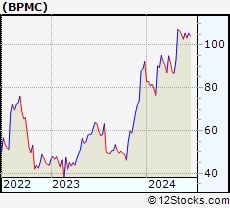 | BPMC Blueprint Medicines Corporation |
| Sector: Health Care | |
| SubSector: Biotechnology | |
| MarketCap: 3113.55 Millions | |
| Recent Price: 105.56 Market Intelligence Score: 75 | |
| Day Percent Change: -0.75% Day Change: -0.80 | |
| Week Change: 2.67% Year-to-date Change: 14.4% | |
| BPMC Links: Profile News Message Board | |
| Charts:- Daily , Weekly | |
| Add BPMC to Watchlist: View: Get Complete BPMC Trend Analysis ➞ | |
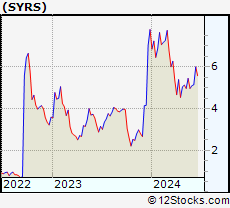 | SYRS Syros Pharmaceuticals, Inc. |
| Sector: Health Care | |
| SubSector: Biotechnology | |
| MarketCap: 275.485 Millions | |
| Recent Price: 5.10 Market Intelligence Score: 50 | |
| Day Percent Change: 2.00% Day Change: 0.10 | |
| Week Change: 2.62% Year-to-date Change: -34.5% | |
| SYRS Links: Profile News Message Board | |
| Charts:- Daily , Weekly | |
| Add SYRS to Watchlist: View: Get Complete SYRS Trend Analysis ➞ | |
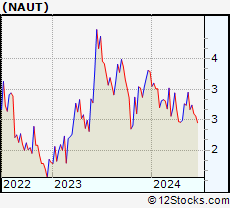 | NAUT Nautilus Biotechnology, Inc. |
| Sector: Health Care | |
| SubSector: Biotechnology | |
| MarketCap: 458 Millions | |
| Recent Price: 2.74 Market Intelligence Score: 58 | |
| Day Percent Change: 3.79% Day Change: 0.10 | |
| Week Change: 2.62% Year-to-date Change: -16.7% | |
| NAUT Links: Profile News Message Board | |
| Charts:- Daily , Weekly | |
| Add NAUT to Watchlist: View: Get Complete NAUT Trend Analysis ➞ | |
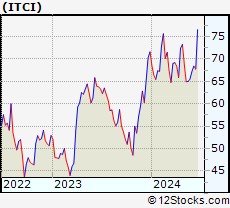 | ITCI Intra-Cellular Therapies, Inc. |
| Sector: Health Care | |
| SubSector: Biotechnology | |
| MarketCap: 991.885 Millions | |
| Recent Price: 67.24 Market Intelligence Score: 42 | |
| Day Percent Change: 2.42% Day Change: 1.59 | |
| Week Change: 2.59% Year-to-date Change: -6.1% | |
| ITCI Links: Profile News Message Board | |
| Charts:- Daily , Weekly | |
| Add ITCI to Watchlist: View: Get Complete ITCI Trend Analysis ➞ | |
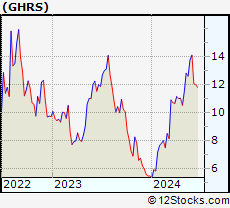 | GHRS GH Research PLC |
| Sector: Health Care | |
| SubSector: Biotechnology | |
| MarketCap: 614 Millions | |
| Recent Price: 14.09 Market Intelligence Score: 85 | |
| Day Percent Change: 4.14% Day Change: 0.56 | |
| Week Change: 2.47% Year-to-date Change: 157.1% | |
| GHRS Links: Profile News Message Board | |
| Charts:- Daily , Weekly | |
| Add GHRS to Watchlist: View: Get Complete GHRS Trend Analysis ➞ | |
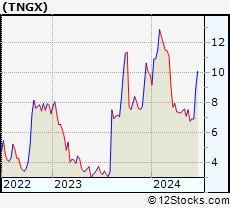 | TNGX Tango Therapeutics, Inc. |
| Sector: Health Care | |
| SubSector: Biotechnology | |
| MarketCap: 302 Millions | |
| Recent Price: 6.92 Market Intelligence Score: 42 | |
| Day Percent Change: 3.90% Day Change: 0.26 | |
| Week Change: 2.37% Year-to-date Change: -30.1% | |
| TNGX Links: Profile News Message Board | |
| Charts:- Daily , Weekly | |
| Add TNGX to Watchlist: View: Get Complete TNGX Trend Analysis ➞ | |
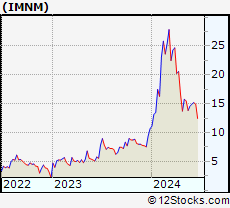 | IMNM Immunome, Inc. |
| Sector: Health Care | |
| SubSector: Biotechnology | |
| MarketCap: 12487 Millions | |
| Recent Price: 14.94 Market Intelligence Score: 49 | |
| Day Percent Change: 1.56% Day Change: 0.23 | |
| Week Change: 2.33% Year-to-date Change: 39.8% | |
| IMNM Links: Profile News Message Board | |
| Charts:- Daily , Weekly | |
| Add IMNM to Watchlist: View: Get Complete IMNM Trend Analysis ➞ | |
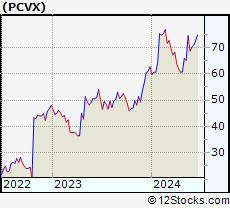 | PCVX Vaxcyte, Inc. |
| Sector: Health Care | |
| SubSector: Biotechnology | |
| MarketCap: 13887 Millions | |
| Recent Price: 70.27 Market Intelligence Score: 62 | |
| Day Percent Change: 0.09% Day Change: 0.06 | |
| Week Change: 2.21% Year-to-date Change: 12.0% | |
| PCVX Links: Profile News Message Board | |
| Charts:- Daily , Weekly | |
| Add PCVX to Watchlist: View: Get Complete PCVX Trend Analysis ➞ | |
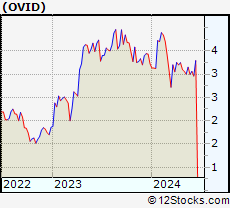 | OVID Ovid Therapeutics Inc. |
| Sector: Health Care | |
| SubSector: Biotechnology | |
| MarketCap: 130.385 Millions | |
| Recent Price: 3.06 Market Intelligence Score: 27 | |
| Day Percent Change: 0.00% Day Change: 0.00 | |
| Week Change: 2.17% Year-to-date Change: -5.0% | |
| OVID Links: Profile News Message Board | |
| Charts:- Daily , Weekly | |
| Add OVID to Watchlist: View: Get Complete OVID Trend Analysis ➞ | |
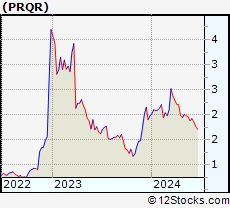 | PRQR ProQR Therapeutics N.V. |
| Sector: Health Care | |
| SubSector: Biotechnology | |
| MarketCap: 324.385 Millions | |
| Recent Price: 1.92 Market Intelligence Score: 32 | |
| Day Percent Change: 4.35% Day Change: 0.08 | |
| Week Change: 2.13% Year-to-date Change: -3.0% | |
| PRQR Links: Profile News Message Board | |
| Charts:- Daily , Weekly | |
| Add PRQR to Watchlist: View: Get Complete PRQR Trend Analysis ➞ | |
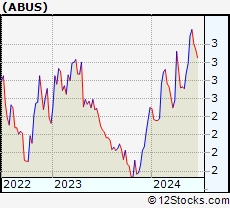 | ABUS Arbutus Biopharma Corporation |
| Sector: Health Care | |
| SubSector: Biotechnology | |
| MarketCap: 110.885 Millions | |
| Recent Price: 3.36 Market Intelligence Score: 83 | |
| Day Percent Change: 1.20% Day Change: 0.04 | |
| Week Change: 2.13% Year-to-date Change: 34.4% | |
| ABUS Links: Profile News Message Board | |
| Charts:- Daily , Weekly | |
| Add ABUS to Watchlist: View: Get Complete ABUS Trend Analysis ➞ | |
 | DYN Dyne Therapeutics, Inc. |
| Sector: Health Care | |
| SubSector: Biotechnology | |
| MarketCap: 88487 Millions | |
| Recent Price: 31.88 Market Intelligence Score: 27 | |
| Day Percent Change: 2.18% Day Change: 0.68 | |
| Week Change: 2.11% Year-to-date Change: 139.7% | |
| DYN Links: Profile News Message Board | |
| Charts:- Daily , Weekly | |
| Add DYN to Watchlist: View: Get Complete DYN Trend Analysis ➞ | |
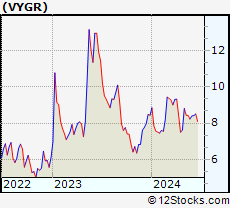 | VYGR Voyager Therapeutics, Inc. |
| Sector: Health Care | |
| SubSector: Biotechnology | |
| MarketCap: 321.085 Millions | |
| Recent Price: 8.40 Market Intelligence Score: 58 | |
| Day Percent Change: 3.19% Day Change: 0.26 | |
| Week Change: 2.07% Year-to-date Change: -0.5% | |
| VYGR Links: Profile News Message Board | |
| Charts:- Daily , Weekly | |
| Add VYGR to Watchlist: View: Get Complete VYGR Trend Analysis ➞ | |
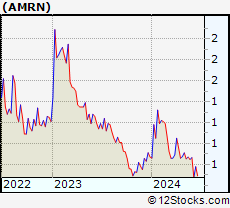 | AMRN Amarin Corporation plc |
| Sector: Health Care | |
| SubSector: Biotechnology | |
| MarketCap: 4197.45 Millions | |
| Recent Price: 0.86 Market Intelligence Score: 42 | |
| Day Percent Change: 2.94% Day Change: 0.02 | |
| Week Change: 2.06% Year-to-date Change: -0.6% | |
| AMRN Links: Profile News Message Board | |
| Charts:- Daily , Weekly | |
| Add AMRN to Watchlist: View: Get Complete AMRN Trend Analysis ➞ | |
| To view more stocks, click on Next / Previous arrows or select different range: 0 - 25 , 25 - 50 , 50 - 75 , 75 - 100 , 100 - 125 , 125 - 150 , 150 - 175 , 175 - 200 , 200 - 225 , 225 - 250 , 250 - 275 , 275 - 300 , 300 - 325 , 325 - 350 , 350 - 375 , 375 - 400 | ||
| Click To Change The Sort Order: By Market Cap or Company Size Performance: Year-to-date, Week and Day | |
| Select Chart Type: | ||
|
Best Stocks Today 12Stocks.com |
© 2024 12Stocks.com Terms & Conditions Privacy Contact Us
All Information Provided Only For Education And Not To Be Used For Investing or Trading. See Terms & Conditions


One More Thing ... Get Best Stocks Delivered Daily!
Never Ever Miss A Move With Our Top Ten Stocks Lists
Find Best Stocks In Any Market - Bull or Bear Market
Take A Peek At Our Top Ten Stocks Lists: Daily, Weekly, Year-to-Date & Top Trends
Find Best Stocks In Any Market - Bull or Bear Market
Take A Peek At Our Top Ten Stocks Lists: Daily, Weekly, Year-to-Date & Top Trends
Biotech Stocks With Best Up Trends [0-bearish to 100-bullish]: AC Immune[100], PureTech Health[100], Heron [100], Agenus [100], BioNTech SE[100], Summit [100], Taysha Gene[95], Valneva SE[95], Novo Nordisk[95], Emergent Bio[93], Vertex [93]
Best Biotech Stocks Year-to-Date:
Pieris [5277.75%], Precision [3434.25%], Avenue [2036.65%], Inovio [1886.27%], Agenus [1795.16%], Assembly [1747.34%], NuCana [1120.42%], Adverum nologies[952.07%], Corbus [608.61%], Affimed N.V[580%], Mesoblast [576.36%] Best Biotech Stocks This Week:
Summit [156.95%], Insmed [150.23%], Ikena Oncology[35.11%], Orchestra BioMed[32%], AC Immune[31.36%], Arcturus [27.58%], Janux [22.4%], Emergent Bio[19.75%], Agios [15.37%], Agenus [15.2%], PepGen [14.72%] Best Biotech Stocks Daily:
Exicure [26.55%], AC Immune[17.13%], Emergent Bio[11.98%], Adaptimmune [11.88%], Sol-Gel Technologies[10.96%], Greenwich Life[10.59%], Taysha Gene[9.58%], Minerva Neuro[9.44%], PureTech Health[9.31%], Annovis Bio[9.17%], Cara [8.61%]