
 Login Sign Up


| |||||
 |  | ||||

| 12Stocks.com Market Intelligence |
Best Biotech Stocks
|
|
| Quick Read: Best Biotech Stocks List By Performances & Trends: Daily, Weekly, Year-to-Date, Market Cap (Size) & Technical Trends | |||
| Best Biotech Stocks Views: Quick Browse View, Summary & Slide Show View | |||
| 12Stocks.com Biotech Stocks Performances & Trends Daily | |||||||||
|
|  The overall market intelligence score is 35 (0-bearish to 100-bullish) which puts Biotech sector in short term bearish to neutral trend. The market intelligence score from previous trading session is 42 and hence a deterioration of trend.
| ||||||||
Here are the market intelligence trend scores of the most requested Biotech stocks at 12Stocks.com (click stock name for detailed review):
|


| 12Stocks.com: Investing in Biotech sector with Stocks | |
|
The following table helps investors and traders sort through current performance and trends (as measured by market intelligence score) of various
stocks in the Biotech sector. Quick View: Move mouse or cursor over stock symbol (ticker) to view short-term Technical chart and over stock name to view long term chart. Click on  to add stock symbol to your watchlist and to add stock symbol to your watchlist and  to view watchlist. Click on any ticker or stock name for detailed market intelligence report for that stock. to view watchlist. Click on any ticker or stock name for detailed market intelligence report for that stock. |
12Stocks.com Performance of Stocks in Biotech Sector
| Ticker | Stock Name | Watchlist | Category | Recent Price | Market Intelligence Score | Change % | Weekly Change% |
| SMMT | Summit |   | Biotechnology | 8.69 | 100 | -20.47% | 156.95% |
| INSM | Insmed | | Biotechnology | 55.05 | 93 | -3.39% | 150.23% |
| IKNA | Ikena Oncology | | Biotechnology | 1.77 | 93 | -1.12% | 35.11% |
| OBIO | Orchestra BioMed | | Biotechnology | 6.93 | 81 | 3.90% | 32.00% |
| ACIU | AC Immune | | Biotechnology | 4.65 | 100 | 17.13% | 31.36% |
| ARCT | Arcturus | | Biotechnology | 38.81 | 82 | 0.86% | 27.58% |
| JANX | Janux | | Biotechnology | 53.50 | 75 | 6.13% | 22.40% |
| EBS | Emergent Bio | | Biotechnology | 5.70 | 93 | 11.98% | 19.75% |
| AGIO | Agios | | Biotechnology | 36.34 | 58 | -3.20% | 15.37% |
| AGEN | Agenus | | Biotechnology | 15.69 | 100 | 3.84% | 15.20% |
| PEPG | PepGen | | Biotechnology | 16.33 | 67 | -0.12% | 14.72% |
| SCPH | sc | | Biotechnology | 3.91 | 25 | -2.49% | 13.66% |
| GNFT | Genfit SA | | Biotechnology | 5.18 | 83 | -12.50% | 13.35% |
| PRTC | PureTech Health | | Biotechnology | 32.98 | 100 | 9.31% | 12.75% |
| RPTX | Repare | | Biotechnology | 3.48 | 42 | 3.88% | 12.62% |
| XFOR | X4 | | Biotechnology | 1.01 | 65 | 3.49% | 12.17% |
| GLSI | Greenwich Life | | Biotechnology | 14.83 | 90 | 10.59% | 11.59% |
| GRTX | Galera | | Biotechnology | 0.22 | 52 | -6.48% | 10.71% |
| TSHA | Taysha Gene | | Biotechnology | 3.43 | 95 | 9.58% | 10.47% |
| EXAI | Exscientia | | Biotechnology | 5.30 | 69 | 7.29% | 9.96% |
| CORT | Corcept | | Biotechnology | 30.17 | 68 | -3.33% | 9.63% |
| MCRB | Seres | | Biotechnology | 1.00 | 54 | 2.67% | 9.10% |
| FULC | Fulcrum | | Biotechnology | 7.85 | 49 | 2.61% | 8.73% |
| BLTE | Belite Bio | | Biotechnology | 48.95 | 93 | 0.41% | 8.71% |
| RANI | Rani | | Biotechnology | 5.50 | 75 | 7.42% | 8.70% |
| To view more stocks, click on Next / Previous arrows or select different range: 0 - 25 , 25 - 50 , 50 - 75 , 75 - 100 , 100 - 125 , 125 - 150 , 150 - 175 , 175 - 200 , 200 - 225 , 225 - 250 , 250 - 275 , 275 - 300 , 300 - 325 , 325 - 350 , 350 - 375 , 375 - 400 | ||
 | Click To Change The Sort Order: By Market Cap or Company Size Performance: Year-to-date, Week and Day |  |
|
Get the most comprehensive stock market coverage daily at 12Stocks.com ➞ Best Stocks Today ➞ Best Stocks Weekly ➞ Best Stocks Year-to-Date ➞ Best Stocks Trends ➞  Best Stocks Today 12Stocks.com Best Nasdaq Stocks ➞ Best S&P 500 Stocks ➞ Best Tech Stocks ➞ Best Biotech Stocks ➞ |
| Detailed Overview of Biotech Stocks |
| Biotech Technical Overview, Leaders & Laggards, Top Biotech ETF Funds & Detailed Biotech Stocks List, Charts, Trends & More |
| Biotech Sector: Technical Analysis, Trends & YTD Performance | |
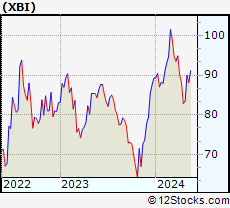
| Biotech sector, as represented by XBI, an exchange-traded fund [ETF] that holds basket of Biotech stocks (e.g, Amgen, Celgene) is down by -0.18% and is currently underperforming the overall market by -9.97% year-to-date. Below is a quick view of Technical charts and trends: | |
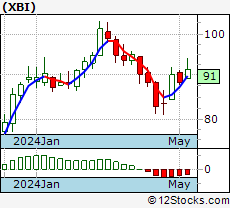 XBI Weekly Chart |
|
| Long Term Trend: Not Good | |
| Medium Term Trend: Deteriorating | |
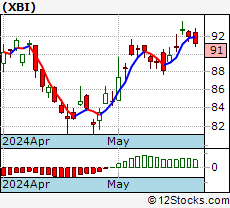 XBI Daily Chart |
|
| Short Term Trend: Very Good | |
| Overall Trend Score: 35 | |
| YTD Performance: -0.18% | |
| **Trend Scores & Views Are Only For Educational Purposes And Not For Investing | |
| 12Stocks.com: Top Performing Biotech Sector Stocks | ||||||||||||||||||||||||||||||||||||||||||||||||
 The top performing Biotech sector stocks year to date are
Now, more recently, over last week, the top performing Biotech sector stocks on the move are


|
||||||||||||||||||||||||||||||||||||||||||||||||
| 12Stocks.com: Investing in Biotech Sector using Exchange Traded Funds | |
|
The following table shows list of key exchange traded funds (ETF) that
help investors track Biotech Index. For detailed view, check out our ETF Funds section of our website. Quick View: Move mouse or cursor over ETF symbol (ticker) to view short-term Technical chart and over ETF name to view long term chart. Click on ticker or stock name for detailed view. Click on to add stock symbol to your watchlist and to view watchlist. |
12Stocks.com List of ETFs that track Biotech Index
| Ticker | ETF Name | Watchlist | Recent Price | Market Intelligence Score | Change % | Week % | Year-to-date % |
| LABD | Biotech Bear 3X | | 8.48 | 56 | -0.35 | -1.05 | -12.49% |
| XBI | Biotech | | 89.13 | 35 | 0.19 | 0.34 | -0.18% |
| LABU | Biotech Bull 3X | | 103.29 | 35 | 0.48 | 0.57 | -15.32% |
| IBB | Biotechnology | | 133.88 | 50 | 0.40 | -1.32 | -1.45% |
| IXJ | Global Healthcare | | 92.01 | 93 | 1.49 | -0.26 | 6.1% |
| IHF | Healthcare Providers | | 52.67 | 63 | 2.48 | 0.38 | 0.3% |
| IYH | Healthcare | | 59.88 | 50 | 0.73 | -1.19 | 4.6% |
| CURE | Healthcare Bull 3X | | 111.99 | 62 | 4.17 | -2.02 | 10.07% |
| BIB | Biotechnology | | 55.61 | 60 | 0.53 | -1.87 | -2.52% |
| PTH | DWA Healthcare Momentum | | 41.70 | 42 | 0.12 | -0.67 | 6.54% |
| FBT | First NYSE | | 149.94 | 60 | 1.26 | -1.02 | -5.13% |
| BIS | Short Biotech | | 17.91 | 48 | -1.49 | 1.13 | -0.89% |
| BBC | Bio Biotechnology Clinical | | 26.50 | 32 | 1.01 | 0.03 | 8.37% |
| BBH | Biotech | | 164.59 | 86 | 0.39 | -2.06 | -0.44% |
| PBE | Biotech & Genome | | 63.17 | 40 | 1.28 | -0.93 | -4.06% |
| BBP | Bio Biotechnology Products | | 56.44 | 40 | -0.60 | 2.08 | -2.85% |
| BTEC | Principal Healthcare Innovators | | 36.06 | 40 | 2.25 | 0.51 | -0.74% |
| 12Stocks.com: Charts, Trends, Fundamental Data and Performances of Biotech Stocks | |
|
We now take in-depth look at all Biotech stocks including charts, multi-period performances and overall trends (as measured by market intelligence score). One can sort Biotech stocks (click link to choose) by Daily, Weekly and by Year-to-Date performances. Also, one can sort by size of the company or by market capitalization. |
| Select Your Default Chart Type: | |||||
| |||||
| Click on stock symbol or name for detailed view. Click on to add stock symbol to your watchlist and to view watchlist. Quick View: Move mouse or cursor over "Daily" to quickly view daily Technical stock chart and over "Weekly" to view weekly Technical stock chart. | |||||
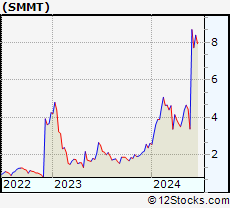 | SMMT Summit Therapeutics plc |
| Sector: Health Care | |
| SubSector: Biotechnology | |
| MarketCap: 156.985 Millions | |
| Recent Price: 8.69 Market Intelligence Score: 100 | |
| Day Percent Change: -20.47% Day Change: -2.23 | |
| Week Change: 156.95% Year-to-date Change: 232.8% | |
| SMMT Links: Profile News Message Board | |
| Charts:- Daily , Weekly | |
| Add SMMT to Watchlist: View: Get Complete SMMT Trend Analysis ➞ | |
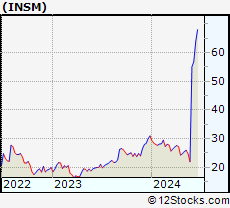 | INSM Insmed Incorporated |
| Sector: Health Care | |
| SubSector: Biotechnology | |
| MarketCap: 1452.45 Millions | |
| Recent Price: 55.05 Market Intelligence Score: 93 | |
| Day Percent Change: -3.39% Day Change: -1.93 | |
| Week Change: 150.23% Year-to-date Change: 77.6% | |
| INSM Links: Profile News Message Board | |
| Charts:- Daily , Weekly | |
| Add INSM to Watchlist: View: Get Complete INSM Trend Analysis ➞ | |
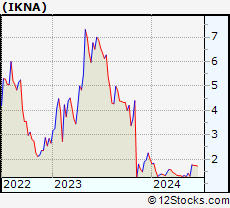 | IKNA Ikena Oncology, Inc. |
| Sector: Health Care | |
| SubSector: Biotechnology | |
| MarketCap: 277 Millions | |
| Recent Price: 1.77 Market Intelligence Score: 93 | |
| Day Percent Change: -1.12% Day Change: -0.02 | |
| Week Change: 35.11% Year-to-date Change: -11.5% | |
| IKNA Links: Profile News Message Board | |
| Charts:- Daily , Weekly | |
| Add IKNA to Watchlist: View: Get Complete IKNA Trend Analysis ➞ | |
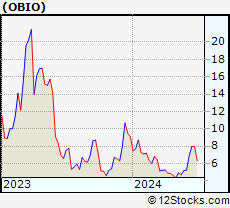 | OBIO Orchestra BioMed Holdings, Inc. |
| Sector: Health Care | |
| SubSector: Biotechnology | |
| MarketCap: 271 Millions | |
| Recent Price: 6.93 Market Intelligence Score: 81 | |
| Day Percent Change: 3.90% Day Change: 0.26 | |
| Week Change: 32% Year-to-date Change: -23.9% | |
| OBIO Links: Profile News Message Board | |
| Charts:- Daily , Weekly | |
| Add OBIO to Watchlist: View: Get Complete OBIO Trend Analysis ➞ | |
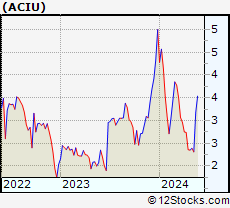 | ACIU AC Immune SA |
| Sector: Health Care | |
| SubSector: Biotechnology | |
| MarketCap: 356.585 Millions | |
| Recent Price: 4.65 Market Intelligence Score: 100 | |
| Day Percent Change: 17.13% Day Change: 0.68 | |
| Week Change: 31.36% Year-to-date Change: -7.0% | |
| ACIU Links: Profile News Message Board | |
| Charts:- Daily , Weekly | |
| Add ACIU to Watchlist: View: Get Complete ACIU Trend Analysis ➞ | |
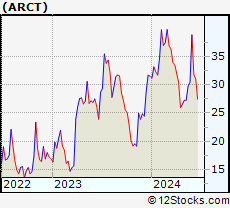 | ARCT Arcturus Therapeutics Holdings Inc. |
| Sector: Health Care | |
| SubSector: Biotechnology | |
| MarketCap: 241.385 Millions | |
| Recent Price: 38.81 Market Intelligence Score: 82 | |
| Day Percent Change: 0.86% Day Change: 0.33 | |
| Week Change: 27.58% Year-to-date Change: 23.1% | |
| ARCT Links: Profile News Message Board | |
| Charts:- Daily , Weekly | |
| Add ARCT to Watchlist: View: Get Complete ARCT Trend Analysis ➞ | |
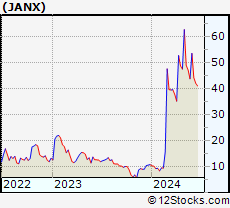 | JANX Janux Therapeutics, Inc. |
| Sector: Health Care | |
| SubSector: Biotechnology | |
| MarketCap: 496 Millions | |
| Recent Price: 53.50 Market Intelligence Score: 75 | |
| Day Percent Change: 6.13% Day Change: 3.09 | |
| Week Change: 22.4% Year-to-date Change: 397.9% | |
| JANX Links: Profile News Message Board | |
| Charts:- Daily , Weekly | |
| Add JANX to Watchlist: View: Get Complete JANX Trend Analysis ➞ | |
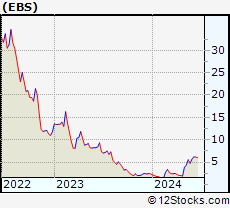 | EBS Emergent BioSolutions Inc. |
| Sector: Health Care | |
| SubSector: Biotechnology | |
| MarketCap: 2417.65 Millions | |
| Recent Price: 5.70 Market Intelligence Score: 93 | |
| Day Percent Change: 11.98% Day Change: 0.61 | |
| Week Change: 19.75% Year-to-date Change: 137.5% | |
| EBS Links: Profile News Message Board | |
| Charts:- Daily , Weekly | |
| Add EBS to Watchlist: View: Get Complete EBS Trend Analysis ➞ | |
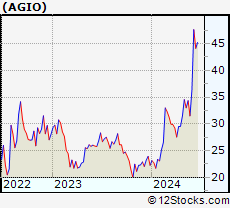 | AGIO Agios Pharmaceuticals, Inc. |
| Sector: Health Care | |
| SubSector: Biotechnology | |
| MarketCap: 2613.35 Millions | |
| Recent Price: 36.34 Market Intelligence Score: 58 | |
| Day Percent Change: -3.20% Day Change: -1.20 | |
| Week Change: 15.37% Year-to-date Change: 63.2% | |
| AGIO Links: Profile News Message Board | |
| Charts:- Daily , Weekly | |
| Add AGIO to Watchlist: View: Get Complete AGIO Trend Analysis ➞ | |
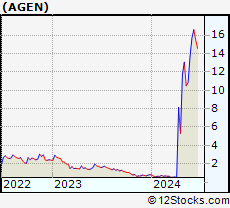 | AGEN Agenus Inc. |
| Sector: Health Care | |
| SubSector: Biotechnology | |
| MarketCap: 274.885 Millions | |
| Recent Price: 15.69 Market Intelligence Score: 100 | |
| Day Percent Change: 3.84% Day Change: 0.58 | |
| Week Change: 15.2% Year-to-date Change: 1,795.2% | |
| AGEN Links: Profile News Message Board | |
| Charts:- Daily , Weekly | |
| Add AGEN to Watchlist: View: Get Complete AGEN Trend Analysis ➞ | |
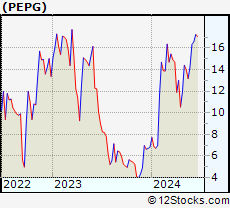 | PEPG PepGen Inc. |
| Sector: Health Care | |
| SubSector: Biotechnology | |
| MarketCap: 216 Millions | |
| Recent Price: 16.33 Market Intelligence Score: 67 | |
| Day Percent Change: -0.12% Day Change: -0.02 | |
| Week Change: 14.72% Year-to-date Change: 138.7% | |
| PEPG Links: Profile News Message Board | |
| Charts:- Daily , Weekly | |
| Add PEPG to Watchlist: View: Get Complete PEPG Trend Analysis ➞ | |
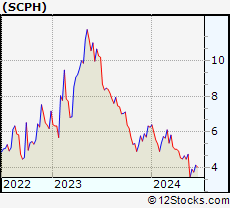 | SCPH scPharmaceuticals Inc. |
| Sector: Health Care | |
| SubSector: Biotechnology | |
| MarketCap: 136.185 Millions | |
| Recent Price: 3.91 Market Intelligence Score: 25 | |
| Day Percent Change: -2.49% Day Change: -0.10 | |
| Week Change: 13.66% Year-to-date Change: -37.6% | |
| SCPH Links: Profile News Message Board | |
| Charts:- Daily , Weekly | |
| Add SCPH to Watchlist: View: Get Complete SCPH Trend Analysis ➞ | |
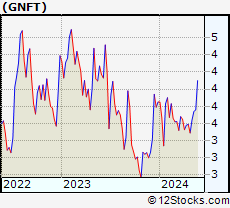 | GNFT Genfit SA |
| Sector: Health Care | |
| SubSector: Biotechnology | |
| MarketCap: 529.285 Millions | |
| Recent Price: 5.18 Market Intelligence Score: 83 | |
| Day Percent Change: -12.50% Day Change: -0.74 | |
| Week Change: 13.35% Year-to-date Change: 34.6% | |
| GNFT Links: Profile News Message Board | |
| Charts:- Daily , Weekly | |
| Add GNFT to Watchlist: View: Get Complete GNFT Trend Analysis ➞ | |
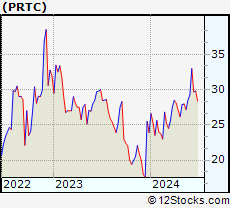 | PRTC PureTech Health plc |
| Sector: Health Care | |
| SubSector: Biotechnology | |
| MarketCap: 819 Millions | |
| Recent Price: 32.98 Market Intelligence Score: 100 | |
| Day Percent Change: 9.31% Day Change: 2.81 | |
| Week Change: 12.75% Year-to-date Change: 37.9% | |
| PRTC Links: Profile News Message Board | |
| Charts:- Daily , Weekly | |
| Add PRTC to Watchlist: View: Get Complete PRTC Trend Analysis ➞ | |
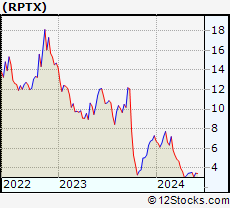 | RPTX Repare Therapeutics Inc. |
| Sector: Health Care | |
| SubSector: Biotechnology | |
| MarketCap: 13687 Millions | |
| Recent Price: 3.48 Market Intelligence Score: 42 | |
| Day Percent Change: 3.88% Day Change: 0.13 | |
| Week Change: 12.62% Year-to-date Change: -52.3% | |
| RPTX Links: Profile News Message Board | |
| Charts:- Daily , Weekly | |
| Add RPTX to Watchlist: View: Get Complete RPTX Trend Analysis ➞ | |
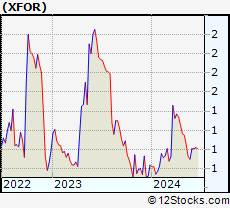 | XFOR X4 Pharmaceuticals, Inc. |
| Sector: Health Care | |
| SubSector: Biotechnology | |
| MarketCap: 143.385 Millions | |
| Recent Price: 1.01 Market Intelligence Score: 65 | |
| Day Percent Change: 3.49% Day Change: 0.03 | |
| Week Change: 12.17% Year-to-date Change: 20.5% | |
| XFOR Links: Profile News Message Board | |
| Charts:- Daily , Weekly | |
| Add XFOR to Watchlist: View: Get Complete XFOR Trend Analysis ➞ | |
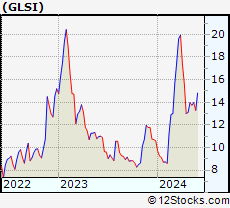 | GLSI Greenwich LifeSciences, Inc. |
| Sector: Health Care | |
| SubSector: Biotechnology | |
| MarketCap: 86487 Millions | |
| Recent Price: 14.83 Market Intelligence Score: 90 | |
| Day Percent Change: 10.59% Day Change: 1.42 | |
| Week Change: 11.59% Year-to-date Change: 39.9% | |
| GLSI Links: Profile News Message Board | |
| Charts:- Daily , Weekly | |
| Add GLSI to Watchlist: View: Get Complete GLSI Trend Analysis ➞ | |
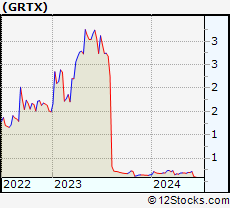 | GRTX Galera Therapeutics, Inc. |
| Sector: Health Care | |
| SubSector: Biotechnology | |
| MarketCap: 277.585 Millions | |
| Recent Price: 0.22 Market Intelligence Score: 52 | |
| Day Percent Change: -6.48% Day Change: -0.01 | |
| Week Change: 10.71% Year-to-date Change: 47.9% | |
| GRTX Links: Profile News Message Board | |
| Charts:- Daily , Weekly | |
| Add GRTX to Watchlist: View: Get Complete GRTX Trend Analysis ➞ | |
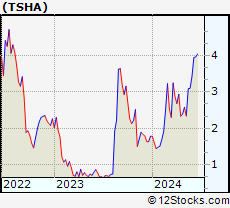 | TSHA Taysha Gene Therapies, Inc. |
| Sector: Health Care | |
| SubSector: Biotechnology | |
| MarketCap: 76487 Millions | |
| Recent Price: 3.43 Market Intelligence Score: 95 | |
| Day Percent Change: 9.58% Day Change: 0.30 | |
| Week Change: 10.47% Year-to-date Change: 92.7% | |
| TSHA Links: Profile News Message Board | |
| Charts:- Daily , Weekly | |
| Add TSHA to Watchlist: View: Get Complete TSHA Trend Analysis ➞ | |
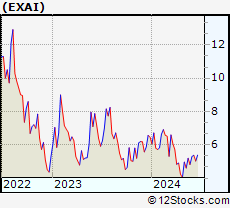 | EXAI Exscientia plc |
| Sector: Health Care | |
| SubSector: Biotechnology | |
| MarketCap: 796 Millions | |
| Recent Price: 5.30 Market Intelligence Score: 69 | |
| Day Percent Change: 7.29% Day Change: 0.36 | |
| Week Change: 9.96% Year-to-date Change: -18.1% | |
| EXAI Links: Profile News Message Board | |
| Charts:- Daily , Weekly | |
| Add EXAI to Watchlist: View: Get Complete EXAI Trend Analysis ➞ | |
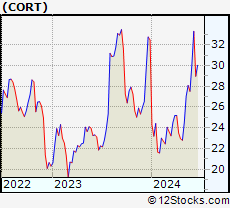 | CORT Corcept Therapeutics Incorporated |
| Sector: Health Care | |
| SubSector: Biotechnology | |
| MarketCap: 1228.45 Millions | |
| Recent Price: 30.17 Market Intelligence Score: 68 | |
| Day Percent Change: -3.33% Day Change: -1.04 | |
| Week Change: 9.63% Year-to-date Change: -7.1% | |
| CORT Links: Profile News Message Board | |
| Charts:- Daily , Weekly | |
| Add CORT to Watchlist: View: Get Complete CORT Trend Analysis ➞ | |
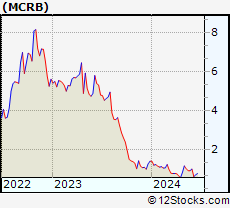 | MCRB Seres Therapeutics, Inc. |
| Sector: Health Care | |
| SubSector: Biotechnology | |
| MarketCap: 217.585 Millions | |
| Recent Price: 1.00 Market Intelligence Score: 54 | |
| Day Percent Change: 2.67% Day Change: 0.03 | |
| Week Change: 9.1% Year-to-date Change: -28.6% | |
| MCRB Links: Profile News Message Board | |
| Charts:- Daily , Weekly | |
| Add MCRB to Watchlist: View: Get Complete MCRB Trend Analysis ➞ | |
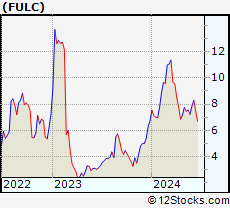 | FULC Fulcrum Therapeutics, Inc. |
| Sector: Health Care | |
| SubSector: Biotechnology | |
| MarketCap: 274.785 Millions | |
| Recent Price: 7.85 Market Intelligence Score: 49 | |
| Day Percent Change: 2.61% Day Change: 0.20 | |
| Week Change: 8.73% Year-to-date Change: 16.3% | |
| FULC Links: Profile News Message Board | |
| Charts:- Daily , Weekly | |
| Add FULC to Watchlist: View: Get Complete FULC Trend Analysis ➞ | |
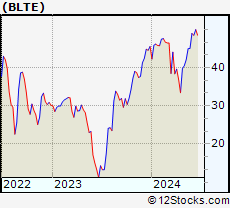 | BLTE Belite Bio, Inc |
| Sector: Health Care | |
| SubSector: Biotechnology | |
| MarketCap: 404 Millions | |
| Recent Price: 48.95 Market Intelligence Score: 93 | |
| Day Percent Change: 0.41% Day Change: 0.20 | |
| Week Change: 8.71% Year-to-date Change: 7.5% | |
| BLTE Links: Profile News Message Board | |
| Charts:- Daily , Weekly | |
| Add BLTE to Watchlist: View: Get Complete BLTE Trend Analysis ➞ | |
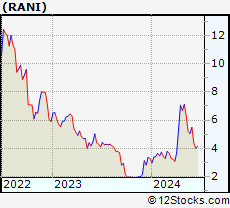 | RANI Rani Therapeutics Holdings, Inc. |
| Sector: Health Care | |
| SubSector: Biotechnology | |
| MarketCap: 202 Millions | |
| Recent Price: 5.50 Market Intelligence Score: 75 | |
| Day Percent Change: 7.42% Day Change: 0.38 | |
| Week Change: 8.7% Year-to-date Change: 66.7% | |
| RANI Links: Profile News Message Board | |
| Charts:- Daily , Weekly | |
| Add RANI to Watchlist: View: Get Complete RANI Trend Analysis ➞ | |
| To view more stocks, click on Next / Previous arrows or select different range: 0 - 25 , 25 - 50 , 50 - 75 , 75 - 100 , 100 - 125 , 125 - 150 , 150 - 175 , 175 - 200 , 200 - 225 , 225 - 250 , 250 - 275 , 275 - 300 , 300 - 325 , 325 - 350 , 350 - 375 , 375 - 400 | ||
| Click To Change The Sort Order: By Market Cap or Company Size Performance: Year-to-date, Week and Day | |
| Select Chart Type: | ||
|
Best Stocks Today 12Stocks.com |
© 2024 12Stocks.com Terms & Conditions Privacy Contact Us
All Information Provided Only For Education And Not To Be Used For Investing or Trading. See Terms & Conditions


One More Thing ... Get Best Stocks Delivered Daily!
Never Ever Miss A Move With Our Top Ten Stocks Lists
Find Best Stocks In Any Market - Bull or Bear Market
Take A Peek At Our Top Ten Stocks Lists: Daily, Weekly, Year-to-Date & Top Trends
Find Best Stocks In Any Market - Bull or Bear Market
Take A Peek At Our Top Ten Stocks Lists: Daily, Weekly, Year-to-Date & Top Trends
Biotech Stocks With Best Up Trends [0-bearish to 100-bullish]: AC Immune[100], PureTech Health[100], Heron [100], Agenus [100], BioNTech SE[100], Summit [100], Taysha Gene[95], Valneva SE[95], Novo Nordisk[95], Emergent Bio[93], Vertex [93]
Best Biotech Stocks Year-to-Date:
Pieris [5277.75%], Precision [3434.25%], Avenue [2036.65%], Inovio [1886.27%], Agenus [1795.16%], Assembly [1747.34%], NuCana [1120.42%], Adverum nologies[952.07%], Corbus [608.61%], Affimed N.V[580%], Mesoblast [576.36%] Best Biotech Stocks This Week:
Summit [156.95%], Insmed [150.23%], Ikena Oncology[35.11%], Orchestra BioMed[32%], AC Immune[31.36%], Arcturus [27.58%], Janux [22.4%], Emergent Bio[19.75%], Agios [15.37%], Agenus [15.2%], PepGen [14.72%] Best Biotech Stocks Daily:
Exicure [26.55%], AC Immune[17.13%], Emergent Bio[11.98%], Adaptimmune [11.88%], Sol-Gel Technologies[10.96%], Greenwich Life[10.59%], Taysha Gene[9.58%], Minerva Neuro[9.44%], PureTech Health[9.31%], Annovis Bio[9.17%], Cara [8.61%]