
 Login Sign Up


| |||||
 |  | ||||

| 12Stocks.com Market Intelligence |
Best SmallCap Stocks
|
| In a hurry? Small Cap Stock Lists: Performance Trends Table, Stock Charts
Sort Small Cap stocks: Daily, Weekly, Year-to-Date, Market Cap & Trends. Filter Small Cap stocks list by sector: Show all, Tech, Finance, Energy, Staples, Retail, Industrial, Materials, Utilities and HealthCare Filter Small Cap stocks list by size: All Large Medium Small and MicroCap |
| 12Stocks.com Small Cap Stocks Performances & Trends Daily | |||||||||
|
|  The overall Smart Investing & Trading Score is 86 (0-bearish to 100-bullish) which puts Small Cap index in short term bullish trend. The Smart Investing & Trading Score from previous trading session is 48 and hence an improvement of trend.
| ||||||||
Here are the Smart Investing & Trading Scores of the most requested small cap stocks at 12Stocks.com (click stock name for detailed review):
|


| 12Stocks.com: Investing in Smallcap Index with Stocks | |
|
The following table helps investors and traders sort through current performance and trends (as measured by Smart Investing & Trading Score) of various
stocks in the Smallcap Index. Quick View: Move mouse or cursor over stock symbol (ticker) to view short-term technical chart and over stock name to view long term chart. Click on  to add stock symbol to your watchlist and to add stock symbol to your watchlist and  to view watchlist. Click on any ticker or stock name for detailed market intelligence report for that stock. to view watchlist. Click on any ticker or stock name for detailed market intelligence report for that stock. |
12Stocks.com Performance of Stocks in Smallcap Index
| Ticker | Stock Name | Watchlist | Category | Recent Price | Smart Investing & Trading Score | Change % | YTD Change% |
| TEX | Terex |   | Industrials | 59.67 | 58 | 0.66 | 3.85% |
| HLIT | Harmonic | | Technology | 12.23 | 69 | 0.66 | -6.21% |
| DX | Dynex Capital | | Financials | 12.25 | 55 | 0.66 | -2.16% |
| KOS | Kosmos Energy | | Energy | 6.10 | 58 | 0.66 | -9.09% |
| HGV | Hilton Grand | | Services & Goods | 41.33 | 17 | 0.66 | 2.86% |
| NWPX | Northwest Pipe | | Materials | 35.54 | 83 | 0.65 | 17.45% |
| HIFS | Hingham Institution | | Financials | 170.90 | 54 | 0.65 | -12.09% |
| STER | Sterling Check | | Technology | 15.38 | 27 | 0.65 | 10.41% |
| PCH | PotlatchDeltic | | Industrials | 42.73 | 45 | 0.64 | -12.97% |
| RYI | Ryerson Holding | | Industrials | 9.45 | 37 | 0.64 | -31.52% |
| OSUR | OraSure | | Health Care | 4.73 | 27 | 0.64 | -42.32% |
| OLP | One Liberty | | Financials | 23.47 | 68 | 0.64 | 7.12% |
| ANGO | AngioDynamics | | Health Care | 6.31 | 95 | 0.64 | -19.52% |
| ROG | Rogers | | Technology | 118.00 | 61 | 0.64 | -10.65% |
| ATRO | Astronics | | Industrials | 20.56 | 68 | 0.64 | 18.03% |
| GRND | Grindr | | Technology | 9.50 | 58 | 0.64 | 6.03% |
| CMTG | Claros Mortgage | | Financials | 7.89 | 25 | 0.64 | -43.14% |
| PRVA | Privia Health | | Health Care | 17.37 | 42 | 0.64 | -26.49% |
| PFS | Provident Financial | | Financials | 14.40 | 20 | 0.63 | -20.13% |
| SHAK | Shake Shack | | Services & Goods | 94.89 | 10 | 0.63 | 28.02% |
| EQC | Equity Commonwealth | | Financials | 19.31 | 86 | 0.63 | 0.57% |
| HTBK | Heritage Commerce | | Financials | 8.15 | 27 | 0.62 | -17.84% |
| ABG | Asbury Automotive | | Services & Goods | 235.07 | 93 | 0.62 | 4.49% |
| COOP | Mr. Cooper | | Financials | 83.40 | 83 | 0.62 | 28.07% |
| WSR | Whitestone REIT | | Financials | 13.04 | 88 | 0.62 | 6.10% |


| Too many stocks? View smallcap stocks filtered by marketcap & sector |
| Marketcap: All SmallCap Stocks (default-no microcap), Large, Mid-Range, Small |
| Smallcap Sector: Tech, Finance, Energy, Staples, Retail, Industrial, Materials, & Medical |
|
Get the most comprehensive stock market coverage daily at 12Stocks.com ➞ Best Stocks Today ➞ Best Stocks Weekly ➞ Best Stocks Year-to-Date ➞ Best Stocks Trends ➞  Best Stocks Today 12Stocks.com Best Nasdaq Stocks ➞ Best S&P 500 Stocks ➞ Best Tech Stocks ➞ Best Biotech Stocks ➞ |
| Detailed Overview of SmallCap Stocks |
| SmallCap Technical Overview, Leaders & Laggards, Top SmallCap ETF Funds & Detailed SmallCap Stocks List, Charts, Trends & More |
| Smallcap: Technical Analysis, Trends & YTD Performance | |
| SmallCap segment as represented by
IWM, an exchange-traded fund [ETF], holds basket of thousands of smallcap stocks from across all major sectors of the US stock market. The smallcap index (contains stocks like Riverbed & Sotheby's) is up by 2.52% and is currently underperforming the overall market by -7.27% year-to-date. Below is a quick view of technical charts and trends: | |
 IWM Weekly Chart |
|
| Long Term Trend: Very Good | |
| Medium Term Trend: Very Good | |
 IWM Daily Chart |
|
| Short Term Trend: Very Good | |
| Overall Trend Score: 86 | |
| YTD Performance: 2.52% | |
| **Trend Scores & Views Are Only For Educational Purposes And Not For Investing | |
| 12Stocks.com: Top Performing Small Cap Index Stocks | ||||||||||||||||||||||||||||||||||||||||||||||||
 The top performing Small Cap Index stocks year to date are
Now, more recently, over last week, the top performing Small Cap Index stocks on the move are


|
||||||||||||||||||||||||||||||||||||||||||||||||
| 12Stocks.com: Investing in Smallcap Index using Exchange Traded Funds | |
|
The following table shows list of key exchange traded funds (ETF) that
help investors track Smallcap index. The following list also includes leveraged ETF funds that track twice or thrice the daily returns of Smallcap indices. Short or inverse ETF funds move in the opposite direction to the index they track and are useful during market pullbacks or during bear markets. Quick View: Move mouse or cursor over ETF symbol (ticker) to view short-term technical chart and over ETF name to view long term chart. Click on ticker or stock name for detailed view. Click on to add stock symbol to your watchlist and to view watchlist. |
12Stocks.com List of ETFs that track Smallcap Index
| Ticker | ETF Name | Watchlist | Recent Price | Smart Investing & Trading Score | Change % | Week % | Year-to-date % |
| IWM | iShares Russell 2000 | | 205.77 | 86 | 0.84 | 0.16 | 2.52% |
| IJR | iShares Core S&P Small-Cap | | 109.65 | 93 | 1.14 | 0.76 | 1.29% |
| IWN | iShares Russell 2000 Value | | 155.88 | 76 | 1.17 | 0.46 | 0.35% |
| IWO | iShares Russell 2000 Growth | | 263.62 | 68 | 0.33 | -0.29 | 4.52% |
| VTWO | Vanguard Russell 2000 ETF | | 82.52 | 51 | -0.08 | -0.66 | 1.75% |
| IJS | iShares S&P Small-Cap 600 Value | | 99.74 | 37 | 0.69 | 0.18 | -3.23% |
| IJT | iShares S&P Small-Cap 600 Growth | | 130.21 | 81 | 0.05 | -0.33 | 4.05% |
| XSLV | PowerShares S&P SmallCap Low Volatil ETF | | 43.66 | 48 | 0.72 | -0.23 | -1.11% |
| SBB | ProShares Short SmallCap600 | | 15.97 | 20 | -0.62 | -0.28 | 0.25% |
| SAA | ProShares Ultra SmallCap600 | | 24.16 | 58 | 0.73 | 0.03 | -3.17% |
| SDD | ProShares UltraShort SmallCap600 | | 18.11 | 17 | -2.53 | -1.36 | -1.72% |
| SMLV | SPDR SSGA US Small Cap Low Volatil ETF | | 110.05 | 55 | 0.89 | -0.16 | -2.2% |
| 12Stocks.com: Charts, Trends, Fundamental Data and Performances of SmallCap Stocks | |
|
We now take in-depth look at all SmallCap stocks including charts, multi-period performances and overall trends (as measured by Smart Investing & Trading Score). One can sort SmallCap stocks (click link to choose) by Daily, Weekly and by Year-to-Date performances. Also, one can sort by size of the company or by market capitalization. |
| Select Your Default Chart Type: | |||||
| |||||
| Click on stock symbol or name for detailed view. Click on to add stock symbol to your watchlist and to view watchlist. Quick View: Move mouse or cursor over "Daily" to quickly view daily technical stock chart and over "Weekly" to view weekly technical stock chart. | |||||

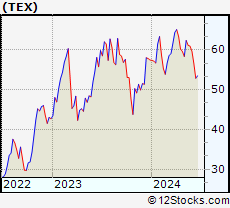 | TEX Terex Corporation |
| Sector: Industrials | |
| SubSector: Farm & Construction Machinery | |
| MarketCap: 1083.07 Millions | |
| Recent Price: 59.67 Smart Investing & Trading Score: 58 | |
| Day Percent Change: 0.66% Day Change: 0.39 | |
| Week Change: -2.13% Year-to-date Change: 3.9% | |
| TEX Links: Profile News Message Board | |
| Charts:- Daily , Weekly | |
| Add TEX to Watchlist: View: Get Complete TEX Trend Analysis ➞ | |
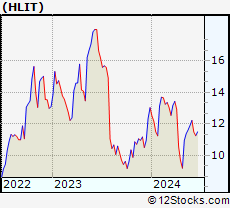 | HLIT Harmonic Inc. |
| Sector: Technology | |
| SubSector: Communication Equipment | |
| MarketCap: 533.539 Millions | |
| Recent Price: 12.23 Smart Investing & Trading Score: 69 | |
| Day Percent Change: 0.66% Day Change: 0.08 | |
| Week Change: 2.69% Year-to-date Change: -6.2% | |
| HLIT Links: Profile News Message Board | |
| Charts:- Daily , Weekly | |
| Add HLIT to Watchlist: View: Get Complete HLIT Trend Analysis ➞ | |
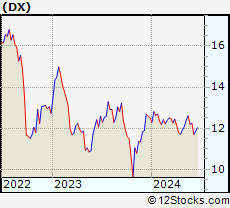 | DX Dynex Capital, Inc. |
| Sector: Financials | |
| SubSector: Mortgage Investment | |
| MarketCap: 327.839 Millions | |
| Recent Price: 12.25 Smart Investing & Trading Score: 55 | |
| Day Percent Change: 0.66% Day Change: 0.08 | |
| Week Change: 0.41% Year-to-date Change: -2.2% | |
| DX Links: Profile News Message Board | |
| Charts:- Daily , Weekly | |
| Add DX to Watchlist: View: Get Complete DX Trend Analysis ➞ | |
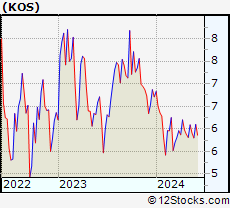 | KOS Kosmos Energy Ltd. |
| Sector: Energy | |
| SubSector: Independent Oil & Gas | |
| MarketCap: 261.693 Millions | |
| Recent Price: 6.10 Smart Investing & Trading Score: 58 | |
| Day Percent Change: 0.66% Day Change: 0.04 | |
| Week Change: 5.17% Year-to-date Change: -9.1% | |
| KOS Links: Profile News Message Board | |
| Charts:- Daily , Weekly | |
| Add KOS to Watchlist: View: Get Complete KOS Trend Analysis ➞ | |
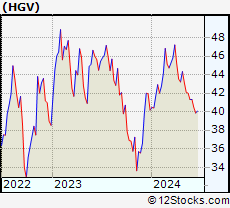 | HGV Hilton Grand Vacations Inc. |
| Sector: Services & Goods | |
| SubSector: Resorts & Casinos | |
| MarketCap: 1333.04 Millions | |
| Recent Price: 41.33 Smart Investing & Trading Score: 17 | |
| Day Percent Change: 0.66% Day Change: 0.27 | |
| Week Change: 0.05% Year-to-date Change: 2.9% | |
| HGV Links: Profile News Message Board | |
| Charts:- Daily , Weekly | |
| Add HGV to Watchlist: View: Get Complete HGV Trend Analysis ➞ | |
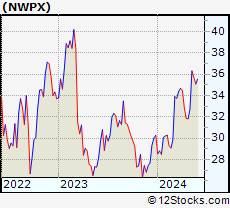 | NWPX Northwest Pipe Company |
| Sector: Materials | |
| SubSector: Steel & Iron | |
| MarketCap: 245.788 Millions | |
| Recent Price: 35.54 Smart Investing & Trading Score: 83 | |
| Day Percent Change: 0.65% Day Change: 0.23 | |
| Week Change: 1.34% Year-to-date Change: 17.5% | |
| NWPX Links: Profile News Message Board | |
| Charts:- Daily , Weekly | |
| Add NWPX to Watchlist: View: Get Complete NWPX Trend Analysis ➞ | |
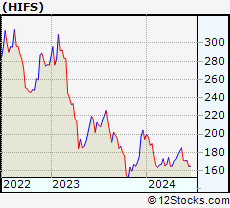 | HIFS Hingham Institution for Savings |
| Sector: Financials | |
| SubSector: Savings & Loans | |
| MarketCap: 341.93 Millions | |
| Recent Price: 170.90 Smart Investing & Trading Score: 54 | |
| Day Percent Change: 0.65% Day Change: 1.10 | |
| Week Change: -0.21% Year-to-date Change: -12.1% | |
| HIFS Links: Profile News Message Board | |
| Charts:- Daily , Weekly | |
| Add HIFS to Watchlist: View: Get Complete HIFS Trend Analysis ➞ | |
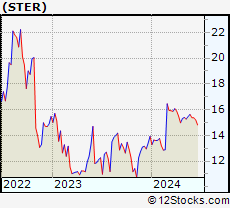 | STER Sterling Check Corp. |
| Sector: Technology | |
| SubSector: Software - Infrastructure | |
| MarketCap: 1180 Millions | |
| Recent Price: 15.38 Smart Investing & Trading Score: 27 | |
| Day Percent Change: 0.65% Day Change: 0.10 | |
| Week Change: -1.6% Year-to-date Change: 10.4% | |
| STER Links: Profile News Message Board | |
| Charts:- Daily , Weekly | |
| Add STER to Watchlist: View: Get Complete STER Trend Analysis ➞ | |
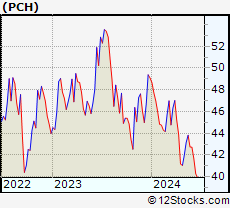 | PCH PotlatchDeltic Corporation |
| Sector: Industrials | |
| SubSector: Lumber, Wood Production | |
| MarketCap: 2314.68 Millions | |
| Recent Price: 42.73 Smart Investing & Trading Score: 45 | |
| Day Percent Change: 0.64% Day Change: 0.27 | |
| Week Change: -0.05% Year-to-date Change: -13.0% | |
| PCH Links: Profile News Message Board | |
| Charts:- Daily , Weekly | |
| Add PCH to Watchlist: View: Get Complete PCH Trend Analysis ➞ | |
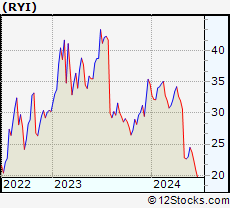 | RYI Ryerson Holding Corporation |
| Sector: Industrials | |
| SubSector: Metal Fabrication | |
| MarketCap: 202.55 Millions | |
| Recent Price: 9.45 Smart Investing & Trading Score: 37 | |
| Day Percent Change: 0.64% Day Change: 0.06 | |
| Week Change: -3.02% Year-to-date Change: -31.5% | |
| RYI Links: Profile News Message Board | |
| Charts:- Daily , Weekly | |
| Add RYI to Watchlist: View: Get Complete RYI Trend Analysis ➞ | |
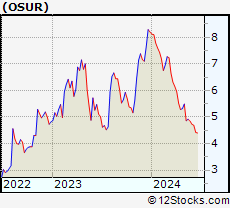 | OSUR OraSure Technologies, Inc. |
| Sector: Health Care | |
| SubSector: Medical Instruments & Supplies | |
| MarketCap: 468.26 Millions | |
| Recent Price: 4.73 Smart Investing & Trading Score: 27 | |
| Day Percent Change: 0.64% Day Change: 0.03 | |
| Week Change: -2.47% Year-to-date Change: -42.3% | |
| OSUR Links: Profile News Message Board | |
| Charts:- Daily , Weekly | |
| Add OSUR to Watchlist: View: Get Complete OSUR Trend Analysis ➞ | |
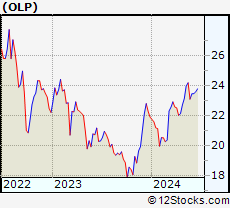 | OLP One Liberty Properties, Inc. |
| Sector: Financials | |
| SubSector: REIT - Diversified | |
| MarketCap: 378.353 Millions | |
| Recent Price: 23.47 Smart Investing & Trading Score: 68 | |
| Day Percent Change: 0.64% Day Change: 0.15 | |
| Week Change: 1.56% Year-to-date Change: 7.1% | |
| OLP Links: Profile News Message Board | |
| Charts:- Daily , Weekly | |
| Add OLP to Watchlist: View: Get Complete OLP Trend Analysis ➞ | |
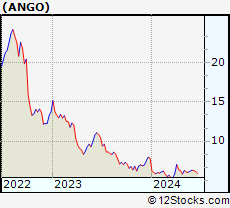 | ANGO AngioDynamics, Inc. |
| Sector: Health Care | |
| SubSector: Medical Instruments & Supplies | |
| MarketCap: 370.86 Millions | |
| Recent Price: 6.31 Smart Investing & Trading Score: 95 | |
| Day Percent Change: 0.64% Day Change: 0.04 | |
| Week Change: 2.27% Year-to-date Change: -19.5% | |
| ANGO Links: Profile News Message Board | |
| Charts:- Daily , Weekly | |
| Add ANGO to Watchlist: View: Get Complete ANGO Trend Analysis ➞ | |
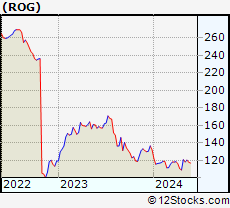 | ROG Rogers Corporation |
| Sector: Technology | |
| SubSector: Diversified Electronics | |
| MarketCap: 1756.36 Millions | |
| Recent Price: 118.00 Smart Investing & Trading Score: 61 | |
| Day Percent Change: 0.64% Day Change: 0.75 | |
| Week Change: 1.13% Year-to-date Change: -10.7% | |
| ROG Links: Profile News Message Board | |
| Charts:- Daily , Weekly | |
| Add ROG to Watchlist: View: Get Complete ROG Trend Analysis ➞ | |
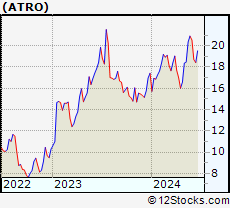 | ATRO Astronics Corporation |
| Sector: Industrials | |
| SubSector: Aerospace/Defense Products & Services | |
| MarketCap: 287.201 Millions | |
| Recent Price: 20.56 Smart Investing & Trading Score: 68 | |
| Day Percent Change: 0.64% Day Change: 0.13 | |
| Week Change: -1.72% Year-to-date Change: 18.0% | |
| ATRO Links: Profile News Message Board | |
| Charts:- Daily , Weekly | |
| Add ATRO to Watchlist: View: Get Complete ATRO Trend Analysis ➞ | |
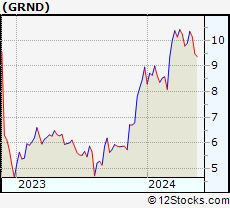 | GRND Grindr Inc. |
| Sector: Technology | |
| SubSector: Software - Application | |
| MarketCap: 929 Millions | |
| Recent Price: 9.50 Smart Investing & Trading Score: 58 | |
| Day Percent Change: 0.64% Day Change: 0.06 | |
| Week Change: 1.82% Year-to-date Change: 6.0% | |
| GRND Links: Profile News Message Board | |
| Charts:- Daily , Weekly | |
| Add GRND to Watchlist: View: Get Complete GRND Trend Analysis ➞ | |
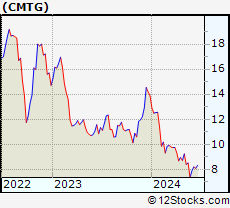 | CMTG Claros Mortgage Trust, Inc. |
| Sector: Financials | |
| SubSector: REIT - Mortgage | |
| MarketCap: 1610 Millions | |
| Recent Price: 7.89 Smart Investing & Trading Score: 25 | |
| Day Percent Change: 0.64% Day Change: 0.05 | |
| Week Change: 7.42% Year-to-date Change: -43.1% | |
| CMTG Links: Profile News Message Board | |
| Charts:- Daily , Weekly | |
| Add CMTG to Watchlist: View: Get Complete CMTG Trend Analysis ➞ | |
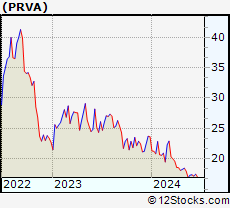 | PRVA Privia Health Group, Inc. |
| Sector: Health Care | |
| SubSector: Health Information Services | |
| MarketCap: 3130 Millions | |
| Recent Price: 17.37 Smart Investing & Trading Score: 42 | |
| Day Percent Change: 0.64% Day Change: 0.11 | |
| Week Change: 0.35% Year-to-date Change: -26.5% | |
| PRVA Links: Profile News Message Board | |
| Charts:- Daily , Weekly | |
| Add PRVA to Watchlist: View: Get Complete PRVA Trend Analysis ➞ | |
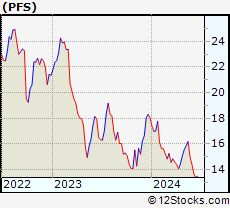 | PFS Provident Financial Services, Inc. |
| Sector: Financials | |
| SubSector: Savings & Loans | |
| MarketCap: 829.73 Millions | |
| Recent Price: 14.40 Smart Investing & Trading Score: 20 | |
| Day Percent Change: 0.63% Day Change: 0.09 | |
| Week Change: -4.06% Year-to-date Change: -20.1% | |
| PFS Links: Profile News Message Board | |
| Charts:- Daily , Weekly | |
| Add PFS to Watchlist: View: Get Complete PFS Trend Analysis ➞ | |
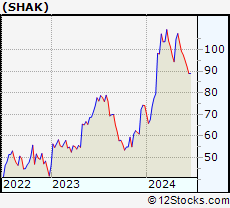 | SHAK Shake Shack Inc. |
| Sector: Services & Goods | |
| SubSector: Specialty Eateries | |
| MarketCap: 1497.67 Millions | |
| Recent Price: 94.89 Smart Investing & Trading Score: 10 | |
| Day Percent Change: 0.63% Day Change: 0.59 | |
| Week Change: -2.69% Year-to-date Change: 28.0% | |
| SHAK Links: Profile News Message Board | |
| Charts:- Daily , Weekly | |
| Add SHAK to Watchlist: View: Get Complete SHAK Trend Analysis ➞ | |
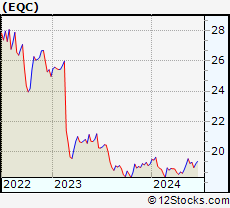 | EQC Equity Commonwealth |
| Sector: Financials | |
| SubSector: REIT - Office | |
| MarketCap: 3659.36 Millions | |
| Recent Price: 19.31 Smart Investing & Trading Score: 86 | |
| Day Percent Change: 0.63% Day Change: 0.12 | |
| Week Change: 0.31% Year-to-date Change: 0.6% | |
| EQC Links: Profile News Message Board | |
| Charts:- Daily , Weekly | |
| Add EQC to Watchlist: View: Get Complete EQC Trend Analysis ➞ | |
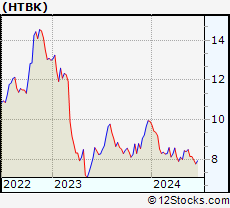 | HTBK Heritage Commerce Corp |
| Sector: Financials | |
| SubSector: Regional - Pacific Banks | |
| MarketCap: 416.129 Millions | |
| Recent Price: 8.15 Smart Investing & Trading Score: 27 | |
| Day Percent Change: 0.62% Day Change: 0.05 | |
| Week Change: 0% Year-to-date Change: -17.8% | |
| HTBK Links: Profile News Message Board | |
| Charts:- Daily , Weekly | |
| Add HTBK to Watchlist: View: Get Complete HTBK Trend Analysis ➞ | |
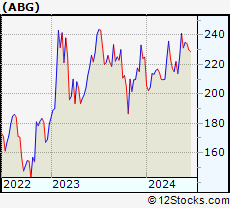 | ABG Asbury Automotive Group, Inc. |
| Sector: Services & Goods | |
| SubSector: Auto Dealerships | |
| MarketCap: 1203.21 Millions | |
| Recent Price: 235.07 Smart Investing & Trading Score: 93 | |
| Day Percent Change: 0.62% Day Change: 1.46 | |
| Week Change: 1.63% Year-to-date Change: 4.5% | |
| ABG Links: Profile News Message Board | |
| Charts:- Daily , Weekly | |
| Add ABG to Watchlist: View: Get Complete ABG Trend Analysis ➞ | |
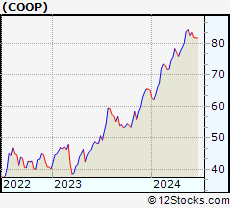 | COOP Mr. Cooper Group Inc. |
| Sector: Financials | |
| SubSector: Savings & Loans | |
| MarketCap: 648.33 Millions | |
| Recent Price: 83.40 Smart Investing & Trading Score: 83 | |
| Day Percent Change: 0.62% Day Change: 0.51 | |
| Week Change: 1.07% Year-to-date Change: 28.1% | |
| COOP Links: Profile News Message Board | |
| Charts:- Daily , Weekly | |
| Add COOP to Watchlist: View: Get Complete COOP Trend Analysis ➞ | |
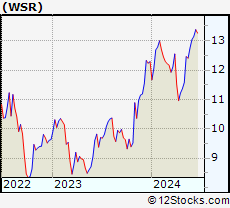 | WSR Whitestone REIT |
| Sector: Financials | |
| SubSector: REIT - Retail | |
| MarketCap: 316.114 Millions | |
| Recent Price: 13.04 Smart Investing & Trading Score: 88 | |
| Day Percent Change: 0.62% Day Change: 0.08 | |
| Week Change: 2.27% Year-to-date Change: 6.1% | |
| WSR Links: Profile News Message Board | |
| Charts:- Daily , Weekly | |
| Add WSR to Watchlist: View: Get Complete WSR Trend Analysis ➞ | |
| Too many stocks? View smallcap stocks filtered by marketcap & sector |
| Marketcap: All SmallCap Stocks (default-no microcap), Large, Mid-Range, Small & MicroCap |
| Sector: Tech, Finance, Energy, Staples, Retail, Industrial, Materials, Utilities & Medical |
|
Best Stocks Today 12Stocks.com |
© 2024 12Stocks.com Terms & Conditions Privacy Contact Us
All Information Provided Only For Education And Not To Be Used For Investing or Trading. See Terms & Conditions


One More Thing ... Get Best Stocks Delivered Daily!
Never Ever Miss A Move With Our Top Ten Stocks Lists
Find Best Stocks In Any Market - Bull or Bear Market
Take A Peek At Our Top Ten Stocks Lists: Daily, Weekly, Year-to-Date & Top Trends
Find Best Stocks In Any Market - Bull or Bear Market
Take A Peek At Our Top Ten Stocks Lists: Daily, Weekly, Year-to-Date & Top Trends
Smallcap Stocks With Best Up Trends [0-bearish to 100-bullish]: Ambarella [100], TPI Composites[100], Hallador Energy[100], Aaron s[100], Sportsman s[100], Heron [100], Federal Signal[100], Newpark Resources[100], Infinera [100], CONSOL Energy[100], Clean Energy[100]
Best Smallcap Stocks Year-to-Date:
CareMax [504.12%], Janux [397.91%], Viking [234.74%], Summit [232.76%], Novavax [213.13%], Longboard [208.84%], Avidity Biosciences[197.12%], Stoke [177.95%], Super Micro[175.98%], Sweetgreen [172.12%], NuScale Power[170.7%] Best Smallcap Stocks This Week:
Summit [156.95%], Insmed [150.23%], Forward Air[36.25%], Ikena Oncology[35.11%], Orchestra BioMed[32%], Credo [30.55%], Arcturus [27.58%], Semler Scientific[25.94%], Hallador Energy[25.72%], Foot Locker[25.65%], CommScope Holding[24.14%] Best Smallcap Stocks Daily:
Ambarella [20.60%], Eyenovia [13.48%], Accuray [12.74%], Slair Broadcast[12.08%], TPI Composites[12.07%], Akoustis [12.04%], Emergent BioSolutions[11.98%], Hallador Energy[11.29%], Aaron s[9.99%], Cogint [9.88%], Trinseo S.A[9.43%]