
 Login Sign Up


| |||||
 |  | ||||

| 12Stocks.com Market Intelligence |
Best SmallCap Stocks
|
| In a hurry? Small Cap Stock Lists: Performance Trends Table, Stock Charts
Sort Small Cap stocks: Daily, Weekly, Year-to-Date, Market Cap & Trends. Filter Small Cap stocks list by sector: Show all, Tech, Finance, Energy, Staples, Retail, Industrial, Materials, Utilities and HealthCare Filter Small Cap stocks list by size: All Large Medium Small and MicroCap |
| 12Stocks.com Small Cap Stocks Performances & Trends Daily | |||||||||
|
|  The overall Smart Investing & Trading Score is 86 (0-bearish to 100-bullish) which puts Small Cap index in short term bullish trend. The Smart Investing & Trading Score from previous trading session is 48 and hence an improvement of trend.
| ||||||||
Here are the Smart Investing & Trading Scores of the most requested small cap stocks at 12Stocks.com (click stock name for detailed review):
|


| 12Stocks.com: Investing in Smallcap Index with Stocks | |
|
The following table helps investors and traders sort through current performance and trends (as measured by Smart Investing & Trading Score) of various
stocks in the Smallcap Index. Quick View: Move mouse or cursor over stock symbol (ticker) to view short-term technical chart and over stock name to view long term chart. Click on  to add stock symbol to your watchlist and to add stock symbol to your watchlist and  to view watchlist. Click on any ticker or stock name for detailed market intelligence report for that stock. to view watchlist. Click on any ticker or stock name for detailed market intelligence report for that stock. |
12Stocks.com Performance of Stocks in Smallcap Index
| Ticker | Stock Name | Watchlist | Category | Recent Price | Smart Investing & Trading Score | Change % | YTD Change% |
| TSBK | Timberland Bancorp |   | Financials | 24.69 | 0 | 1.19 | -21.52% |
| GNE | Genie Energy | | Energy | 15.26 | 42 | 1.19 | -45.75% |
| KMT | Kennametal | | Industrials | 25.75 | 88 | 1.18 | -0.16% |
| CUBI | Customers Bancorp | | Financials | 45.30 | 25 | 1.18 | -21.38% |
| ARDX | Ardelyx | | Health Care | 6.86 | 25 | 1.18 | 10.65% |
| BY | Byline Bancorp | | Financials | 23.10 | 61 | 1.18 | -1.95% |
| NRDY | Nerdy | | Technology | 1.71 | 10 | 1.18 | -50.22% |
| FWRG | First Watch | | Services & Goods | 19.68 | 32 | 1.18 | -1.25% |
| BFS | Saul Centers | | Financials | 36.39 | 53 | 1.17 | -7.33% |
| RHP | Ryman Hospitality | | Financials | 105.07 | 42 | 1.17 | -4.53% |
| SGRY | Surgery Partners | | Health Care | 27.60 | 74 | 1.17 | -13.72% |
| GBTG | Global Business | | Technology | 6.07 | 68 | 1.17 | -7.04% |
| FIZZ | National Beverage | | Consumer Staples | 46.20 | 35 | 1.16 | -7.08% |
| EAT | Brinker | | Services & Goods | 70.63 | 95 | 1.15 | 63.57% |
| EXPO | Exponent | | Services & Goods | 95.12 | 76 | 1.15 | 8.04% |
| GBX | Greenbrier | | Transports | 55.25 | 100 | 1.15 | 25.06% |
| DORM | Dorman Products | | Consumer Staples | 91.97 | 42 | 1.15 | 10.26% |
| DAN | Dana | | Consumer Staples | 14.06 | 93 | 1.15 | -3.76% |
| ALEX | Alexander & Baldwin | | Financials | 16.80 | 86 | 1.14 | -11.67% |
| UCBI | United Community | | Financials | 25.66 | 42 | 1.14 | -12.30% |
| LOCO | El Pollo | | Services & Goods | 10.68 | 88 | 1.14 | 21.09% |
| MLI | Mueller Industries | | Industrials | 58.91 | 83 | 1.13 | 24.94% |
| TRN | Trinity Industries | | Transports | 31.45 | 83 | 1.13 | 18.28% |
| VC | Visteon | | Consumer Staples | 111.37 | 42 | 1.13 | -10.83% |
| AMSF | Amerisafe | | Financials | 43.83 | 25 | 1.13 | -6.31% |


| Too many stocks? View smallcap stocks filtered by marketcap & sector |
| Marketcap: All SmallCap Stocks (default-no microcap), Large, Mid-Range, Small |
| Smallcap Sector: Tech, Finance, Energy, Staples, Retail, Industrial, Materials, & Medical |
|
Get the most comprehensive stock market coverage daily at 12Stocks.com ➞ Best Stocks Today ➞ Best Stocks Weekly ➞ Best Stocks Year-to-Date ➞ Best Stocks Trends ➞  Best Stocks Today 12Stocks.com Best Nasdaq Stocks ➞ Best S&P 500 Stocks ➞ Best Tech Stocks ➞ Best Biotech Stocks ➞ |
| Detailed Overview of SmallCap Stocks |
| SmallCap Technical Overview, Leaders & Laggards, Top SmallCap ETF Funds & Detailed SmallCap Stocks List, Charts, Trends & More |
| Smallcap: Technical Analysis, Trends & YTD Performance | |
| SmallCap segment as represented by
IWM, an exchange-traded fund [ETF], holds basket of thousands of smallcap stocks from across all major sectors of the US stock market. The smallcap index (contains stocks like Riverbed & Sotheby's) is up by 2.52% and is currently underperforming the overall market by -7.27% year-to-date. Below is a quick view of technical charts and trends: | |
 IWM Weekly Chart |
|
| Long Term Trend: Very Good | |
| Medium Term Trend: Very Good | |
 IWM Daily Chart |
|
| Short Term Trend: Very Good | |
| Overall Trend Score: 86 | |
| YTD Performance: 2.52% | |
| **Trend Scores & Views Are Only For Educational Purposes And Not For Investing | |
| 12Stocks.com: Top Performing Small Cap Index Stocks | ||||||||||||||||||||||||||||||||||||||||||||||||
 The top performing Small Cap Index stocks year to date are
Now, more recently, over last week, the top performing Small Cap Index stocks on the move are


|
||||||||||||||||||||||||||||||||||||||||||||||||
| 12Stocks.com: Investing in Smallcap Index using Exchange Traded Funds | |
|
The following table shows list of key exchange traded funds (ETF) that
help investors track Smallcap index. The following list also includes leveraged ETF funds that track twice or thrice the daily returns of Smallcap indices. Short or inverse ETF funds move in the opposite direction to the index they track and are useful during market pullbacks or during bear markets. Quick View: Move mouse or cursor over ETF symbol (ticker) to view short-term technical chart and over ETF name to view long term chart. Click on ticker or stock name for detailed view. Click on to add stock symbol to your watchlist and to view watchlist. |
12Stocks.com List of ETFs that track Smallcap Index
| Ticker | ETF Name | Watchlist | Recent Price | Smart Investing & Trading Score | Change % | Week % | Year-to-date % |
| IWM | iShares Russell 2000 | | 205.77 | 86 | 0.84 | 0.16 | 2.52% |
| IJR | iShares Core S&P Small-Cap | | 109.65 | 93 | 1.14 | 0.76 | 1.29% |
| IWN | iShares Russell 2000 Value | | 155.88 | 76 | 1.17 | 0.46 | 0.35% |
| IWO | iShares Russell 2000 Growth | | 263.62 | 68 | 0.33 | -0.29 | 4.52% |
| VTWO | Vanguard Russell 2000 ETF | | 82.52 | 51 | -0.08 | -0.66 | 1.75% |
| IJS | iShares S&P Small-Cap 600 Value | | 99.74 | 37 | 0.69 | 0.18 | -3.23% |
| IJT | iShares S&P Small-Cap 600 Growth | | 130.21 | 81 | 0.05 | -0.33 | 4.05% |
| XSLV | PowerShares S&P SmallCap Low Volatil ETF | | 43.66 | 48 | 0.72 | -0.23 | -1.11% |
| SBB | ProShares Short SmallCap600 | | 15.97 | 20 | -0.62 | -0.28 | 0.25% |
| SAA | ProShares Ultra SmallCap600 | | 24.16 | 58 | 0.73 | 0.03 | -3.17% |
| SDD | ProShares UltraShort SmallCap600 | | 18.11 | 17 | -2.53 | -1.36 | -1.72% |
| SMLV | SPDR SSGA US Small Cap Low Volatil ETF | | 110.05 | 55 | 0.89 | -0.16 | -2.2% |
| 12Stocks.com: Charts, Trends, Fundamental Data and Performances of SmallCap Stocks | |
|
We now take in-depth look at all SmallCap stocks including charts, multi-period performances and overall trends (as measured by Smart Investing & Trading Score). One can sort SmallCap stocks (click link to choose) by Daily, Weekly and by Year-to-Date performances. Also, one can sort by size of the company or by market capitalization. |
| Select Your Default Chart Type: | |||||
| |||||
| Click on stock symbol or name for detailed view. Click on to add stock symbol to your watchlist and to view watchlist. Quick View: Move mouse or cursor over "Daily" to quickly view daily technical stock chart and over "Weekly" to view weekly technical stock chart. | |||||

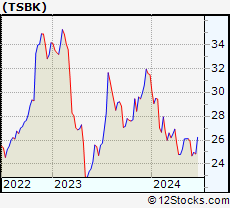 | TSBK Timberland Bancorp, Inc. |
| Sector: Financials | |
| SubSector: Savings & Loans | |
| MarketCap: 155.03 Millions | |
| Recent Price: 24.69 Smart Investing & Trading Score: 0 | |
| Day Percent Change: 1.19% Day Change: 0.29 | |
| Week Change: -4.78% Year-to-date Change: -21.5% | |
| TSBK Links: Profile News Message Board | |
| Charts:- Daily , Weekly | |
| Add TSBK to Watchlist: View: Get Complete TSBK Trend Analysis ➞ | |
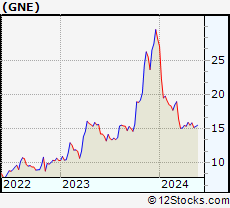 | GNE Genie Energy Ltd. |
| Sector: Energy | |
| SubSector: Independent Oil & Gas | |
| MarketCap: 177.293 Millions | |
| Recent Price: 15.26 Smart Investing & Trading Score: 42 | |
| Day Percent Change: 1.19% Day Change: 0.18 | |
| Week Change: -1.61% Year-to-date Change: -45.8% | |
| GNE Links: Profile News Message Board | |
| Charts:- Daily , Weekly | |
| Add GNE to Watchlist: View: Get Complete GNE Trend Analysis ➞ | |
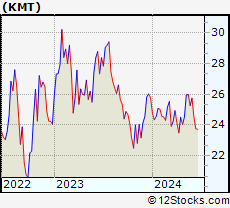 | KMT Kennametal Inc. |
| Sector: Industrials | |
| SubSector: Machine Tools & Accessories | |
| MarketCap: 1486.48 Millions | |
| Recent Price: 25.75 Smart Investing & Trading Score: 88 | |
| Day Percent Change: 1.18% Day Change: 0.30 | |
| Week Change: 1.9% Year-to-date Change: -0.2% | |
| KMT Links: Profile News Message Board | |
| Charts:- Daily , Weekly | |
| Add KMT to Watchlist: View: Get Complete KMT Trend Analysis ➞ | |
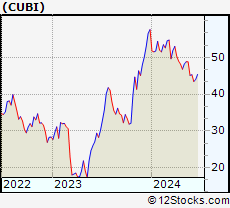 | CUBI Customers Bancorp, Inc. |
| Sector: Financials | |
| SubSector: Regional - Northeast Banks | |
| MarketCap: 385.399 Millions | |
| Recent Price: 45.30 Smart Investing & Trading Score: 25 | |
| Day Percent Change: 1.18% Day Change: 0.53 | |
| Week Change: 0.29% Year-to-date Change: -21.4% | |
| CUBI Links: Profile News Message Board | |
| Charts:- Daily , Weekly | |
| Add CUBI to Watchlist: View: Get Complete CUBI Trend Analysis ➞ | |
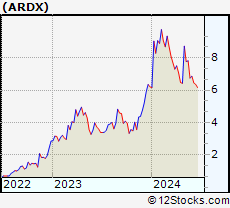 | ARDX Ardelyx, Inc. |
| Sector: Health Care | |
| SubSector: Biotechnology | |
| MarketCap: 541.985 Millions | |
| Recent Price: 6.86 Smart Investing & Trading Score: 25 | |
| Day Percent Change: 1.18% Day Change: 0.08 | |
| Week Change: 1.63% Year-to-date Change: 10.7% | |
| ARDX Links: Profile News Message Board | |
| Charts:- Daily , Weekly | |
| Add ARDX to Watchlist: View: Get Complete ARDX Trend Analysis ➞ | |
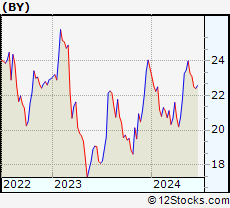 | BY Byline Bancorp, Inc. |
| Sector: Financials | |
| SubSector: Regional - Midwest Banks | |
| MarketCap: 381.87 Millions | |
| Recent Price: 23.10 Smart Investing & Trading Score: 61 | |
| Day Percent Change: 1.18% Day Change: 0.27 | |
| Week Change: -0.77% Year-to-date Change: -2.0% | |
| BY Links: Profile News Message Board | |
| Charts:- Daily , Weekly | |
| Add BY to Watchlist: View: Get Complete BY Trend Analysis ➞ | |
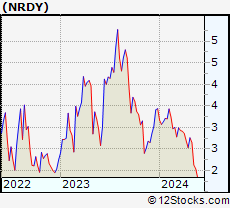 | NRDY Nerdy, Inc. |
| Sector: Technology | |
| SubSector: Software - Application | |
| MarketCap: 683 Millions | |
| Recent Price: 1.71 Smart Investing & Trading Score: 10 | |
| Day Percent Change: 1.18% Day Change: 0.02 | |
| Week Change: -6.81% Year-to-date Change: -50.2% | |
| NRDY Links: Profile News Message Board | |
| Charts:- Daily , Weekly | |
| Add NRDY to Watchlist: View: Get Complete NRDY Trend Analysis ➞ | |
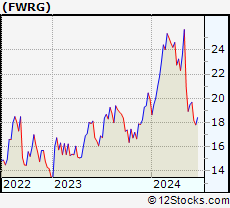 | FWRG First Watch Restaurant Group, Inc. |
| Sector: Services & Goods | |
| SubSector: Restaurants | |
| MarketCap: 1000 Millions | |
| Recent Price: 19.68 Smart Investing & Trading Score: 32 | |
| Day Percent Change: 1.18% Day Change: 0.23 | |
| Week Change: 0.92% Year-to-date Change: -1.3% | |
| FWRG Links: Profile News Message Board | |
| Charts:- Daily , Weekly | |
| Add FWRG to Watchlist: View: Get Complete FWRG Trend Analysis ➞ | |
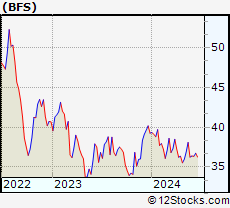 | BFS Saul Centers, Inc. |
| Sector: Financials | |
| SubSector: REIT - Retail | |
| MarketCap: 689.914 Millions | |
| Recent Price: 36.39 Smart Investing & Trading Score: 53 | |
| Day Percent Change: 1.17% Day Change: 0.42 | |
| Week Change: 0.39% Year-to-date Change: -7.3% | |
| BFS Links: Profile News Message Board | |
| Charts:- Daily , Weekly | |
| Add BFS to Watchlist: View: Get Complete BFS Trend Analysis ➞ | |
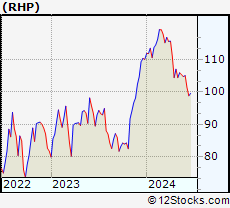 | RHP Ryman Hospitality Properties, Inc. |
| Sector: Financials | |
| SubSector: REIT - Hotel/Motel | |
| MarketCap: 1519.74 Millions | |
| Recent Price: 105.07 Smart Investing & Trading Score: 42 | |
| Day Percent Change: 1.17% Day Change: 1.21 | |
| Week Change: 0.31% Year-to-date Change: -4.5% | |
| RHP Links: Profile News Message Board | |
| Charts:- Daily , Weekly | |
| Add RHP to Watchlist: View: Get Complete RHP Trend Analysis ➞ | |
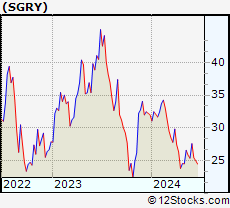 | SGRY Surgery Partners, Inc. |
| Sector: Health Care | |
| SubSector: Hospitals | |
| MarketCap: 328.446 Millions | |
| Recent Price: 27.60 Smart Investing & Trading Score: 74 | |
| Day Percent Change: 1.17% Day Change: 0.32 | |
| Week Change: 8.7% Year-to-date Change: -13.7% | |
| SGRY Links: Profile News Message Board | |
| Charts:- Daily , Weekly | |
| Add SGRY to Watchlist: View: Get Complete SGRY Trend Analysis ➞ | |
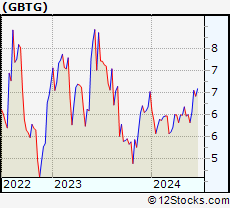 | GBTG Global Business Travel Group, Inc. |
| Sector: Technology | |
| SubSector: Software - Application | |
| MarketCap: 3440 Millions | |
| Recent Price: 6.07 Smart Investing & Trading Score: 68 | |
| Day Percent Change: 1.17% Day Change: 0.07 | |
| Week Change: 4.12% Year-to-date Change: -7.0% | |
| GBTG Links: Profile News Message Board | |
| Charts:- Daily , Weekly | |
| Add GBTG to Watchlist: View: Get Complete GBTG Trend Analysis ➞ | |
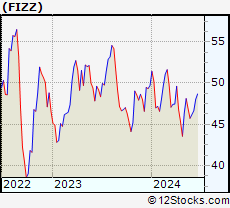 | FIZZ National Beverage Corp. |
| Sector: Consumer Staples | |
| SubSector: Beverages - Soft Drinks | |
| MarketCap: 2031.4 Millions | |
| Recent Price: 46.20 Smart Investing & Trading Score: 35 | |
| Day Percent Change: 1.16% Day Change: 0.53 | |
| Week Change: 1.03% Year-to-date Change: -7.1% | |
| FIZZ Links: Profile News Message Board | |
| Charts:- Daily , Weekly | |
| Add FIZZ to Watchlist: View: Get Complete FIZZ Trend Analysis ➞ | |
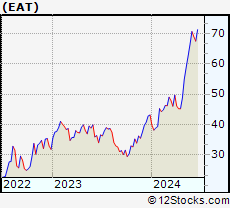 | EAT Brinker International, Inc. |
| Sector: Services & Goods | |
| SubSector: Restaurants | |
| MarketCap: 435.97 Millions | |
| Recent Price: 70.63 Smart Investing & Trading Score: 95 | |
| Day Percent Change: 1.15% Day Change: 0.80 | |
| Week Change: 6.5% Year-to-date Change: 63.6% | |
| EAT Links: Profile News Message Board | |
| Charts:- Daily , Weekly | |
| Add EAT to Watchlist: View: Get Complete EAT Trend Analysis ➞ | |
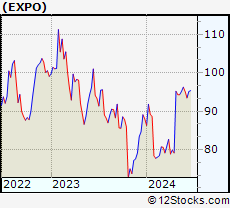 | EXPO Exponent, Inc. |
| Sector: Services & Goods | |
| SubSector: Management Services | |
| MarketCap: 3605.95 Millions | |
| Recent Price: 95.12 Smart Investing & Trading Score: 76 | |
| Day Percent Change: 1.15% Day Change: 1.08 | |
| Week Change: -1.2% Year-to-date Change: 8.0% | |
| EXPO Links: Profile News Message Board | |
| Charts:- Daily , Weekly | |
| Add EXPO to Watchlist: View: Get Complete EXPO Trend Analysis ➞ | |
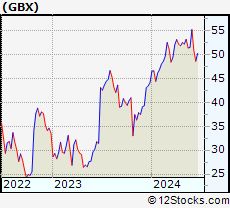 | GBX The Greenbrier Companies, Inc. |
| Sector: Transports | |
| SubSector: Railroads | |
| MarketCap: 511.022 Millions | |
| Recent Price: 55.25 Smart Investing & Trading Score: 100 | |
| Day Percent Change: 1.15% Day Change: 0.63 | |
| Week Change: 7.24% Year-to-date Change: 25.1% | |
| GBX Links: Profile News Message Board | |
| Charts:- Daily , Weekly | |
| Add GBX to Watchlist: View: Get Complete GBX Trend Analysis ➞ | |
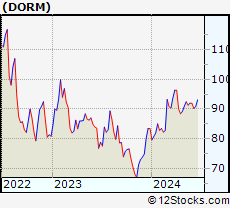 | DORM Dorman Products, Inc. |
| Sector: Consumer Staples | |
| SubSector: Auto Parts | |
| MarketCap: 2028.79 Millions | |
| Recent Price: 91.97 Smart Investing & Trading Score: 42 | |
| Day Percent Change: 1.15% Day Change: 1.05 | |
| Week Change: -0.03% Year-to-date Change: 10.3% | |
| DORM Links: Profile News Message Board | |
| Charts:- Daily , Weekly | |
| Add DORM to Watchlist: View: Get Complete DORM Trend Analysis ➞ | |
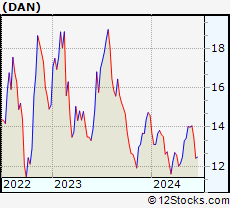 | DAN Dana Incorporated |
| Sector: Consumer Staples | |
| SubSector: Auto Parts | |
| MarketCap: 1052.59 Millions | |
| Recent Price: 14.06 Smart Investing & Trading Score: 93 | |
| Day Percent Change: 1.15% Day Change: 0.16 | |
| Week Change: 0.43% Year-to-date Change: -3.8% | |
| DAN Links: Profile News Message Board | |
| Charts:- Daily , Weekly | |
| Add DAN to Watchlist: View: Get Complete DAN Trend Analysis ➞ | |
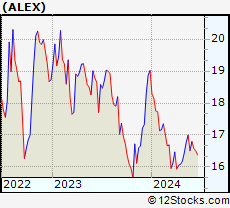 | ALEX Alexander & Baldwin, Inc. |
| Sector: Financials | |
| SubSector: Real Estate Development | |
| MarketCap: 751.419 Millions | |
| Recent Price: 16.80 Smart Investing & Trading Score: 86 | |
| Day Percent Change: 1.14% Day Change: 0.19 | |
| Week Change: 1.76% Year-to-date Change: -11.7% | |
| ALEX Links: Profile News Message Board | |
| Charts:- Daily , Weekly | |
| Add ALEX to Watchlist: View: Get Complete ALEX Trend Analysis ➞ | |
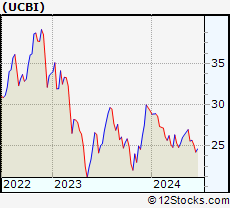 | UCBI United Community Banks, Inc. |
| Sector: Financials | |
| SubSector: Regional - Mid-Atlantic Banks | |
| MarketCap: 1593.99 Millions | |
| Recent Price: 25.66 Smart Investing & Trading Score: 42 | |
| Day Percent Change: 1.14% Day Change: 0.29 | |
| Week Change: 0.35% Year-to-date Change: -12.3% | |
| UCBI Links: Profile News Message Board | |
| Charts:- Daily , Weekly | |
| Add UCBI to Watchlist: View: Get Complete UCBI Trend Analysis ➞ | |
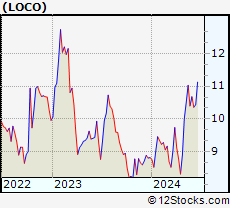 | LOCO El Pollo Loco Holdings, Inc. |
| Sector: Services & Goods | |
| SubSector: Restaurants | |
| MarketCap: 296.97 Millions | |
| Recent Price: 10.68 Smart Investing & Trading Score: 88 | |
| Day Percent Change: 1.14% Day Change: 0.12 | |
| Week Change: 2.69% Year-to-date Change: 21.1% | |
| LOCO Links: Profile News Message Board | |
| Charts:- Daily , Weekly | |
| Add LOCO to Watchlist: View: Get Complete LOCO Trend Analysis ➞ | |
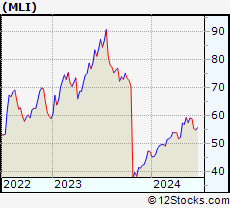 | MLI Mueller Industries, Inc. |
| Sector: Industrials | |
| SubSector: Metal Fabrication | |
| MarketCap: 1259.5 Millions | |
| Recent Price: 58.91 Smart Investing & Trading Score: 83 | |
| Day Percent Change: 1.13% Day Change: 0.66 | |
| Week Change: -0.32% Year-to-date Change: 24.9% | |
| MLI Links: Profile News Message Board | |
| Charts:- Daily , Weekly | |
| Add MLI to Watchlist: View: Get Complete MLI Trend Analysis ➞ | |
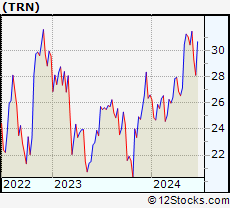 | TRN Trinity Industries, Inc. |
| Sector: Transports | |
| SubSector: Railroads | |
| MarketCap: 2058.22 Millions | |
| Recent Price: 31.45 Smart Investing & Trading Score: 83 | |
| Day Percent Change: 1.13% Day Change: 0.35 | |
| Week Change: 3.39% Year-to-date Change: 18.3% | |
| TRN Links: Profile News Message Board | |
| Charts:- Daily , Weekly | |
| Add TRN to Watchlist: View: Get Complete TRN Trend Analysis ➞ | |
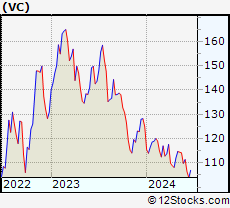 | VC Visteon Corporation |
| Sector: Consumer Staples | |
| SubSector: Auto Parts | |
| MarketCap: 1441.49 Millions | |
| Recent Price: 111.37 Smart Investing & Trading Score: 42 | |
| Day Percent Change: 1.13% Day Change: 1.24 | |
| Week Change: 1.39% Year-to-date Change: -10.8% | |
| VC Links: Profile News Message Board | |
| Charts:- Daily , Weekly | |
| Add VC to Watchlist: View: Get Complete VC Trend Analysis ➞ | |
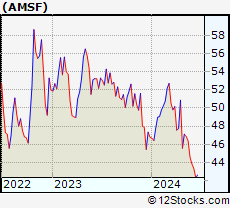 | AMSF Amerisafe, Inc. |
| Sector: Financials | |
| SubSector: Property & Casualty Insurance | |
| MarketCap: 1159.32 Millions | |
| Recent Price: 43.83 Smart Investing & Trading Score: 25 | |
| Day Percent Change: 1.13% Day Change: 0.49 | |
| Week Change: -1.7% Year-to-date Change: -6.3% | |
| AMSF Links: Profile News Message Board | |
| Charts:- Daily , Weekly | |
| Add AMSF to Watchlist: View: Get Complete AMSF Trend Analysis ➞ | |
| Too many stocks? View smallcap stocks filtered by marketcap & sector |
| Marketcap: All SmallCap Stocks (default-no microcap), Large, Mid-Range, Small & MicroCap |
| Sector: Tech, Finance, Energy, Staples, Retail, Industrial, Materials, Utilities & Medical |
|
Best Stocks Today 12Stocks.com |
© 2024 12Stocks.com Terms & Conditions Privacy Contact Us
All Information Provided Only For Education And Not To Be Used For Investing or Trading. See Terms & Conditions


One More Thing ... Get Best Stocks Delivered Daily!
Never Ever Miss A Move With Our Top Ten Stocks Lists
Find Best Stocks In Any Market - Bull or Bear Market
Take A Peek At Our Top Ten Stocks Lists: Daily, Weekly, Year-to-Date & Top Trends
Find Best Stocks In Any Market - Bull or Bear Market
Take A Peek At Our Top Ten Stocks Lists: Daily, Weekly, Year-to-Date & Top Trends
Smallcap Stocks With Best Up Trends [0-bearish to 100-bullish]: Ambarella [100], TPI Composites[100], Hallador Energy[100], Aaron s[100], Sportsman s[100], Heron [100], Federal Signal[100], Newpark Resources[100], Infinera [100], CONSOL Energy[100], Clean Energy[100]
Best Smallcap Stocks Year-to-Date:
CareMax [504.12%], Janux [397.91%], Viking [234.74%], Summit [232.76%], Novavax [213.13%], Longboard [208.84%], Avidity Biosciences[197.12%], Stoke [177.95%], Super Micro[175.98%], Sweetgreen [172.12%], NuScale Power[170.7%] Best Smallcap Stocks This Week:
Summit [156.95%], Insmed [150.23%], Forward Air[36.25%], Ikena Oncology[35.11%], Orchestra BioMed[32%], Credo [30.55%], Arcturus [27.58%], Semler Scientific[25.94%], Hallador Energy[25.72%], Foot Locker[25.65%], CommScope Holding[24.14%] Best Smallcap Stocks Daily:
Ambarella [20.60%], Eyenovia [13.48%], Accuray [12.74%], Slair Broadcast[12.08%], TPI Composites[12.07%], Akoustis [12.04%], Emergent BioSolutions[11.98%], Hallador Energy[11.29%], Aaron s[9.99%], Cogint [9.88%], Trinseo S.A[9.43%]