
 Login Sign Up


| |||||
 |  | ||||

| 12Stocks.com Market Intelligence |
Best SmallCap Stocks
|
| In a hurry? Small Cap Stock Lists: Performance Trends Table, Stock Charts
Sort Small Cap stocks: Daily, Weekly, Year-to-Date, Market Cap & Trends. Filter Small Cap stocks list by sector: Show all, Tech, Finance, Energy, Staples, Retail, Industrial, Materials, Utilities and HealthCare Filter Small Cap stocks list by size: All Large Medium Small and MicroCap |
| 12Stocks.com Small Cap Stocks Performances & Trends Daily | |||||||||
|
|  The overall Smart Investing & Trading Score is 86 (0-bearish to 100-bullish) which puts Small Cap index in short term bullish trend. The Smart Investing & Trading Score from previous trading session is 48 and hence an improvement of trend.
| ||||||||
Here are the Smart Investing & Trading Scores of the most requested small cap stocks at 12Stocks.com (click stock name for detailed review):
|


| 12Stocks.com: Investing in Smallcap Index with Stocks | |
|
The following table helps investors and traders sort through current performance and trends (as measured by Smart Investing & Trading Score) of various
stocks in the Smallcap Index. Quick View: Move mouse or cursor over stock symbol (ticker) to view short-term technical chart and over stock name to view long term chart. Click on  to add stock symbol to your watchlist and to add stock symbol to your watchlist and  to view watchlist. Click on any ticker or stock name for detailed market intelligence report for that stock. to view watchlist. Click on any ticker or stock name for detailed market intelligence report for that stock. |
12Stocks.com Performance of Stocks in Smallcap Index
| Ticker | Stock Name | Watchlist | Category | Recent Price | Smart Investing & Trading Score | Change % | YTD Change% |
| COOP | Mr. Cooper |   | Financials | 83.40 | 83 | 0.62% | 28.07% |
| VHI | Valhi | | Materials | 19.45 | 61 | 4.07% | 28.04% |
| SHAK | Shake Shack | | Services & Goods | 94.89 | 10 | 0.63% | 28.02% |
| PCT | PureCycle | | Industrials | 5.19 | 47 | -2.26% | 27.99% |
| OCUL | Ocular Therapeutix | | Health Care | 5.70 | 10 | -1.72% | 27.80% |
| NR | Newpark Resources | | Energy | 8.48 | 100 | 5.34% | 27.71% |
| TILE | Interface | | Industrials | 16.11 | 65 | -0.43% | 27.65% |
| SGHT | Sight Sciences | | Health Care | 6.56 | 100 | 0.61% | 27.01% |
| SFL | SFL | | Transports | 14.31 | 93 | 0.35% | 26.86% |
| VSEC | VSE | | Services & Goods | 81.86 | 70 | 1.90% | 26.70% |
| CYH | Community Health | | Health Care | 3.96 | 100 | 2.59% | 26.52% |
| EPAC | Enerpac Tool | | Industrials | 39.32 | 100 | 1.42% | 26.47% |
| KYMR | Kymera | | Health Care | 32.11 | 10 | -0.16% | 26.37% |
| UTI | Universal Technical | | Services & Goods | 15.81 | 58 | -1.50% | 26.28% |
| FN | Fabrinet | | Technology | 239.53 | 68 | -2.76% | 25.85% |
| WRBY | Warby Parker | | Health Care | 17.71 | 90 | 1.55% | 25.56% |
| AMRK | A-Mark Precious | | Financials | 37.93 | 46 | -0.18% | 25.39% |
| GBX | Greenbrier | | Transports | 55.25 | 100 | 1.15% | 25.06% |
| PWP | Perella Weinberg | | Financials | 15.44 | 46 | 0.19% | 25.02% |
| BMI | Badger Meter | | Technology | 192.96 | 68 | 0.42% | 25.00% |
| SCVL | Shoe Carnival | | Services & Goods | 37.75 | 95 | -0.92% | 24.96% |
| MLI | Mueller Industries | | Industrials | 58.91 | 83 | 1.13% | 24.94% |
| CRNX | Crinetics | | Health Care | 44.41 | 26 | -2.12% | 24.82% |
| TPB | Turning Point | | Consumer Staples | 32.81 | 61 | 1.11% | 24.66% |
| MCBC | Macatawa Bank | | Financials | 14.06 | 61 | 0.29% | 24.65% |


| Too many stocks? View smallcap stocks filtered by marketcap & sector |
| Marketcap: All SmallCap Stocks (default-no microcap), Large, Mid-Range, Small |
| Smallcap Sector: Tech, Finance, Energy, Staples, Retail, Industrial, Materials, & Medical |
|
Get the most comprehensive stock market coverage daily at 12Stocks.com ➞ Best Stocks Today ➞ Best Stocks Weekly ➞ Best Stocks Year-to-Date ➞ Best Stocks Trends ➞  Best Stocks Today 12Stocks.com Best Nasdaq Stocks ➞ Best S&P 500 Stocks ➞ Best Tech Stocks ➞ Best Biotech Stocks ➞ |
| Detailed Overview of SmallCap Stocks |
| SmallCap Technical Overview, Leaders & Laggards, Top SmallCap ETF Funds & Detailed SmallCap Stocks List, Charts, Trends & More |
| Smallcap: Technical Analysis, Trends & YTD Performance | |
| SmallCap segment as represented by
IWM, an exchange-traded fund [ETF], holds basket of thousands of smallcap stocks from across all major sectors of the US stock market. The smallcap index (contains stocks like Riverbed & Sotheby's) is up by 2.52% and is currently underperforming the overall market by -7.27% year-to-date. Below is a quick view of technical charts and trends: | |
 IWM Weekly Chart |
|
| Long Term Trend: Very Good | |
| Medium Term Trend: Very Good | |
 IWM Daily Chart |
|
| Short Term Trend: Very Good | |
| Overall Trend Score: 86 | |
| YTD Performance: 2.52% | |
| **Trend Scores & Views Are Only For Educational Purposes And Not For Investing | |
| 12Stocks.com: Top Performing Small Cap Index Stocks | ||||||||||||||||||||||||||||||||||||||||||||||||
 The top performing Small Cap Index stocks year to date are
Now, more recently, over last week, the top performing Small Cap Index stocks on the move are


|
||||||||||||||||||||||||||||||||||||||||||||||||
| 12Stocks.com: Investing in Smallcap Index using Exchange Traded Funds | |
|
The following table shows list of key exchange traded funds (ETF) that
help investors track Smallcap index. The following list also includes leveraged ETF funds that track twice or thrice the daily returns of Smallcap indices. Short or inverse ETF funds move in the opposite direction to the index they track and are useful during market pullbacks or during bear markets. Quick View: Move mouse or cursor over ETF symbol (ticker) to view short-term technical chart and over ETF name to view long term chart. Click on ticker or stock name for detailed view. Click on to add stock symbol to your watchlist and to view watchlist. |
12Stocks.com List of ETFs that track Smallcap Index
| Ticker | ETF Name | Watchlist | Recent Price | Smart Investing & Trading Score | Change % | Week % | Year-to-date % |
| IWM | iShares Russell 2000 | | 205.77 | 86 | 0.84 | 0.16 | 2.52% |
| IJR | iShares Core S&P Small-Cap | | 109.65 | 93 | 1.14 | 0.76 | 1.29% |
| IWN | iShares Russell 2000 Value | | 155.88 | 76 | 1.17 | 0.46 | 0.35% |
| IWO | iShares Russell 2000 Growth | | 263.62 | 68 | 0.33 | -0.29 | 4.52% |
| VTWO | Vanguard Russell 2000 ETF | | 82.52 | 51 | -0.08 | -0.66 | 1.75% |
| IJS | iShares S&P Small-Cap 600 Value | | 99.74 | 37 | 0.69 | 0.18 | -3.23% |
| IJT | iShares S&P Small-Cap 600 Growth | | 130.21 | 81 | 0.05 | -0.33 | 4.05% |
| XSLV | PowerShares S&P SmallCap Low Volatil ETF | | 43.66 | 48 | 0.72 | -0.23 | -1.11% |
| SBB | ProShares Short SmallCap600 | | 15.97 | 20 | -0.62 | -0.28 | 0.25% |
| SAA | ProShares Ultra SmallCap600 | | 24.16 | 58 | 0.73 | 0.03 | -3.17% |
| SDD | ProShares UltraShort SmallCap600 | | 18.11 | 17 | -2.53 | -1.36 | -1.72% |
| SMLV | SPDR SSGA US Small Cap Low Volatil ETF | | 110.05 | 55 | 0.89 | -0.16 | -2.2% |
| 12Stocks.com: Charts, Trends, Fundamental Data and Performances of SmallCap Stocks | |
|
We now take in-depth look at all SmallCap stocks including charts, multi-period performances and overall trends (as measured by Smart Investing & Trading Score). One can sort SmallCap stocks (click link to choose) by Daily, Weekly and by Year-to-Date performances. Also, one can sort by size of the company or by market capitalization. |
| Select Your Default Chart Type: | |||||
| |||||
| Click on stock symbol or name for detailed view. Click on to add stock symbol to your watchlist and to view watchlist. Quick View: Move mouse or cursor over "Daily" to quickly view daily technical stock chart and over "Weekly" to view weekly technical stock chart. | |||||

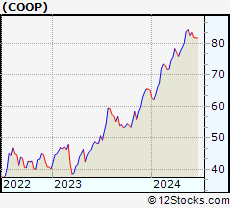 | COOP Mr. Cooper Group Inc. |
| Sector: Financials | |
| SubSector: Savings & Loans | |
| MarketCap: 648.33 Millions | |
| Recent Price: 83.40 Smart Investing & Trading Score: 83 | |
| Day Percent Change: 0.62% Day Change: 0.51 | |
| Week Change: 1.07% Year-to-date Change: 28.1% | |
| COOP Links: Profile News Message Board | |
| Charts:- Daily , Weekly | |
| Add COOP to Watchlist: View: Get Complete COOP Trend Analysis ➞ | |
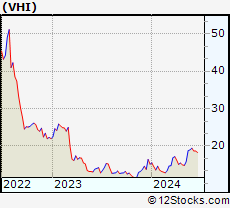 | VHI Valhi, Inc. |
| Sector: Materials | |
| SubSector: Chemicals - Major Diversified | |
| MarketCap: 394.336 Millions | |
| Recent Price: 19.45 Smart Investing & Trading Score: 61 | |
| Day Percent Change: 4.07% Day Change: 0.76 | |
| Week Change: 2.31% Year-to-date Change: 28.0% | |
| VHI Links: Profile News Message Board | |
| Charts:- Daily , Weekly | |
| Add VHI to Watchlist: View: Get Complete VHI Trend Analysis ➞ | |
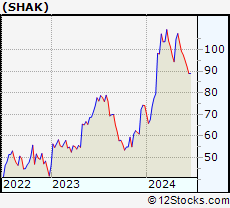 | SHAK Shake Shack Inc. |
| Sector: Services & Goods | |
| SubSector: Specialty Eateries | |
| MarketCap: 1497.67 Millions | |
| Recent Price: 94.89 Smart Investing & Trading Score: 10 | |
| Day Percent Change: 0.63% Day Change: 0.59 | |
| Week Change: -2.69% Year-to-date Change: 28.0% | |
| SHAK Links: Profile News Message Board | |
| Charts:- Daily , Weekly | |
| Add SHAK to Watchlist: View: Get Complete SHAK Trend Analysis ➞ | |
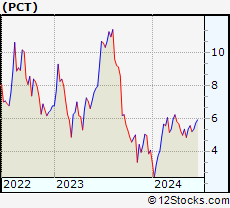 | PCT PureCycle Technologies, Inc. |
| Sector: Industrials | |
| SubSector: Pollution & Treatment Controls | |
| MarketCap: 1610 Millions | |
| Recent Price: 5.19 Smart Investing & Trading Score: 47 | |
| Day Percent Change: -2.26% Day Change: -0.12 | |
| Week Change: -6.57% Year-to-date Change: 28.0% | |
| PCT Links: Profile News Message Board | |
| Charts:- Daily , Weekly | |
| Add PCT to Watchlist: View: Get Complete PCT Trend Analysis ➞ | |
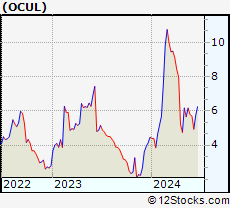 | OCUL Ocular Therapeutix, Inc. |
| Sector: Health Care | |
| SubSector: Biotechnology | |
| MarketCap: 249.985 Millions | |
| Recent Price: 5.70 Smart Investing & Trading Score: 10 | |
| Day Percent Change: -1.72% Day Change: -0.10 | |
| Week Change: -1.64% Year-to-date Change: 27.8% | |
| OCUL Links: Profile News Message Board | |
| Charts:- Daily , Weekly | |
| Add OCUL to Watchlist: View: Get Complete OCUL Trend Analysis ➞ | |
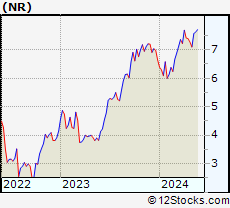 | NR Newpark Resources, Inc. |
| Sector: Energy | |
| SubSector: Oil & Gas Equipment & Services | |
| MarketCap: 109.261 Millions | |
| Recent Price: 8.48 Smart Investing & Trading Score: 100 | |
| Day Percent Change: 5.34% Day Change: 0.43 | |
| Week Change: 9.99% Year-to-date Change: 27.7% | |
| NR Links: Profile News Message Board | |
| Charts:- Daily , Weekly | |
| Add NR to Watchlist: View: Get Complete NR Trend Analysis ➞ | |
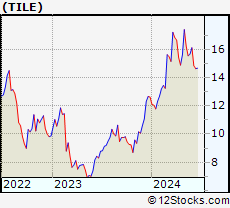 | TILE Interface, Inc. |
| Sector: Industrials | |
| SubSector: Textile Industrial | |
| MarketCap: 478 Millions | |
| Recent Price: 16.11 Smart Investing & Trading Score: 65 | |
| Day Percent Change: -0.43% Day Change: -0.07 | |
| Week Change: 2.87% Year-to-date Change: 27.7% | |
| TILE Links: Profile News Message Board | |
| Charts:- Daily , Weekly | |
| Add TILE to Watchlist: View: Get Complete TILE Trend Analysis ➞ | |
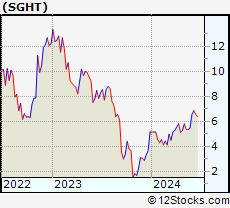 | SGHT Sight Sciences, Inc. |
| Sector: Health Care | |
| SubSector: Medical Devices | |
| MarketCap: 381 Millions | |
| Recent Price: 6.56 Smart Investing & Trading Score: 100 | |
| Day Percent Change: 0.61% Day Change: 0.04 | |
| Week Change: 20.04% Year-to-date Change: 27.0% | |
| SGHT Links: Profile News Message Board | |
| Charts:- Daily , Weekly | |
| Add SGHT to Watchlist: View: Get Complete SGHT Trend Analysis ➞ | |
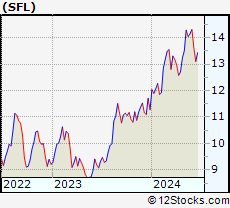 | SFL SFL Corporation Ltd. |
| Sector: Transports | |
| SubSector: Shipping | |
| MarketCap: 890.414 Millions | |
| Recent Price: 14.31 Smart Investing & Trading Score: 93 | |
| Day Percent Change: 0.35% Day Change: 0.05 | |
| Week Change: 1.13% Year-to-date Change: 26.9% | |
| SFL Links: Profile News Message Board | |
| Charts:- Daily , Weekly | |
| Add SFL to Watchlist: View: Get Complete SFL Trend Analysis ➞ | |
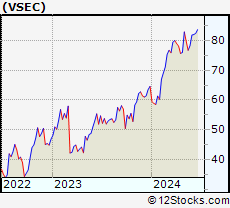 | VSEC VSE Corporation |
| Sector: Services & Goods | |
| SubSector: Technical Services | |
| MarketCap: 183.61 Millions | |
| Recent Price: 81.86 Smart Investing & Trading Score: 70 | |
| Day Percent Change: 1.90% Day Change: 1.53 | |
| Week Change: 4.61% Year-to-date Change: 26.7% | |
| VSEC Links: Profile News Message Board | |
| Charts:- Daily , Weekly | |
| Add VSEC to Watchlist: View: Get Complete VSEC Trend Analysis ➞ | |
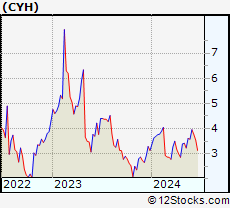 | CYH Community Health Systems, Inc. |
| Sector: Health Care | |
| SubSector: Hospitals | |
| MarketCap: 371.546 Millions | |
| Recent Price: 3.96 Smart Investing & Trading Score: 100 | |
| Day Percent Change: 2.59% Day Change: 0.10 | |
| Week Change: 10.61% Year-to-date Change: 26.5% | |
| CYH Links: Profile News Message Board | |
| Charts:- Daily , Weekly | |
| Add CYH to Watchlist: View: Get Complete CYH Trend Analysis ➞ | |
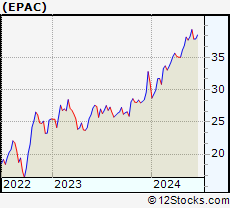 | EPAC Enerpac Tool Group Corp. |
| Sector: Industrials | |
| SubSector: Diversified Machinery | |
| MarketCap: 1044.16 Millions | |
| Recent Price: 39.32 Smart Investing & Trading Score: 100 | |
| Day Percent Change: 1.42% Day Change: 0.55 | |
| Week Change: 2.82% Year-to-date Change: 26.5% | |
| EPAC Links: Profile News Message Board | |
| Charts:- Daily , Weekly | |
| Add EPAC to Watchlist: View: Get Complete EPAC Trend Analysis ➞ | |
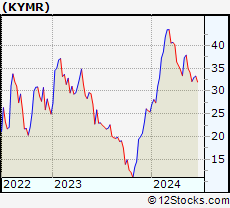 | KYMR Kymera Therapeutics, Inc. |
| Sector: Health Care | |
| SubSector: Biotechnology | |
| MarketCap: 27087 Millions | |
| Recent Price: 32.11 Smart Investing & Trading Score: 10 | |
| Day Percent Change: -0.16% Day Change: -0.05 | |
| Week Change: -5.79% Year-to-date Change: 26.4% | |
| KYMR Links: Profile News Message Board | |
| Charts:- Daily , Weekly | |
| Add KYMR to Watchlist: View: Get Complete KYMR Trend Analysis ➞ | |
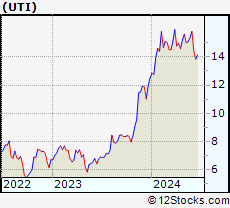 | UTI Universal Technical Institute, Inc. |
| Sector: Services & Goods | |
| SubSector: Education & Training Services | |
| MarketCap: 163.506 Millions | |
| Recent Price: 15.81 Smart Investing & Trading Score: 58 | |
| Day Percent Change: -1.50% Day Change: -0.24 | |
| Week Change: 3% Year-to-date Change: 26.3% | |
| UTI Links: Profile News Message Board | |
| Charts:- Daily , Weekly | |
| Add UTI to Watchlist: View: Get Complete UTI Trend Analysis ➞ | |
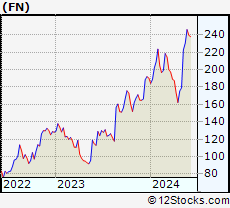 | FN Fabrinet |
| Sector: Technology | |
| SubSector: Electronic Equipment | |
| MarketCap: 1876 Millions | |
| Recent Price: 239.53 Smart Investing & Trading Score: 68 | |
| Day Percent Change: -2.76% Day Change: -6.80 | |
| Week Change: -2.66% Year-to-date Change: 25.9% | |
| FN Links: Profile News Message Board | |
| Charts:- Daily , Weekly | |
| Add FN to Watchlist: View: Get Complete FN Trend Analysis ➞ | |
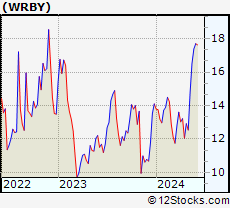 | WRBY Warby Parker Inc. |
| Sector: Health Care | |
| SubSector: Medical Instruments & Supplies | |
| MarketCap: 1380 Millions | |
| Recent Price: 17.71 Smart Investing & Trading Score: 90 | |
| Day Percent Change: 1.55% Day Change: 0.27 | |
| Week Change: 1.78% Year-to-date Change: 25.6% | |
| WRBY Links: Profile News Message Board | |
| Charts:- Daily , Weekly | |
| Add WRBY to Watchlist: View: Get Complete WRBY Trend Analysis ➞ | |
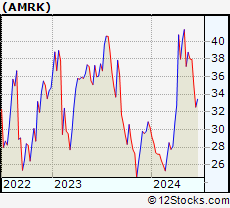 | AMRK A-Mark Precious Metals, Inc. |
| Sector: Financials | |
| SubSector: Investment Brokerage - National | |
| MarketCap: 60.2805 Millions | |
| Recent Price: 37.93 Smart Investing & Trading Score: 46 | |
| Day Percent Change: -0.18% Day Change: -0.07 | |
| Week Change: -0.18% Year-to-date Change: 25.4% | |
| AMRK Links: Profile News Message Board | |
| Charts:- Daily , Weekly | |
| Add AMRK to Watchlist: View: Get Complete AMRK Trend Analysis ➞ | |
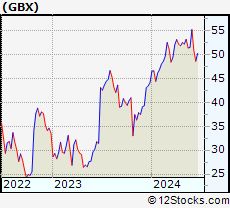 | GBX The Greenbrier Companies, Inc. |
| Sector: Transports | |
| SubSector: Railroads | |
| MarketCap: 511.022 Millions | |
| Recent Price: 55.25 Smart Investing & Trading Score: 100 | |
| Day Percent Change: 1.15% Day Change: 0.63 | |
| Week Change: 7.24% Year-to-date Change: 25.1% | |
| GBX Links: Profile News Message Board | |
| Charts:- Daily , Weekly | |
| Add GBX to Watchlist: View: Get Complete GBX Trend Analysis ➞ | |
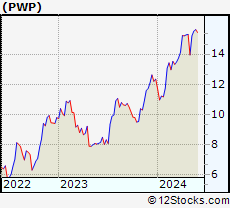 | PWP Perella Weinberg Partners |
| Sector: Financials | |
| SubSector: Capital Markets | |
| MarketCap: 705 Millions | |
| Recent Price: 15.44 Smart Investing & Trading Score: 46 | |
| Day Percent Change: 0.19% Day Change: 0.03 | |
| Week Change: -1.22% Year-to-date Change: 25.0% | |
| PWP Links: Profile News Message Board | |
| Charts:- Daily , Weekly | |
| Add PWP to Watchlist: View: Get Complete PWP Trend Analysis ➞ | |
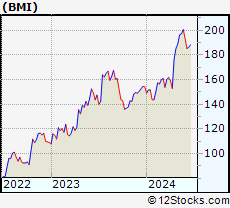 | BMI Badger Meter, Inc. |
| Sector: Technology | |
| SubSector: Scientific & Technical Instruments | |
| MarketCap: 1530.53 Millions | |
| Recent Price: 192.96 Smart Investing & Trading Score: 68 | |
| Day Percent Change: 0.42% Day Change: 0.81 | |
| Week Change: -3.83% Year-to-date Change: 25.0% | |
| BMI Links: Profile News Message Board | |
| Charts:- Daily , Weekly | |
| Add BMI to Watchlist: View: Get Complete BMI Trend Analysis ➞ | |
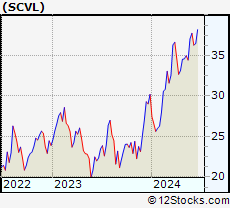 | SCVL Shoe Carnival, Inc. |
| Sector: Services & Goods | |
| SubSector: Apparel Stores | |
| MarketCap: 252.508 Millions | |
| Recent Price: 37.75 Smart Investing & Trading Score: 95 | |
| Day Percent Change: -0.92% Day Change: -0.35 | |
| Week Change: 1.83% Year-to-date Change: 25.0% | |
| SCVL Links: Profile News Message Board | |
| Charts:- Daily , Weekly | |
| Add SCVL to Watchlist: View: Get Complete SCVL Trend Analysis ➞ | |
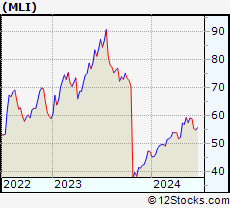 | MLI Mueller Industries, Inc. |
| Sector: Industrials | |
| SubSector: Metal Fabrication | |
| MarketCap: 1259.5 Millions | |
| Recent Price: 58.91 Smart Investing & Trading Score: 83 | |
| Day Percent Change: 1.13% Day Change: 0.66 | |
| Week Change: -0.32% Year-to-date Change: 24.9% | |
| MLI Links: Profile News Message Board | |
| Charts:- Daily , Weekly | |
| Add MLI to Watchlist: View: Get Complete MLI Trend Analysis ➞ | |
 | CRNX Crinetics Pharmaceuticals, Inc. |
| Sector: Health Care | |
| SubSector: Biotechnology | |
| MarketCap: 381.085 Millions | |
| Recent Price: 44.41 Smart Investing & Trading Score: 26 | |
| Day Percent Change: -2.12% Day Change: -0.96 | |
| Week Change: -6.56% Year-to-date Change: 24.8% | |
| CRNX Links: Profile News Message Board | |
| Charts:- Daily , Weekly | |
| Add CRNX to Watchlist: View: Get Complete CRNX Trend Analysis ➞ | |
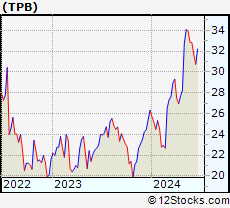 | TPB Turning Point Brands, Inc. |
| Sector: Consumer Staples | |
| SubSector: Tobacco Products, Other | |
| MarketCap: 381.97 Millions | |
| Recent Price: 32.81 Smart Investing & Trading Score: 61 | |
| Day Percent Change: 1.11% Day Change: 0.36 | |
| Week Change: -0.15% Year-to-date Change: 24.7% | |
| TPB Links: Profile News Message Board | |
| Charts:- Daily , Weekly | |
| Add TPB to Watchlist: View: Get Complete TPB Trend Analysis ➞ | |
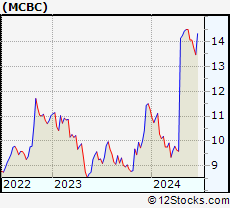 | MCBC Macatawa Bank Corporation |
| Sector: Financials | |
| SubSector: Regional - Midwest Banks | |
| MarketCap: 264.37 Millions | |
| Recent Price: 14.06 Smart Investing & Trading Score: 61 | |
| Day Percent Change: 0.29% Day Change: 0.04 | |
| Week Change: 0% Year-to-date Change: 24.7% | |
| MCBC Links: Profile News Message Board | |
| Charts:- Daily , Weekly | |
| Add MCBC to Watchlist: View: Get Complete MCBC Trend Analysis ➞ | |
| Too many stocks? View smallcap stocks filtered by marketcap & sector |
| Marketcap: All SmallCap Stocks (default-no microcap), Large, Mid-Range, Small & MicroCap |
| Sector: Tech, Finance, Energy, Staples, Retail, Industrial, Materials, Utilities & Medical |
|
Best Stocks Today 12Stocks.com |
© 2024 12Stocks.com Terms & Conditions Privacy Contact Us
All Information Provided Only For Education And Not To Be Used For Investing or Trading. See Terms & Conditions


One More Thing ... Get Best Stocks Delivered Daily!
Never Ever Miss A Move With Our Top Ten Stocks Lists
Find Best Stocks In Any Market - Bull or Bear Market
Take A Peek At Our Top Ten Stocks Lists: Daily, Weekly, Year-to-Date & Top Trends
Find Best Stocks In Any Market - Bull or Bear Market
Take A Peek At Our Top Ten Stocks Lists: Daily, Weekly, Year-to-Date & Top Trends
Smallcap Stocks With Best Up Trends [0-bearish to 100-bullish]: Ambarella [100], TPI Composites[100], Hallador Energy[100], Aaron s[100], Sportsman s[100], Heron [100], Federal Signal[100], Newpark Resources[100], Infinera [100], CONSOL Energy[100], Clean Energy[100]
Best Smallcap Stocks Year-to-Date:
CareMax [504.12%], Janux [397.91%], Viking [234.74%], Summit [232.76%], Novavax [213.13%], Longboard [208.84%], Avidity Biosciences[197.12%], Stoke [177.95%], Super Micro[175.98%], Sweetgreen [172.12%], NuScale Power[170.7%] Best Smallcap Stocks This Week:
Summit [156.95%], Insmed [150.23%], Forward Air[36.25%], Ikena Oncology[35.11%], Orchestra BioMed[32%], Credo [30.55%], Arcturus [27.58%], Semler Scientific[25.94%], Hallador Energy[25.72%], Foot Locker[25.65%], CommScope Holding[24.14%] Best Smallcap Stocks Daily:
Ambarella [20.60%], Eyenovia [13.48%], Accuray [12.74%], Slair Broadcast[12.08%], TPI Composites[12.07%], Akoustis [12.04%], Emergent BioSolutions[11.98%], Hallador Energy[11.29%], Aaron s[9.99%], Cogint [9.88%], Trinseo S.A[9.43%]