
 Login Sign Up


| |||||
 |  | ||||

| 12Stocks.com Market Intelligence |
Best SmallCap Stocks
|
| In a hurry? Small Cap Stock Lists: Performance Trends Table, Stock Charts
Sort Small Cap stocks: Daily, Weekly, Year-to-Date, Market Cap & Trends. Filter Small Cap stocks list by sector: Show all, Tech, Finance, Energy, Staples, Retail, Industrial, Materials, Utilities and HealthCare Filter Small Cap stocks list by size: All Large Medium Small and MicroCap |
| 12Stocks.com Small Cap Stocks Performances & Trends Daily | |||||||||
|
|  The overall Smart Investing & Trading Score is 86 (0-bearish to 100-bullish) which puts Small Cap index in short term bullish trend. The Smart Investing & Trading Score from previous trading session is 48 and hence an improvement of trend.
| ||||||||
Here are the Smart Investing & Trading Scores of the most requested small cap stocks at 12Stocks.com (click stock name for detailed review):
|


| 12Stocks.com: Investing in Smallcap Index with Stocks | |
|
The following table helps investors and traders sort through current performance and trends (as measured by Smart Investing & Trading Score) of various
stocks in the Smallcap Index. Quick View: Move mouse or cursor over stock symbol (ticker) to view short-term technical chart and over stock name to view long term chart. Click on  to add stock symbol to your watchlist and to add stock symbol to your watchlist and  to view watchlist. Click on any ticker or stock name for detailed market intelligence report for that stock. to view watchlist. Click on any ticker or stock name for detailed market intelligence report for that stock. |
12Stocks.com Performance of Stocks in Smallcap Index
| Ticker | Stock Name | Watchlist | Category | Recent Price | Smart Investing & Trading Score | Change % | YTD Change% |
| QSI | Quantum-Si |   | Health Care | 1.52 | 5 | -2.56% | -24.38% |
| MQ | Marqeta | | Technology | 5.32 | 27 | -0.93% | -24.38% |
| ADTN | ADTRAN | | Technology | 5.55 | 49 | -0.36% | -24.39% |
| FLIC | First of Long Island | | Financials | 10.00 | 42 | 1.83% | -24.47% |
| VCYT | Veracyte | | Health Care | 20.75 | 18 | -1.14% | -24.57% |
| APPN | Appian | | Technology | 28.39 | 0 | -0.25% | -24.61% |
| VREX | Varex Imaging | | Health Care | 15.45 | 49 | 2.05% | -24.63% |
| EAF | GrafTech | | Industrials | 1.65 | 10 | -2.94% | -24.66% |
| ONTF | ON24 | | Technology | 5.94 | 0 | -1.00% | -24.67% |
| GNL | Global Net | | Financials | 7.48 | 93 | 1.91% | -24.82% |
| ARWR | Arrowhead | | Health Care | 22.98 | 25 | 0.88% | -24.90% |
| FTCI | FTC Solar | | Technology | 0.52 | 63 | 6.96% | -24.91% |
| DM | Dominion Midstream | | Energy | 0.56 | 25 | -2.17% | -24.94% |
| SHCR | Sharecare | | Health Care | 0.81 | 30 | -3.69% | -24.95% |
| PL | Planet Labs | | Industrials | 1.86 | 22 | -3.63% | -25.00% |
| MLNK | MeridianLink | | Technology | 18.57 | 10 | 0.92% | -25.03% |
| MXL | MaxLinear | | Technology | 17.77 | 10 | -0.84% | -25.24% |
| AMN | AMN Healthcare | | Industrials | 55.94 | 65 | 3.00% | -25.29% |
| VIAV | Viavi Solutions | | Technology | 7.52 | 50 | 1.76% | -25.32% |
| PARR | Par Pacific | | Energy | 27.14 | 25 | 3.04% | -25.38% |
| DZSI | DASAN Zhone | | Technology | 1.47 | 40 | -3.92% | -25.38% |
| MTW | Manitowoc | | Industrials | 12.43 | 50 | 2.05% | -25.52% |
| WEAV | Weave | | Technology | 8.65 | 30 | 1.05% | -25.56% |
| FIGS | FIGS | | Services & Goods | 5.30 | 51 | 2.32% | -25.67% |
| DMRC | Digimarc | | Technology | 26.84 | 32 | 1.67% | -25.69% |


| Too many stocks? View smallcap stocks filtered by marketcap & sector |
| Marketcap: All SmallCap Stocks (default-no microcap), Large, Mid-Range, Small |
| Smallcap Sector: Tech, Finance, Energy, Staples, Retail, Industrial, Materials, & Medical |
|
Get the most comprehensive stock market coverage daily at 12Stocks.com ➞ Best Stocks Today ➞ Best Stocks Weekly ➞ Best Stocks Year-to-Date ➞ Best Stocks Trends ➞  Best Stocks Today 12Stocks.com Best Nasdaq Stocks ➞ Best S&P 500 Stocks ➞ Best Tech Stocks ➞ Best Biotech Stocks ➞ |
| Detailed Overview of SmallCap Stocks |
| SmallCap Technical Overview, Leaders & Laggards, Top SmallCap ETF Funds & Detailed SmallCap Stocks List, Charts, Trends & More |
| Smallcap: Technical Analysis, Trends & YTD Performance | |
| SmallCap segment as represented by
IWM, an exchange-traded fund [ETF], holds basket of thousands of smallcap stocks from across all major sectors of the US stock market. The smallcap index (contains stocks like Riverbed & Sotheby's) is up by 2.52% and is currently underperforming the overall market by -7.27% year-to-date. Below is a quick view of technical charts and trends: | |
 IWM Weekly Chart |
|
| Long Term Trend: Very Good | |
| Medium Term Trend: Very Good | |
 IWM Daily Chart |
|
| Short Term Trend: Very Good | |
| Overall Trend Score: 86 | |
| YTD Performance: 2.52% | |
| **Trend Scores & Views Are Only For Educational Purposes And Not For Investing | |
| 12Stocks.com: Top Performing Small Cap Index Stocks | ||||||||||||||||||||||||||||||||||||||||||||||||
 The top performing Small Cap Index stocks year to date are
Now, more recently, over last week, the top performing Small Cap Index stocks on the move are


|
||||||||||||||||||||||||||||||||||||||||||||||||
| 12Stocks.com: Investing in Smallcap Index using Exchange Traded Funds | |
|
The following table shows list of key exchange traded funds (ETF) that
help investors track Smallcap index. The following list also includes leveraged ETF funds that track twice or thrice the daily returns of Smallcap indices. Short or inverse ETF funds move in the opposite direction to the index they track and are useful during market pullbacks or during bear markets. Quick View: Move mouse or cursor over ETF symbol (ticker) to view short-term technical chart and over ETF name to view long term chart. Click on ticker or stock name for detailed view. Click on to add stock symbol to your watchlist and to view watchlist. |
12Stocks.com List of ETFs that track Smallcap Index
| Ticker | ETF Name | Watchlist | Recent Price | Smart Investing & Trading Score | Change % | Week % | Year-to-date % |
| IWM | iShares Russell 2000 | | 205.77 | 86 | 0.84 | 0.16 | 2.52% |
| IJR | iShares Core S&P Small-Cap | | 109.65 | 93 | 1.14 | 0.76 | 1.29% |
| IWN | iShares Russell 2000 Value | | 155.88 | 76 | 1.17 | 0.46 | 0.35% |
| IWO | iShares Russell 2000 Growth | | 263.62 | 68 | 0.33 | -0.29 | 4.52% |
| VTWO | Vanguard Russell 2000 ETF | | 82.52 | 51 | -0.08 | -0.66 | 1.75% |
| IJS | iShares S&P Small-Cap 600 Value | | 99.74 | 37 | 0.69 | 0.18 | -3.23% |
| IJT | iShares S&P Small-Cap 600 Growth | | 130.21 | 81 | 0.05 | -0.33 | 4.05% |
| XSLV | PowerShares S&P SmallCap Low Volatil ETF | | 43.66 | 48 | 0.72 | -0.23 | -1.11% |
| SBB | ProShares Short SmallCap600 | | 15.97 | 20 | -0.62 | -0.28 | 0.25% |
| SAA | ProShares Ultra SmallCap600 | | 24.16 | 58 | 0.73 | 0.03 | -3.17% |
| SDD | ProShares UltraShort SmallCap600 | | 18.11 | 17 | -2.53 | -1.36 | -1.72% |
| SMLV | SPDR SSGA US Small Cap Low Volatil ETF | | 110.05 | 55 | 0.89 | -0.16 | -2.2% |
| 12Stocks.com: Charts, Trends, Fundamental Data and Performances of SmallCap Stocks | |
|
We now take in-depth look at all SmallCap stocks including charts, multi-period performances and overall trends (as measured by Smart Investing & Trading Score). One can sort SmallCap stocks (click link to choose) by Daily, Weekly and by Year-to-Date performances. Also, one can sort by size of the company or by market capitalization. |
| Select Your Default Chart Type: | |||||
| |||||
| Click on stock symbol or name for detailed view. Click on to add stock symbol to your watchlist and to view watchlist. Quick View: Move mouse or cursor over "Daily" to quickly view daily technical stock chart and over "Weekly" to view weekly technical stock chart. | |||||

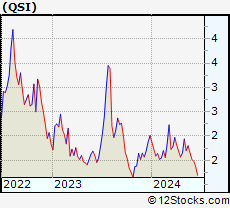 | QSI Quantum-Si incorporated |
| Sector: Health Care | |
| SubSector: Biotechnology | |
| MarketCap: 256 Millions | |
| Recent Price: 1.52 Smart Investing & Trading Score: 5 | |
| Day Percent Change: -2.56% Day Change: -0.04 | |
| Week Change: -8.16% Year-to-date Change: -24.4% | |
| QSI Links: Profile News Message Board | |
| Charts:- Daily , Weekly | |
| Add QSI to Watchlist: View: Get Complete QSI Trend Analysis ➞ | |
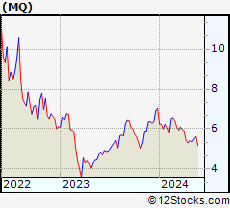 | MQ Marqeta, Inc. |
| Sector: Technology | |
| SubSector: Software - Infrastructure | |
| MarketCap: 2650 Millions | |
| Recent Price: 5.32 Smart Investing & Trading Score: 27 | |
| Day Percent Change: -0.93% Day Change: -0.05 | |
| Week Change: -1.12% Year-to-date Change: -24.4% | |
| MQ Links: Profile News Message Board | |
| Charts:- Daily , Weekly | |
| Add MQ to Watchlist: View: Get Complete MQ Trend Analysis ➞ | |
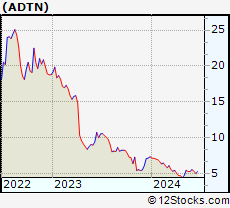 | ADTN ADTRAN, Inc. |
| Sector: Technology | |
| SubSector: Communication Equipment | |
| MarketCap: 303.539 Millions | |
| Recent Price: 5.55 Smart Investing & Trading Score: 49 | |
| Day Percent Change: -0.36% Day Change: -0.02 | |
| Week Change: 5.31% Year-to-date Change: -24.4% | |
| ADTN Links: Profile News Message Board | |
| Charts:- Daily , Weekly | |
| Add ADTN to Watchlist: View: Get Complete ADTN Trend Analysis ➞ | |
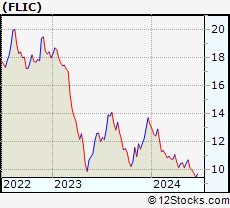 | FLIC The First of Long Island Corporation |
| Sector: Financials | |
| SubSector: Regional - Northeast Banks | |
| MarketCap: 352.899 Millions | |
| Recent Price: 10.00 Smart Investing & Trading Score: 42 | |
| Day Percent Change: 1.83% Day Change: 0.18 | |
| Week Change: -1.38% Year-to-date Change: -24.5% | |
| FLIC Links: Profile News Message Board | |
| Charts:- Daily , Weekly | |
| Add FLIC to Watchlist: View: Get Complete FLIC Trend Analysis ➞ | |
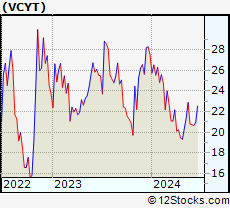 | VCYT Veracyte, Inc. |
| Sector: Health Care | |
| SubSector: Biotechnology | |
| MarketCap: 1089.05 Millions | |
| Recent Price: 20.75 Smart Investing & Trading Score: 18 | |
| Day Percent Change: -1.14% Day Change: -0.24 | |
| Week Change: -0.24% Year-to-date Change: -24.6% | |
| VCYT Links: Profile News Message Board | |
| Charts:- Daily , Weekly | |
| Add VCYT to Watchlist: View: Get Complete VCYT Trend Analysis ➞ | |
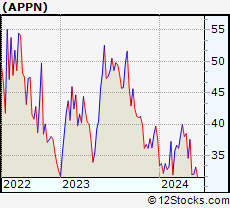 | APPN Appian Corporation |
| Sector: Technology | |
| SubSector: Application Software | |
| MarketCap: 2737.92 Millions | |
| Recent Price: 28.39 Smart Investing & Trading Score: 0 | |
| Day Percent Change: -0.25% Day Change: -0.07 | |
| Week Change: -8.57% Year-to-date Change: -24.6% | |
| APPN Links: Profile News Message Board | |
| Charts:- Daily , Weekly | |
| Add APPN to Watchlist: View: Get Complete APPN Trend Analysis ➞ | |
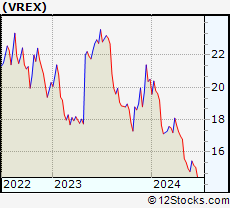 | VREX Varex Imaging Corporation |
| Sector: Health Care | |
| SubSector: Medical Appliances & Equipment | |
| MarketCap: 718.78 Millions | |
| Recent Price: 15.45 Smart Investing & Trading Score: 49 | |
| Day Percent Change: 2.05% Day Change: 0.31 | |
| Week Change: 4.46% Year-to-date Change: -24.6% | |
| VREX Links: Profile News Message Board | |
| Charts:- Daily , Weekly | |
| Add VREX to Watchlist: View: Get Complete VREX Trend Analysis ➞ | |
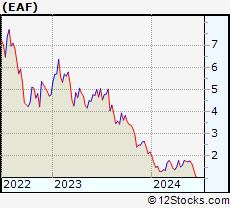 | EAF GrafTech International Ltd. |
| Sector: Industrials | |
| SubSector: Diversified Machinery | |
| MarketCap: 2084.36 Millions | |
| Recent Price: 1.65 Smart Investing & Trading Score: 10 | |
| Day Percent Change: -2.94% Day Change: -0.05 | |
| Week Change: -7.3% Year-to-date Change: -24.7% | |
| EAF Links: Profile News Message Board | |
| Charts:- Daily , Weekly | |
| Add EAF to Watchlist: View: Get Complete EAF Trend Analysis ➞ | |
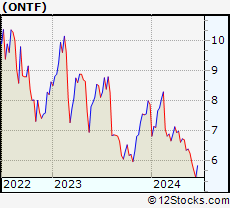 | ONTF ON24, Inc. |
| Sector: Technology | |
| SubSector: Software - Application | |
| MarketCap: 386 Millions | |
| Recent Price: 5.94 Smart Investing & Trading Score: 0 | |
| Day Percent Change: -1.00% Day Change: -0.06 | |
| Week Change: -5.11% Year-to-date Change: -24.7% | |
| ONTF Links: Profile News Message Board | |
| Charts:- Daily , Weekly | |
| Add ONTF to Watchlist: View: Get Complete ONTF Trend Analysis ➞ | |
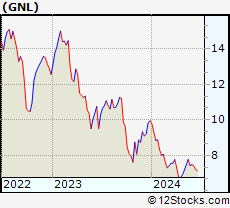 | GNL Global Net Lease, Inc. |
| Sector: Financials | |
| SubSector: REIT - Diversified | |
| MarketCap: 1362.73 Millions | |
| Recent Price: 7.48 Smart Investing & Trading Score: 93 | |
| Day Percent Change: 1.91% Day Change: 0.14 | |
| Week Change: 0.67% Year-to-date Change: -24.8% | |
| GNL Links: Profile News Message Board | |
| Charts:- Daily , Weekly | |
| Add GNL to Watchlist: View: Get Complete GNL Trend Analysis ➞ | |
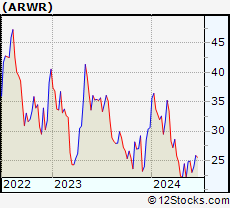 | ARWR Arrowhead Pharmaceuticals, Inc. |
| Sector: Health Care | |
| SubSector: Biotechnology | |
| MarketCap: 3226.15 Millions | |
| Recent Price: 22.98 Smart Investing & Trading Score: 25 | |
| Day Percent Change: 0.88% Day Change: 0.20 | |
| Week Change: -7.64% Year-to-date Change: -24.9% | |
| ARWR Links: Profile News Message Board | |
| Charts:- Daily , Weekly | |
| Add ARWR to Watchlist: View: Get Complete ARWR Trend Analysis ➞ | |
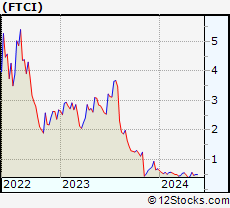 | FTCI FTC Solar, Inc. |
| Sector: Technology | |
| SubSector: Solar | |
| MarketCap: 345 Millions | |
| Recent Price: 0.52 Smart Investing & Trading Score: 63 | |
| Day Percent Change: 6.96% Day Change: 0.03 | |
| Week Change: 3.5% Year-to-date Change: -24.9% | |
| FTCI Links: Profile News Message Board | |
| Charts:- Daily , Weekly | |
| Add FTCI to Watchlist: View: Get Complete FTCI Trend Analysis ➞ | |
 | DM Dominion Midstream Partners, LP |
| Sector: Energy | |
| SubSector: Oil & Gas Pipelines | |
| MarketCap: 3017.01 Millions | |
| Recent Price: 0.56 Smart Investing & Trading Score: 25 | |
| Day Percent Change: -2.17% Day Change: -0.01 | |
| Week Change: -0.37% Year-to-date Change: -24.9% | |
| DM Links: Profile News Message Board | |
| Charts:- Daily , Weekly | |
| Add DM to Watchlist: View: Get Complete DM Trend Analysis ➞ | |
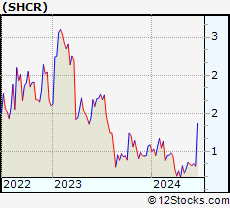 | SHCR Sharecare, Inc. |
| Sector: Health Care | |
| SubSector: Health Information Services | |
| MarketCap: 640 Millions | |
| Recent Price: 0.81 Smart Investing & Trading Score: 30 | |
| Day Percent Change: -3.69% Day Change: -0.03 | |
| Week Change: -1.8% Year-to-date Change: -25.0% | |
| SHCR Links: Profile News Message Board | |
| Charts:- Daily , Weekly | |
| Add SHCR to Watchlist: View: Get Complete SHCR Trend Analysis ➞ | |
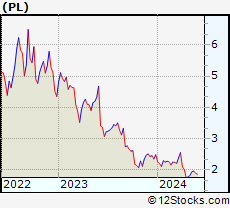 | PL Planet Labs PBC |
| Sector: Industrials | |
| SubSector: Aerospace & Defense | |
| MarketCap: 874 Millions | |
| Recent Price: 1.86 Smart Investing & Trading Score: 22 | |
| Day Percent Change: -3.63% Day Change: -0.07 | |
| Week Change: -1.59% Year-to-date Change: -25.0% | |
| PL Links: Profile News Message Board | |
| Charts:- Daily , Weekly | |
| Add PL to Watchlist: View: Get Complete PL Trend Analysis ➞ | |
 | MLNK MeridianLink, Inc. |
| Sector: Technology | |
| SubSector: Software - Application | |
| MarketCap: 1630 Millions | |
| Recent Price: 18.57 Smart Investing & Trading Score: 10 | |
| Day Percent Change: 0.92% Day Change: 0.17 | |
| Week Change: -3.08% Year-to-date Change: -25.0% | |
| MLNK Links: Profile News Message Board | |
| Charts:- Daily , Weekly | |
| Add MLNK to Watchlist: View: Get Complete MLNK Trend Analysis ➞ | |
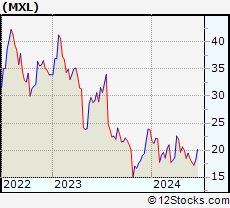 | MXL MaxLinear, Inc. |
| Sector: Technology | |
| SubSector: Semiconductor - Integrated Circuits | |
| MarketCap: 751.31 Millions | |
| Recent Price: 17.77 Smart Investing & Trading Score: 10 | |
| Day Percent Change: -0.84% Day Change: -0.15 | |
| Week Change: -3.58% Year-to-date Change: -25.2% | |
| MXL Links: Profile News Message Board | |
| Charts:- Daily , Weekly | |
| Add MXL to Watchlist: View: Get Complete MXL Trend Analysis ➞ | |
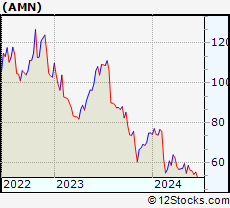 | AMN AMN Healthcare Services, Inc. |
| Sector: Industrials | |
| SubSector: General Building Materials | |
| MarketCap: 3064.03 Millions | |
| Recent Price: 55.94 Smart Investing & Trading Score: 65 | |
| Day Percent Change: 3.00% Day Change: 1.63 | |
| Week Change: -0.53% Year-to-date Change: -25.3% | |
| AMN Links: Profile News Message Board | |
| Charts:- Daily , Weekly | |
| Add AMN to Watchlist: View: Get Complete AMN Trend Analysis ➞ | |
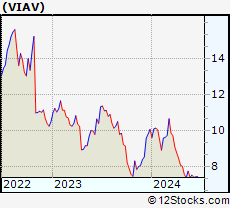 | VIAV Viavi Solutions Inc. |
| Sector: Technology | |
| SubSector: Communication Equipment | |
| MarketCap: 2653.29 Millions | |
| Recent Price: 7.52 Smart Investing & Trading Score: 50 | |
| Day Percent Change: 1.76% Day Change: 0.13 | |
| Week Change: 1.76% Year-to-date Change: -25.3% | |
| VIAV Links: Profile News Message Board | |
| Charts:- Daily , Weekly | |
| Add VIAV to Watchlist: View: Get Complete VIAV Trend Analysis ➞ | |
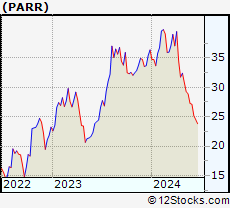 | PARR Par Pacific Holdings, Inc. |
| Sector: Energy | |
| SubSector: Oil & Gas Refining & Marketing | |
| MarketCap: 443.154 Millions | |
| Recent Price: 27.14 Smart Investing & Trading Score: 25 | |
| Day Percent Change: 3.04% Day Change: 0.80 | |
| Week Change: -0.51% Year-to-date Change: -25.4% | |
| PARR Links: Profile News Message Board | |
| Charts:- Daily , Weekly | |
| Add PARR to Watchlist: View: Get Complete PARR Trend Analysis ➞ | |
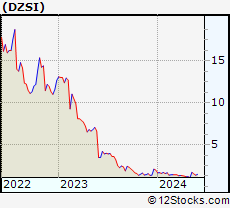 | DZSI DASAN Zhone Solutions, Inc. |
| Sector: Technology | |
| SubSector: Communication Equipment | |
| MarketCap: 90.0539 Millions | |
| Recent Price: 1.47 Smart Investing & Trading Score: 40 | |
| Day Percent Change: -3.92% Day Change: -0.06 | |
| Week Change: 8.89% Year-to-date Change: -25.4% | |
| DZSI Links: Profile News Message Board | |
| Charts:- Daily , Weekly | |
| Add DZSI to Watchlist: View: Get Complete DZSI Trend Analysis ➞ | |
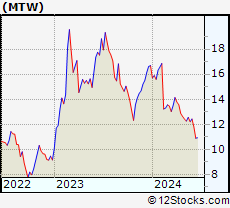 | MTW The Manitowoc Company, Inc. |
| Sector: Industrials | |
| SubSector: Farm & Construction Machinery | |
| MarketCap: 373.707 Millions | |
| Recent Price: 12.43 Smart Investing & Trading Score: 50 | |
| Day Percent Change: 2.05% Day Change: 0.25 | |
| Week Change: 1.8% Year-to-date Change: -25.5% | |
| MTW Links: Profile News Message Board | |
| Charts:- Daily , Weekly | |
| Add MTW to Watchlist: View: Get Complete MTW Trend Analysis ➞ | |
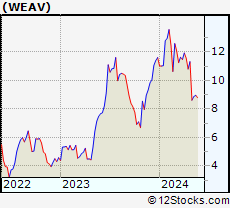 | WEAV Weave Communications, Inc. |
| Sector: Technology | |
| SubSector: Software - Application | |
| MarketCap: 740 Millions | |
| Recent Price: 8.65 Smart Investing & Trading Score: 30 | |
| Day Percent Change: 1.05% Day Change: 0.09 | |
| Week Change: -1.48% Year-to-date Change: -25.6% | |
| WEAV Links: Profile News Message Board | |
| Charts:- Daily , Weekly | |
| Add WEAV to Watchlist: View: Get Complete WEAV Trend Analysis ➞ | |
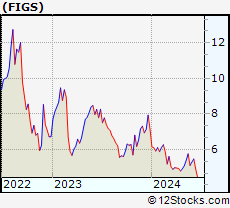 | FIGS FIGS, Inc. |
| Sector: Services & Goods | |
| SubSector: Apparel Manufacturing | |
| MarketCap: 1370 Millions | |
| Recent Price: 5.30 Smart Investing & Trading Score: 51 | |
| Day Percent Change: 2.32% Day Change: 0.12 | |
| Week Change: 3.82% Year-to-date Change: -25.7% | |
| FIGS Links: Profile News Message Board | |
| Charts:- Daily , Weekly | |
| Add FIGS to Watchlist: View: Get Complete FIGS Trend Analysis ➞ | |
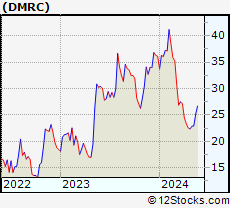 | DMRC Digimarc Corporation |
| Sector: Technology | |
| SubSector: Information Technology Services | |
| MarketCap: 222.268 Millions | |
| Recent Price: 26.84 Smart Investing & Trading Score: 32 | |
| Day Percent Change: 1.67% Day Change: 0.44 | |
| Week Change: -0.67% Year-to-date Change: -25.7% | |
| DMRC Links: Profile News Message Board | |
| Charts:- Daily , Weekly | |
| Add DMRC to Watchlist: View: Get Complete DMRC Trend Analysis ➞ | |
| Too many stocks? View smallcap stocks filtered by marketcap & sector |
| Marketcap: All SmallCap Stocks (default-no microcap), Large, Mid-Range, Small & MicroCap |
| Sector: Tech, Finance, Energy, Staples, Retail, Industrial, Materials, Utilities & Medical |
|
Best Stocks Today 12Stocks.com |
© 2024 12Stocks.com Terms & Conditions Privacy Contact Us
All Information Provided Only For Education And Not To Be Used For Investing or Trading. See Terms & Conditions


One More Thing ... Get Best Stocks Delivered Daily!
Never Ever Miss A Move With Our Top Ten Stocks Lists
Find Best Stocks In Any Market - Bull or Bear Market
Take A Peek At Our Top Ten Stocks Lists: Daily, Weekly, Year-to-Date & Top Trends
Find Best Stocks In Any Market - Bull or Bear Market
Take A Peek At Our Top Ten Stocks Lists: Daily, Weekly, Year-to-Date & Top Trends
Smallcap Stocks With Best Up Trends [0-bearish to 100-bullish]: Ambarella [100], TPI Composites[100], Hallador Energy[100], Aaron s[100], Sportsman s[100], Heron [100], Federal Signal[100], Newpark Resources[100], Infinera [100], CONSOL Energy[100], Clean Energy[100]
Best Smallcap Stocks Year-to-Date:
CareMax [504.12%], Janux [397.91%], Viking [234.74%], Summit [232.76%], Novavax [213.13%], Longboard [208.84%], Avidity Biosciences[197.12%], Stoke [177.95%], Super Micro[175.98%], Sweetgreen [172.12%], NuScale Power[170.7%] Best Smallcap Stocks This Week:
Summit [156.95%], Insmed [150.23%], Forward Air[36.25%], Ikena Oncology[35.11%], Orchestra BioMed[32%], Credo [30.55%], Arcturus [27.58%], Semler Scientific[25.94%], Hallador Energy[25.72%], Foot Locker[25.65%], CommScope Holding[24.14%] Best Smallcap Stocks Daily:
Ambarella [20.60%], Eyenovia [13.48%], Accuray [12.74%], Slair Broadcast[12.08%], TPI Composites[12.07%], Akoustis [12.04%], Emergent BioSolutions[11.98%], Hallador Energy[11.29%], Aaron s[9.99%], Cogint [9.88%], Trinseo S.A[9.43%]