
 Login Sign Up


| |||||
 |  | ||||

| 12Stocks.com Market Intelligence |
Best S&P 500 Stocks
|
On this page, you will find the most comprehensive analysis of S&P 500 stocks and ETFs - from latest trends to performances to charts ➞. First, here are the year-to-date (YTD) performances of the most requested S&P 500 stocks at 12Stocks.com (click stock for review):
| NVIDIA 87% | ||
| Google 26% | ||
| Walmart 23% | ||
| Amazon.com 22% | ||
| Goldman Sachs 21% | ||
| Caterpillar 21% | ||
| JPMorgan Chase 20% | ||
| Merck 20% | ||
| Microsoft 12% | ||
| Chevron 9% | ||
| Johnson & Johnson -1% | ||
| Apple -1% | ||
| McDonald s -8% | ||
| Gilead -16% | ||
| Starbucks -19% | ||
| Boeing -29% | ||
| Intel -37% | ||
| Quick: S&P 500 Stocks Lists: Performances & Trends, S&P 500 Stock Charts
Sort S&P 500 stocks: Daily, Weekly, Year-to-Date, Market Cap & Trends. Filter S&P 500 stocks list by sector: Show all, Tech, Finance, Energy, Staples, Retail, Industrial, Materials, Utilities and HealthCare |
| 12Stocks.com S&P 500 Stocks Performances & Trends Daily Report | |||||||||
|
| 
The overall Smart Investing & Trading Score is 88 (0-bearish to 100-bullish) which puts S&P 500 index in short term bullish trend. The Smart Investing & Trading Score from previous trading session is 95 and hence a deterioration of trend. | ||||||||
Here are the Smart Investing & Trading Scores of the most requested S&P 500 stocks at 12Stocks.com (click stock name for detailed review):
|


| 12Stocks.com: Top Performing S&P 500 Index Stocks | ||||||||||||||||||||||||||||||||||||||||||||||||
 The top performing S&P 500 Index stocks year to date are
Now, more recently, over last week, the top performing S&P 500 Index stocks on the move are


|
||||||||||||||||||||||||||||||||||||||||||||||||
| 12Stocks.com: Investing in S&P 500 Index with Stocks | |
|
The following table helps investors and traders sort through current performance and trends (as measured by Smart Investing & Trading Score) of various
stocks in the S&P 500 Index. Quick View: Move mouse or cursor over stock symbol (ticker) to view short-term technical chart and over stock name to view long term chart. Click on  to add stock symbol to your watchlist and to add stock symbol to your watchlist and  to view watchlist. Click on any ticker or stock name for detailed market intelligence report for that stock. to view watchlist. Click on any ticker or stock name for detailed market intelligence report for that stock. |
12Stocks.com Performance of Stocks in S&P 500 Index
| Ticker | Stock Name | Watchlist | Category | Recent Price | Smart Investing & Trading Score | Change % | Weekly Change% |
| WAT | Waters |   | Health Care | 355.95 | 68 | -1.26% | 1.38% |
| NKE | NIKE | | Consumer Staples | 92.18 | 35 | 0.45% | 1.36% |
| MSI | Motorola Solutions | | Technology | 367.80 | 95 | 0.38% | 1.36% |
| CBOE | Cboe Global | | Financials | 183.51 | 57 | 0.80% | 1.35% |
| T | AT&T | | Technology | 17.40 | 83 | 0.58% | 1.34% |
| TTWO | Take-Two Interactive | | Technology | 147.84 | 77 | 1.20% | 1.34% |
| STX | Seagate | | Technology | 95.27 | 63 | -3.02% | 1.34% |
| PEP | PepsiCo | | Consumer Staples | 182.19 | 95 | -0.50% | 1.33% |
| VRSK | Verisk Analytics | | Services & Goods | 251.62 | 90 | 0.06% | 1.33% |
| LLY | Eli Lilly | | Health Care | 770.00 | 73 | -0.15% | 1.32% |
| MSFT | Microsoft | | Technology | 420.21 | 78 | -0.19% | 1.32% |
| BX | Blackstone | | Financials | 125.67 | 40 | -1.73% | 1.31% |
| BSX | Boston Scientific | | Health Care | 74.65 | 88 | 0.13% | 1.30% |
| UDR | UDR | | Financials | 39.54 | 76 | 0.30% | 1.28% |
| CNP | CenterPoint | | Utilities | 30.08 | 100 | 0.47% | 1.28% |
| SRE | Sempra | | Utilities | 78.17 | 83 | 0.64% | 1.28% |
| UPS | United Parcel | | Transports | 149.24 | 82 | -0.28% | 1.27% |
| HIG | Hartford Financial | | Financials | 103.17 | 100 | 0.98% | 1.26% |
| KIM | Kimco Realty | | Financials | 19.22 | 42 | 0.63% | 1.26% |
| ATO | Atmos | | Utilities | 118.64 | 93 | 0.07% | 1.25% |
| LNT | Alliant | | Utilities | 51.97 | 83 | 0.00% | 1.25% |
| SYK | Stryker | | Health Care | 334.68 | 43 | 0.21% | 1.24% |
| GM | General Motors | | Consumer Staples | 45.76 | 83 | -0.24% | 1.22% |
| DUK | Duke | | Utilities | 103.89 | 95 | 1.02% | 1.19% |
| GRMN | Garmin | | Technology | 170.94 | 76 | 0.56% | 1.19% |
| For chart view version of above stock list: Chart View ➞ 0 - 25 , 25 - 50 , 50 - 75 , 75 - 100 , 100 - 125 , 125 - 150 , 150 - 175 , 175 - 200 , 200 - 225 , 225 - 250 , 250 - 275 , 275 - 300 , 300 - 325 , 325 - 350 , 350 - 375 , 375 - 400 , 400 - 425 , 425 - 450 , 450 - 475 , 475 - 500 | ||
 | Click To Change The Sort Order: By Market Cap or Company Size Performance: Year-to-date, Week and Day |  |
|
Get the most comprehensive stock market coverage daily at 12Stocks.com ➞ Best Stocks Today ➞ Best Stocks Weekly ➞ Best Stocks Year-to-Date ➞ Best Stocks Trends ➞  Best Stocks Today 12Stocks.com Best Nasdaq Stocks ➞ Best S&P 500 Stocks ➞ Best Tech Stocks ➞ Best Biotech Stocks ➞ |
| Detailed Overview of S&P 500 Stocks |
| S&P 500 Technical Overview, Leaders & Laggards, Top S&P 500 ETF Funds & Detailed S&P 500 Stocks List, Charts, Trends & More |
| S&P 500: Technical Analysis, Trends & YTD Performance | |
| S&P 500 index as represented by
SPY, an exchange-traded fund [ETF], holds basket of five hundred (mostly largecap) stocks from across all major sectors of the US stock market. The S&P 500 index (contains stocks like Apple and Exxon) is up by 11.39% and is currently outperforming the overall market by 0.82% year-to-date. Below is a quick view of technical charts and trends: | |
 SPY Weekly Chart |
|
| Long Term Trend: Very Good | |
| Medium Term Trend: Very Good | |
 SPY Daily Chart |
|
| Short Term Trend: Good | |
| Overall Trend Score: 88 | |
| YTD Performance: 11.39% | |
| **Trend Scores & Views Are Only For Educational Purposes And Not For Investing | |
| 12Stocks.com: Investing in S&P 500 Index using Exchange Traded Funds | |
|
The following table shows list of key exchange traded funds (ETF) that
help investors track S&P 500 index. The following list also includes leveraged ETF funds that track twice or thrice the daily returns of S&P 500 indices. Short or inverse ETF funds move in the opposite direction to the index they track and are useful during market pullbacks or during bear markets. Quick View: Move mouse or cursor over ETF symbol (ticker) to view short-term technical chart and over ETF name to view long term chart. Click on ticker or stock name for detailed view. Click on to add stock symbol to your watchlist and to view watchlist. |
12Stocks.com List of ETFs that track S&P 500 Index
| Ticker | ETF Name | Watchlist | Recent Price | Smart Investing & Trading Score | Change % | Week % | Year-to-date % |
| SPY | SPDR S&P 500 ETF | | 529.45 | 88 | 0.14 | 1.65 | 11.39% |
| IVV | iShares Core S&P 500 ETF | | 532.13 | 83 | -0.34 | 1.67 | 11.41% |
| VOO | Vanguard 500 ETF | | 486.69 | 83 | -0.32 | 1.66 | 11.42% |
| OEF | iShares S&P 100 | | 252.41 | 83 | 0.12 | 1.84 | 12.99% |
| SSO | ProShares Ultra S&P500 | | 78.55 | 83 | 0.32 | 3.18 | 20.72% |
| UPRO | ProShares UltraPro S&P500 | | 71.44 | 88 | 0.39 | 4.7 | 30.51% |
| SPXL | Direxion Daily S&P500 Bull 3X ETF | | 135.59 | 83 | -1.13 | 4.66 | 30.39% |
| SH | ProShares Short S&P500 | | 11.85 | 17 | -0.08 | -1.41 | -8.78% |
| SDS | ProShares UltraShort S&P500 | | 24.60 | 17 | -0.24 | -2.96 | -17.78% |
| SPXU | ProShares UltraPro Short S&P500 | | 31.63 | 17 | -0.41 | -4.47 | -26.44% |
| SPXS | Direxion Daily S&P 500 Bear 3X ETF | | 8.56 | 17 | 1.18 | -4.57 | -25.89% |
| 12Stocks.com: Charts, Trends, Fundamental Data and Performances of S&P 500 Stocks | |
|
We now take in-depth look at all S&P 500 stocks including charts, multi-period performances and overall trends (as measured by Smart Investing & Trading Score). One can sort S&P 500 stocks (click link to choose) by Daily, Weekly and by Year-to-Date performances. Also, one can sort by size of the company or by market capitalization. |
| Select Your Default Chart Type: | |||||
| |||||
| Click on stock symbol or name for detailed view. Click on to add stock symbol to your watchlist and to view watchlist. Quick View: Move mouse or cursor over "Daily" to quickly view daily technical stock chart and over "Weekly" to view weekly technical stock chart. | |||||

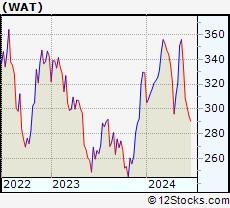 | WAT Waters Corporation |
| Sector: Health Care | |
| SubSector: Medical Instruments & Supplies | |
| MarketCap: 11882 Millions | |
| Recent Price: 355.95 Smart Investing & Trading Score: 68 | |
| Day Percent Change: -1.26% Day Change: -4.56 | |
| Week Change: 1.38% Year-to-date Change: 8.1% | |
| WAT Links: Profile News Message Board | |
| Charts:- Daily , Weekly | |
| Add WAT to Watchlist: View: Get WAT Trend Analysis ➞ | |
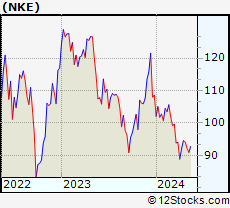 | NKE NIKE, Inc. |
| Sector: Consumer Staples | |
| SubSector: Textile - Apparel Footwear & Accessories | |
| MarketCap: 118918 Millions | |
| Recent Price: 92.18 Smart Investing & Trading Score: 35 | |
| Day Percent Change: 0.45% Day Change: 0.41 | |
| Week Change: 1.36% Year-to-date Change: -15.1% | |
| NKE Links: Profile News Message Board | |
| Charts:- Daily , Weekly | |
| Add NKE to Watchlist: View: Get NKE Trend Analysis ➞ | |
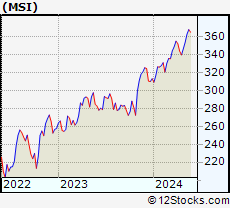 | MSI Motorola Solutions, Inc. |
| Sector: Technology | |
| SubSector: Communication Equipment | |
| MarketCap: 26573.3 Millions | |
| Recent Price: 367.80 Smart Investing & Trading Score: 95 | |
| Day Percent Change: 0.38% Day Change: 1.39 | |
| Week Change: 1.36% Year-to-date Change: 17.5% | |
| MSI Links: Profile News Message Board | |
| Charts:- Daily , Weekly | |
| Add MSI to Watchlist: View: Get MSI Trend Analysis ➞ | |
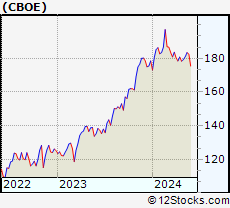 | CBOE Cboe Global Markets, Inc. |
| Sector: Financials | |
| SubSector: Diversified Investments | |
| MarketCap: 8834.5 Millions | |
| Recent Price: 183.51 Smart Investing & Trading Score: 57 | |
| Day Percent Change: 0.80% Day Change: 1.45 | |
| Week Change: 1.35% Year-to-date Change: 2.8% | |
| CBOE Links: Profile News Message Board | |
| Charts:- Daily , Weekly | |
| Add CBOE to Watchlist: View: Get CBOE Trend Analysis ➞ | |
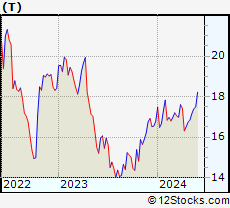 | T AT&T Inc. |
| Sector: Technology | |
| SubSector: Telecom Services - Domestic | |
| MarketCap: 224847 Millions | |
| Recent Price: 17.40 Smart Investing & Trading Score: 83 | |
| Day Percent Change: 0.58% Day Change: 0.10 | |
| Week Change: 1.34% Year-to-date Change: 3.7% | |
| T Links: Profile News Message Board | |
| Charts:- Daily , Weekly | |
| Add T to Watchlist: View: Get T Trend Analysis ➞ | |
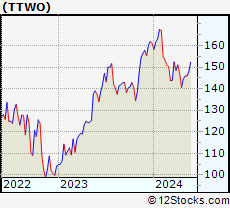 | TTWO Take-Two Interactive Software, Inc. |
| Sector: Technology | |
| SubSector: Multimedia & Graphics Software | |
| MarketCap: 12479.6 Millions | |
| Recent Price: 147.84 Smart Investing & Trading Score: 77 | |
| Day Percent Change: 1.20% Day Change: 1.76 | |
| Week Change: 1.34% Year-to-date Change: -8.2% | |
| TTWO Links: Profile News Message Board | |
| Charts:- Daily , Weekly | |
| Add TTWO to Watchlist: View: Get TTWO Trend Analysis ➞ | |
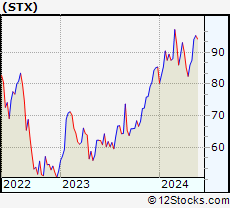 | STX Seagate Technology plc |
| Sector: Technology | |
| SubSector: Data Storage Devices | |
| MarketCap: 10814.7 Millions | |
| Recent Price: 95.27 Smart Investing & Trading Score: 63 | |
| Day Percent Change: -3.02% Day Change: -2.97 | |
| Week Change: 1.34% Year-to-date Change: 11.6% | |
| STX Links: Profile News Message Board | |
| Charts:- Daily , Weekly | |
| Add STX to Watchlist: View: Get STX Trend Analysis ➞ | |
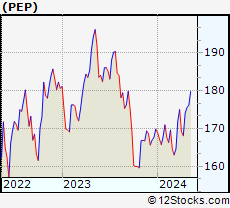 | PEP PepsiCo, Inc. |
| Sector: Consumer Staples | |
| SubSector: Beverages - Soft Drinks | |
| MarketCap: 162458 Millions | |
| Recent Price: 182.19 Smart Investing & Trading Score: 95 | |
| Day Percent Change: -0.50% Day Change: -0.92 | |
| Week Change: 1.33% Year-to-date Change: 7.3% | |
| PEP Links: Profile News Message Board | |
| Charts:- Daily , Weekly | |
| Add PEP to Watchlist: View: Get PEP Trend Analysis ➞ | |
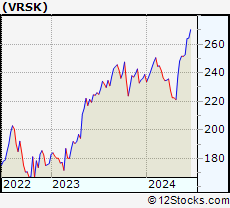 | VRSK Verisk Analytics, Inc. |
| Sector: Services & Goods | |
| SubSector: Business Services | |
| MarketCap: 22033.2 Millions | |
| Recent Price: 251.62 Smart Investing & Trading Score: 90 | |
| Day Percent Change: 0.06% Day Change: 0.14 | |
| Week Change: 1.33% Year-to-date Change: 5.3% | |
| VRSK Links: Profile News Message Board | |
| Charts:- Daily , Weekly | |
| Add VRSK to Watchlist: View: Get VRSK Trend Analysis ➞ | |
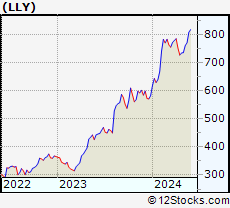 | LLY Eli Lilly and Company |
| Sector: Health Care | |
| SubSector: Drug Manufacturers - Major | |
| MarketCap: 130066 Millions | |
| Recent Price: 770.00 Smart Investing & Trading Score: 73 | |
| Day Percent Change: -0.15% Day Change: -1.12 | |
| Week Change: 1.32% Year-to-date Change: 32.1% | |
| LLY Links: Profile News Message Board | |
| Charts:- Daily , Weekly | |
| Add LLY to Watchlist: View: Get LLY Trend Analysis ➞ | |
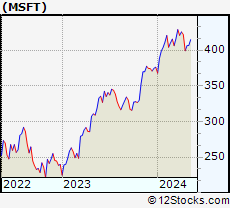 | MSFT Microsoft Corporation |
| Sector: Technology | |
| SubSector: Business Software & Services | |
| MarketCap: 1154150 Millions | |
| Recent Price: 420.21 Smart Investing & Trading Score: 78 | |
| Day Percent Change: -0.19% Day Change: -0.78 | |
| Week Change: 1.32% Year-to-date Change: 11.8% | |
| MSFT Links: Profile News Message Board | |
| Charts:- Daily , Weekly | |
| Add MSFT to Watchlist: View: Get MSFT Trend Analysis ➞ | |
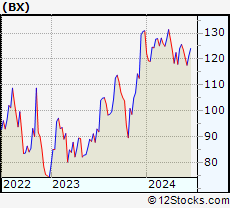 | BX The Blackstone Group Inc. |
| Sector: Financials | |
| SubSector: Asset Management | |
| MarketCap: 50957.7 Millions | |
| Recent Price: 125.67 Smart Investing & Trading Score: 40 | |
| Day Percent Change: -1.73% Day Change: -2.21 | |
| Week Change: 1.31% Year-to-date Change: -4.0% | |
| BX Links: Profile News Message Board | |
| Charts:- Daily , Weekly | |
| Add BX to Watchlist: View: Get BX Trend Analysis ➞ | |
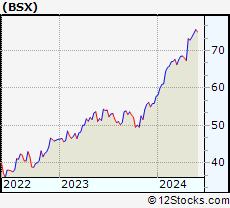 | BSX Boston Scientific Corporation |
| Sector: Health Care | |
| SubSector: Medical Appliances & Equipment | |
| MarketCap: 41541.2 Millions | |
| Recent Price: 74.65 Smart Investing & Trading Score: 88 | |
| Day Percent Change: 0.13% Day Change: 0.10 | |
| Week Change: 1.3% Year-to-date Change: 29.1% | |
| BSX Links: Profile News Message Board | |
| Charts:- Daily , Weekly | |
| Add BSX to Watchlist: View: Get BSX Trend Analysis ➞ | |
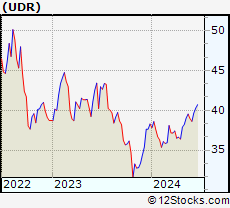 | UDR UDR, Inc. |
| Sector: Financials | |
| SubSector: REIT - Residential | |
| MarketCap: 10180.1 Millions | |
| Recent Price: 39.54 Smart Investing & Trading Score: 76 | |
| Day Percent Change: 0.30% Day Change: 0.12 | |
| Week Change: 1.28% Year-to-date Change: 3.3% | |
| UDR Links: Profile News Message Board | |
| Charts:- Daily , Weekly | |
| Add UDR to Watchlist: View: Get UDR Trend Analysis ➞ | |
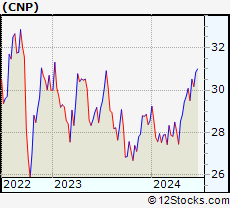 | CNP CenterPoint Energy, Inc. |
| Sector: Utilities | |
| SubSector: Gas Utilities | |
| MarketCap: 7444.07 Millions | |
| Recent Price: 30.08 Smart Investing & Trading Score: 100 | |
| Day Percent Change: 0.47% Day Change: 0.14 | |
| Week Change: 1.28% Year-to-date Change: 5.3% | |
| CNP Links: Profile News Message Board | |
| Charts:- Daily , Weekly | |
| Add CNP to Watchlist: View: Get CNP Trend Analysis ➞ | |
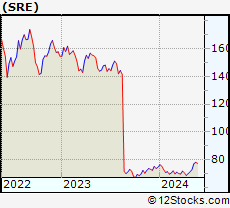 | SRE Sempra Energy |
| Sector: Utilities | |
| SubSector: Diversified Utilities | |
| MarketCap: 34339.9 Millions | |
| Recent Price: 78.17 Smart Investing & Trading Score: 83 | |
| Day Percent Change: 0.64% Day Change: 0.50 | |
| Week Change: 1.28% Year-to-date Change: 4.6% | |
| SRE Links: Profile News Message Board | |
| Charts:- Daily , Weekly | |
| Add SRE to Watchlist: View: Get SRE Trend Analysis ➞ | |
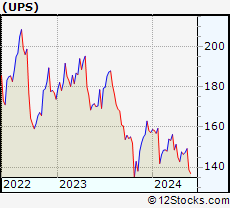 | UPS United Parcel Service, Inc. |
| Sector: Transports | |
| SubSector: Air Delivery & Freight Services | |
| MarketCap: 81928.9 Millions | |
| Recent Price: 149.24 Smart Investing & Trading Score: 82 | |
| Day Percent Change: -0.28% Day Change: -0.42 | |
| Week Change: 1.27% Year-to-date Change: -5.1% | |
| UPS Links: Profile News Message Board | |
| Charts:- Daily , Weekly | |
| Add UPS to Watchlist: View: Get UPS Trend Analysis ➞ | |
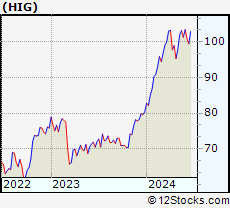 | HIG The Hartford Financial Services Group, Inc. |
| Sector: Financials | |
| SubSector: Property & Casualty Insurance | |
| MarketCap: 12582.8 Millions | |
| Recent Price: 103.17 Smart Investing & Trading Score: 100 | |
| Day Percent Change: 0.98% Day Change: 1.00 | |
| Week Change: 1.26% Year-to-date Change: 28.4% | |
| HIG Links: Profile News Message Board | |
| Charts:- Daily , Weekly | |
| Add HIG to Watchlist: View: Get HIG Trend Analysis ➞ | |
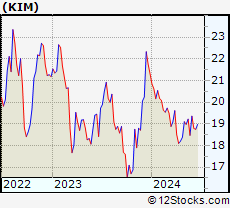 | KIM Kimco Realty Corporation |
| Sector: Financials | |
| SubSector: REIT - Retail | |
| MarketCap: 5358.64 Millions | |
| Recent Price: 19.22 Smart Investing & Trading Score: 42 | |
| Day Percent Change: 0.63% Day Change: 0.12 | |
| Week Change: 1.26% Year-to-date Change: -9.8% | |
| KIM Links: Profile News Message Board | |
| Charts:- Daily , Weekly | |
| Add KIM to Watchlist: View: Get KIM Trend Analysis ➞ | |
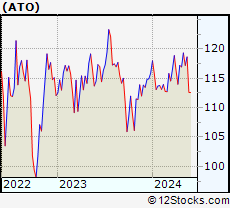 | ATO Atmos Energy Corporation |
| Sector: Utilities | |
| SubSector: Gas Utilities | |
| MarketCap: 11449 Millions | |
| Recent Price: 118.64 Smart Investing & Trading Score: 93 | |
| Day Percent Change: 0.07% Day Change: 0.08 | |
| Week Change: 1.25% Year-to-date Change: 2.4% | |
| ATO Links: Profile News Message Board | |
| Charts:- Daily , Weekly | |
| Add ATO to Watchlist: View: Get ATO Trend Analysis ➞ | |
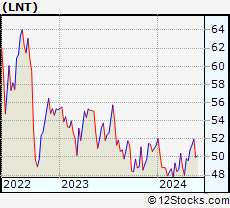 | LNT Alliant Energy Corporation |
| Sector: Utilities | |
| SubSector: Electric Utilities | |
| MarketCap: 10678.4 Millions | |
| Recent Price: 51.97 Smart Investing & Trading Score: 83 | |
| Day Percent Change: 0.00% Day Change: 0.00 | |
| Week Change: 1.25% Year-to-date Change: 1.3% | |
| LNT Links: Profile News Message Board | |
| Charts:- Daily , Weekly | |
| Add LNT to Watchlist: View: Get LNT Trend Analysis ➞ | |
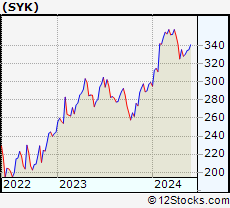 | SYK Stryker Corporation |
| Sector: Health Care | |
| SubSector: Medical Appliances & Equipment | |
| MarketCap: 59441.3 Millions | |
| Recent Price: 334.68 Smart Investing & Trading Score: 43 | |
| Day Percent Change: 0.21% Day Change: 0.70 | |
| Week Change: 1.24% Year-to-date Change: 11.8% | |
| SYK Links: Profile News Message Board | |
| Charts:- Daily , Weekly | |
| Add SYK to Watchlist: View: Get SYK Trend Analysis ➞ | |
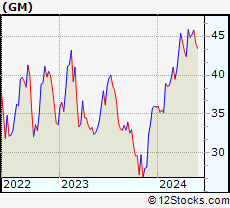 | GM General Motors Company |
| Sector: Consumer Staples | |
| SubSector: Auto Manufacturers - Major | |
| MarketCap: 29252.4 Millions | |
| Recent Price: 45.76 Smart Investing & Trading Score: 83 | |
| Day Percent Change: -0.24% Day Change: -0.11 | |
| Week Change: 1.22% Year-to-date Change: 27.4% | |
| GM Links: Profile News Message Board | |
| Charts:- Daily , Weekly | |
| Add GM to Watchlist: View: Get GM Trend Analysis ➞ | |
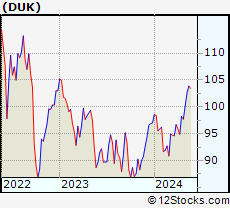 | DUK Duke Energy Corporation |
| Sector: Utilities | |
| SubSector: Electric Utilities | |
| MarketCap: 56678.2 Millions | |
| Recent Price: 103.89 Smart Investing & Trading Score: 95 | |
| Day Percent Change: 1.02% Day Change: 1.05 | |
| Week Change: 1.19% Year-to-date Change: 7.1% | |
| DUK Links: Profile News Message Board | |
| Charts:- Daily , Weekly | |
| Add DUK to Watchlist: View: Get DUK Trend Analysis ➞ | |
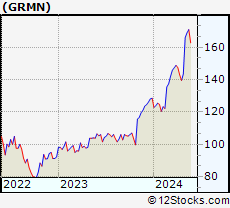 | GRMN Garmin Ltd. |
| Sector: Technology | |
| SubSector: Scientific & Technical Instruments | |
| MarketCap: 13909.3 Millions | |
| Recent Price: 170.94 Smart Investing & Trading Score: 76 | |
| Day Percent Change: 0.56% Day Change: 0.96 | |
| Week Change: 1.19% Year-to-date Change: 33.0% | |
| GRMN Links: Profile News Message Board | |
| Charts:- Daily , Weekly | |
| Add GRMN to Watchlist: View: Get GRMN Trend Analysis ➞ | |
| For tabular summary view of above stock list: Summary View ➞ 0 - 25 , 25 - 50 , 50 - 75 , 75 - 100 , 100 - 125 , 125 - 150 , 150 - 175 , 175 - 200 , 200 - 225 , 225 - 250 , 250 - 275 , 275 - 300 , 300 - 325 , 325 - 350 , 350 - 375 , 375 - 400 , 400 - 425 , 425 - 450 , 450 - 475 , 475 - 500 | ||
| Click To Change The Sort Order: By Market Cap or Company Size Performance: Year-to-date, Week and Day | |
| Select Chart Type: | ||
|
Best Stocks Today 12Stocks.com |
© 2024 12Stocks.com Terms & Conditions Privacy Contact Us
All Information Provided Only For Education And Not To Be Used For Investing or Trading. See Terms & Conditions


One More Thing ... Get Best Stocks Delivered Daily!
Never Ever Miss A Move With Our Top Ten Stocks Lists
Find Best Stocks In Any Market - Bull or Bear Market
Take A Peek At Our Top Ten Stocks Lists: Daily, Weekly, Year-to-Date & Top Trends
Find Best Stocks In Any Market - Bull or Bear Market
Take A Peek At Our Top Ten Stocks Lists: Daily, Weekly, Year-to-Date & Top Trends
S&P 500 Stocks With Best Up Trends [0-bearish to 100-bullish]: Freeport-McMoRan [100], Chubb [100], Tractor Supply[100], DuPont de[100], Arch Capital[100], Air Products[100], Newmont [100], Citizens Financial[100], EQT [100], McKesson [100], Aflac [100]
Best S&P 500 Stocks Year-to-Date:
NVIDIA [86.74%], Constellation [81.97%], NRG [59.19%], Micron [46.81%], Chipotle Mexican[40.51%], Western Digital[37.67%], Leidos Holdings[37.35%], Eaton [37.13%], Arch Capital[35.98%], Arista Networks[35.83%], Targa Resources[35.46%] Best S&P 500 Stocks This Week:
Insulet [12.88%], Moderna [11.23%], Advanced Micro[8.26%], Enphase [7.78%], Chubb [7.63%], Incyte [7.61%], Teradyne [7.31%], Walmart [6.89%], Palo Alto[6.85%], Teleflex [6.72%], AES [6.72%] Best S&P 500 Stocks Daily:
Valero [4.77%], Freeport-McMoRan [4.21%], Chubb [3.55%], Tractor Supply[3.42%], Starbucks [3.41%], DuPont de[3.02%], Marathon [2.80%], Globe Life[2.54%], DaVita [2.45%], American [2.29%], Arch Capital[2.20%]