
 Login Sign Up


| |||||
 |  | ||||

| 12Stocks.com Market Intelligence |
Best S&P 500 Stocks
|
On this page, you will find the most comprehensive analysis of S&P 500 stocks and ETFs - from latest trends to performances to charts ➞. First, here are the year-to-date (YTD) performances of the most requested S&P 500 stocks at 12Stocks.com (click stock for review):
| NVIDIA 87% | ||
| Google 26% | ||
| Walmart 23% | ||
| Amazon.com 22% | ||
| Goldman Sachs 21% | ||
| Caterpillar 21% | ||
| JPMorgan Chase 20% | ||
| Merck 20% | ||
| Microsoft 12% | ||
| Chevron 9% | ||
| Johnson & Johnson -1% | ||
| Apple -1% | ||
| McDonald s -8% | ||
| Gilead -16% | ||
| Starbucks -19% | ||
| Boeing -29% | ||
| Intel -37% | ||
| Quick: S&P 500 Stocks Lists: Performances & Trends, S&P 500 Stock Charts
Sort S&P 500 stocks: Daily, Weekly, Year-to-Date, Market Cap & Trends. Filter S&P 500 stocks list by sector: Show all, Tech, Finance, Energy, Staples, Retail, Industrial, Materials, Utilities and HealthCare |
| 12Stocks.com S&P 500 Stocks Performances & Trends Daily Report | |||||||||
|
| 
The overall Smart Investing & Trading Score is 88 (0-bearish to 100-bullish) which puts S&P 500 index in short term bullish trend. The Smart Investing & Trading Score from previous trading session is 95 and hence a deterioration of trend. | ||||||||
Here are the Smart Investing & Trading Scores of the most requested S&P 500 stocks at 12Stocks.com (click stock name for detailed review):
|


| 12Stocks.com: Top Performing S&P 500 Index Stocks | ||||||||||||||||||||||||||||||||||||||||||||||||
 The top performing S&P 500 Index stocks year to date are
Now, more recently, over last week, the top performing S&P 500 Index stocks on the move are


|
||||||||||||||||||||||||||||||||||||||||||||||||
| 12Stocks.com: Investing in S&P 500 Index with Stocks | |
|
The following table helps investors and traders sort through current performance and trends (as measured by Smart Investing & Trading Score) of various
stocks in the S&P 500 Index. Quick View: Move mouse or cursor over stock symbol (ticker) to view short-term technical chart and over stock name to view long term chart. Click on  to add stock symbol to your watchlist and to add stock symbol to your watchlist and  to view watchlist. Click on any ticker or stock name for detailed market intelligence report for that stock. to view watchlist. Click on any ticker or stock name for detailed market intelligence report for that stock. |
12Stocks.com Performance of Stocks in S&P 500 Index
| Ticker | Stock Name | Watchlist | Category | Recent Price | Smart Investing & Trading Score | Change % | YTD Change% |
| AXP | American Express |   | Financials | 242.82 | 83 | 0.62 | 29.61% |
| TROW | T. Rowe | | Financials | 116.76 | 100 | 0.61 | 8.42% |
| HRL | Hormel Foods | | Consumer Staples | 36.31 | 95 | 0.61 | 13.08% |
| ESS | Essex Property | | Financials | 266.29 | 76 | 0.60 | 7.40% |
| ISRG | Intuitive Surgical | | Health Care | 398.82 | 88 | 0.60 | 18.22% |
| ORLY | O Reilly | | Services & Goods | 1012.06 | 18 | 0.60 | 6.52% |
| CMA | Comerica | | Financials | 54.83 | 88 | 0.59 | -1.76% |
| CZR | Caesars Entertainment | | Services & Goods | 35.52 | 10 | 0.59 | -24.23% |
| PYPL | PayPal Holdings | | Financials | 64.48 | 56 | 0.59 | 5.00% |
| T | AT&T | | Technology | 17.40 | 83 | 0.58 | 3.69% |
| AMZN | Amazon.com | | Services & Goods | 184.70 | 46 | 0.58 | 21.56% |
| EIX | Edison | | Utilities | 76.30 | 95 | 0.58 | 6.73% |
| PSA | Public Storage | | Financials | 288.67 | 95 | 0.57 | -5.35% |
| AZO | AutoZone | | Services & Goods | 2917.50 | 18 | 0.57 | 12.84% |
| ROP | Roper Technologies | | Industrials | 541.89 | 77 | 0.57 | -0.60% |
| BLK | BlackRock | | Financials | 812.22 | 70 | 0.56 | 0.05% |
| GRMN | Garmin | | Technology | 170.94 | 76 | 0.56 | 32.99% |
| IT | Gartner | | Technology | 450.26 | 57 | 0.55 | -0.19% |
| COF | Capital One | | Financials | 141.81 | 26 | 0.54 | 8.15% |
| FOXA | Fox | | Services & Goods | 32.85 | 63 | 0.52 | 10.72% |
| KMI | Kinder Morgan | | Energy | 19.70 | 95 | 0.51 | 11.68% |
| BEN | Franklin Resources | | Financials | 24.28 | 30 | 0.50 | -18.50% |
| EXPE | Expedia | | Services & Goods | 114.01 | 35 | 0.49 | -24.89% |
| ZION | Zions Ban | | Financials | 44.96 | 83 | 0.49 | 2.48% |
| STT | State Street | | Financials | 78.01 | 95 | 0.49 | 0.71% |
| For chart view version of above stock list: Chart View ➞ 0 - 25 , 25 - 50 , 50 - 75 , 75 - 100 , 100 - 125 , 125 - 150 , 150 - 175 , 175 - 200 , 200 - 225 , 225 - 250 , 250 - 275 , 275 - 300 , 300 - 325 , 325 - 350 , 350 - 375 , 375 - 400 , 400 - 425 , 425 - 450 , 450 - 475 , 475 - 500 | ||
 | Click To Change The Sort Order: By Market Cap or Company Size Performance: Year-to-date, Week and Day |  |
|
Get the most comprehensive stock market coverage daily at 12Stocks.com ➞ Best Stocks Today ➞ Best Stocks Weekly ➞ Best Stocks Year-to-Date ➞ Best Stocks Trends ➞  Best Stocks Today 12Stocks.com Best Nasdaq Stocks ➞ Best S&P 500 Stocks ➞ Best Tech Stocks ➞ Best Biotech Stocks ➞ |
| Detailed Overview of S&P 500 Stocks |
| S&P 500 Technical Overview, Leaders & Laggards, Top S&P 500 ETF Funds & Detailed S&P 500 Stocks List, Charts, Trends & More |
| S&P 500: Technical Analysis, Trends & YTD Performance | |
| S&P 500 index as represented by
SPY, an exchange-traded fund [ETF], holds basket of five hundred (mostly largecap) stocks from across all major sectors of the US stock market. The S&P 500 index (contains stocks like Apple and Exxon) is up by 11.39% and is currently outperforming the overall market by 0.82% year-to-date. Below is a quick view of technical charts and trends: | |
 SPY Weekly Chart |
|
| Long Term Trend: Very Good | |
| Medium Term Trend: Very Good | |
 SPY Daily Chart |
|
| Short Term Trend: Good | |
| Overall Trend Score: 88 | |
| YTD Performance: 11.39% | |
| **Trend Scores & Views Are Only For Educational Purposes And Not For Investing | |
| 12Stocks.com: Investing in S&P 500 Index using Exchange Traded Funds | |
|
The following table shows list of key exchange traded funds (ETF) that
help investors track S&P 500 index. The following list also includes leveraged ETF funds that track twice or thrice the daily returns of S&P 500 indices. Short or inverse ETF funds move in the opposite direction to the index they track and are useful during market pullbacks or during bear markets. Quick View: Move mouse or cursor over ETF symbol (ticker) to view short-term technical chart and over ETF name to view long term chart. Click on ticker or stock name for detailed view. Click on to add stock symbol to your watchlist and to view watchlist. |
12Stocks.com List of ETFs that track S&P 500 Index
| Ticker | ETF Name | Watchlist | Recent Price | Smart Investing & Trading Score | Change % | Week % | Year-to-date % |
| SPY | SPDR S&P 500 ETF | | 529.45 | 88 | 0.14 | 1.65 | 11.39% |
| IVV | iShares Core S&P 500 ETF | | 532.13 | 83 | -0.34 | 1.67 | 11.41% |
| VOO | Vanguard 500 ETF | | 486.69 | 83 | -0.32 | 1.66 | 11.42% |
| OEF | iShares S&P 100 | | 252.41 | 83 | 0.12 | 1.84 | 12.99% |
| SSO | ProShares Ultra S&P500 | | 78.55 | 83 | 0.32 | 3.18 | 20.72% |
| UPRO | ProShares UltraPro S&P500 | | 71.44 | 88 | 0.39 | 4.7 | 30.51% |
| SPXL | Direxion Daily S&P500 Bull 3X ETF | | 135.59 | 83 | -1.13 | 4.66 | 30.39% |
| SH | ProShares Short S&P500 | | 11.85 | 17 | -0.08 | -1.41 | -8.78% |
| SDS | ProShares UltraShort S&P500 | | 24.60 | 17 | -0.24 | -2.96 | -17.78% |
| SPXU | ProShares UltraPro Short S&P500 | | 31.63 | 17 | -0.41 | -4.47 | -26.44% |
| SPXS | Direxion Daily S&P 500 Bear 3X ETF | | 8.56 | 17 | 1.18 | -4.57 | -25.89% |
| 12Stocks.com: Charts, Trends, Fundamental Data and Performances of S&P 500 Stocks | |
|
We now take in-depth look at all S&P 500 stocks including charts, multi-period performances and overall trends (as measured by Smart Investing & Trading Score). One can sort S&P 500 stocks (click link to choose) by Daily, Weekly and by Year-to-Date performances. Also, one can sort by size of the company or by market capitalization. |
| Select Your Default Chart Type: | |||||
| |||||
| Click on stock symbol or name for detailed view. Click on to add stock symbol to your watchlist and to view watchlist. Quick View: Move mouse or cursor over "Daily" to quickly view daily technical stock chart and over "Weekly" to view weekly technical stock chart. | |||||

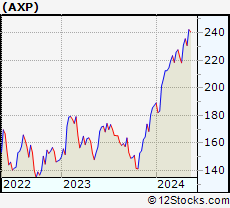 | AXP American Express Company |
| Sector: Financials | |
| SubSector: Credit Services | |
| MarketCap: 68388 Millions | |
| Recent Price: 242.82 Smart Investing & Trading Score: 83 | |
| Day Percent Change: 0.62% Day Change: 1.50 | |
| Week Change: 0.21% Year-to-date Change: 29.6% | |
| AXP Links: Profile News Message Board | |
| Charts:- Daily , Weekly | |
| Add AXP to Watchlist: View: Get AXP Trend Analysis ➞ | |
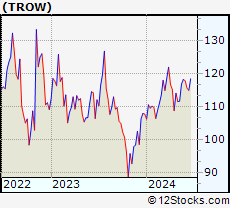 | TROW T. Rowe Price Group, Inc. |
| Sector: Financials | |
| SubSector: Asset Management | |
| MarketCap: 24530 Millions | |
| Recent Price: 116.76 Smart Investing & Trading Score: 100 | |
| Day Percent Change: 0.61% Day Change: 0.71 | |
| Week Change: 4.62% Year-to-date Change: 8.4% | |
| TROW Links: Profile News Message Board | |
| Charts:- Daily , Weekly | |
| Add TROW to Watchlist: View: Get TROW Trend Analysis ➞ | |
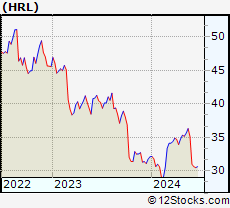 | HRL Hormel Foods Corporation |
| Sector: Consumer Staples | |
| SubSector: Meat Products | |
| MarketCap: 25590.2 Millions | |
| Recent Price: 36.31 Smart Investing & Trading Score: 95 | |
| Day Percent Change: 0.61% Day Change: 0.22 | |
| Week Change: 1.91% Year-to-date Change: 13.1% | |
| HRL Links: Profile News Message Board | |
| Charts:- Daily , Weekly | |
| Add HRL to Watchlist: View: Get HRL Trend Analysis ➞ | |
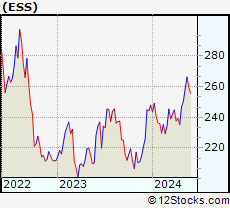 | ESS Essex Property Trust, Inc. |
| Sector: Financials | |
| SubSector: REIT - Residential | |
| MarketCap: 13725.5 Millions | |
| Recent Price: 266.29 Smart Investing & Trading Score: 76 | |
| Day Percent Change: 0.60% Day Change: 1.58 | |
| Week Change: 2.83% Year-to-date Change: 7.4% | |
| ESS Links: Profile News Message Board | |
| Charts:- Daily , Weekly | |
| Add ESS to Watchlist: View: Get ESS Trend Analysis ➞ | |
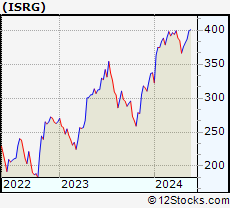 | ISRG Intuitive Surgical, Inc. |
| Sector: Health Care | |
| SubSector: Medical Instruments & Supplies | |
| MarketCap: 50917.5 Millions | |
| Recent Price: 398.82 Smart Investing & Trading Score: 88 | |
| Day Percent Change: 0.60% Day Change: 2.39 | |
| Week Change: 3.13% Year-to-date Change: 18.2% | |
| ISRG Links: Profile News Message Board | |
| Charts:- Daily , Weekly | |
| Add ISRG to Watchlist: View: Get ISRG Trend Analysis ➞ | |
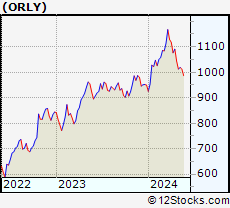 | ORLY O Reilly Automotive, Inc. |
| Sector: Services & Goods | |
| SubSector: Auto Parts Stores | |
| MarketCap: 22391.5 Millions | |
| Recent Price: 1012.06 Smart Investing & Trading Score: 18 | |
| Day Percent Change: 0.60% Day Change: 6.08 | |
| Week Change: -0.71% Year-to-date Change: 6.5% | |
| ORLY Links: Profile News Message Board | |
| Charts:- Daily , Weekly | |
| Add ORLY to Watchlist: View: Get ORLY Trend Analysis ➞ | |
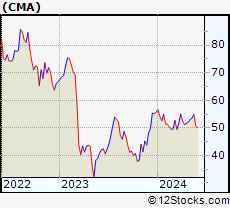 | CMA Comerica Incorporated |
| Sector: Financials | |
| SubSector: Money Center Banks | |
| MarketCap: 4449.49 Millions | |
| Recent Price: 54.83 Smart Investing & Trading Score: 88 | |
| Day Percent Change: 0.59% Day Change: 0.32 | |
| Week Change: 2.35% Year-to-date Change: -1.8% | |
| CMA Links: Profile News Message Board | |
| Charts:- Daily , Weekly | |
| Add CMA to Watchlist: View: Get CMA Trend Analysis ➞ | |
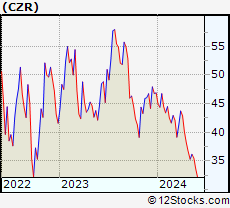 | CZR Caesars Entertainment Corporation |
| Sector: Services & Goods | |
| SubSector: Resorts & Casinos | |
| MarketCap: 4618.44 Millions | |
| Recent Price: 35.52 Smart Investing & Trading Score: 10 | |
| Day Percent Change: 0.59% Day Change: 0.21 | |
| Week Change: -1.82% Year-to-date Change: -24.2% | |
| CZR Links: Profile News Message Board | |
| Charts:- Daily , Weekly | |
| Add CZR to Watchlist: View: Get CZR Trend Analysis ➞ | |
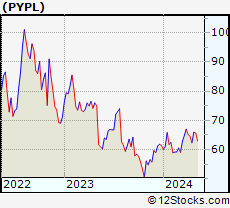 | PYPL PayPal Holdings, Inc. |
| Sector: Financials | |
| SubSector: Credit Services | |
| MarketCap: 108949 Millions | |
| Recent Price: 64.48 Smart Investing & Trading Score: 56 | |
| Day Percent Change: 0.59% Day Change: 0.38 | |
| Week Change: 2.46% Year-to-date Change: 5.0% | |
| PYPL Links: Profile News Message Board | |
| Charts:- Daily , Weekly | |
| Add PYPL to Watchlist: View: Get PYPL Trend Analysis ➞ | |
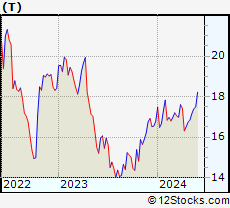 | T AT&T Inc. |
| Sector: Technology | |
| SubSector: Telecom Services - Domestic | |
| MarketCap: 224847 Millions | |
| Recent Price: 17.40 Smart Investing & Trading Score: 83 | |
| Day Percent Change: 0.58% Day Change: 0.10 | |
| Week Change: 1.34% Year-to-date Change: 3.7% | |
| T Links: Profile News Message Board | |
| Charts:- Daily , Weekly | |
| Add T to Watchlist: View: Get T Trend Analysis ➞ | |
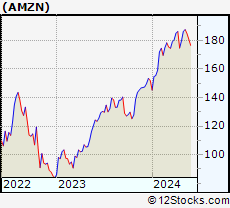 | AMZN Amazon.com, Inc. |
| Sector: Services & Goods | |
| SubSector: Catalog & Mail Order Houses | |
| MarketCap: 998070 Millions | |
| Recent Price: 184.70 Smart Investing & Trading Score: 46 | |
| Day Percent Change: 0.58% Day Change: 1.07 | |
| Week Change: -1.48% Year-to-date Change: 21.6% | |
| AMZN Links: Profile News Message Board | |
| Charts:- Daily , Weekly | |
| Add AMZN to Watchlist: View: Get AMZN Trend Analysis ➞ | |
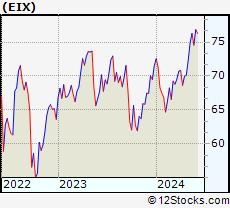 | EIX Edison International |
| Sector: Utilities | |
| SubSector: Electric Utilities | |
| MarketCap: 19358.1 Millions | |
| Recent Price: 76.30 Smart Investing & Trading Score: 95 | |
| Day Percent Change: 0.58% Day Change: 0.44 | |
| Week Change: 1.88% Year-to-date Change: 6.7% | |
| EIX Links: Profile News Message Board | |
| Charts:- Daily , Weekly | |
| Add EIX to Watchlist: View: Get EIX Trend Analysis ➞ | |
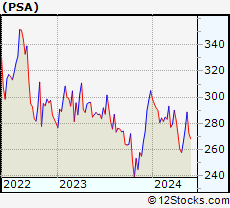 | PSA Public Storage |
| Sector: Financials | |
| SubSector: REIT - Industrial | |
| MarketCap: 32733.9 Millions | |
| Recent Price: 288.67 Smart Investing & Trading Score: 95 | |
| Day Percent Change: 0.57% Day Change: 1.65 | |
| Week Change: 4.61% Year-to-date Change: -5.4% | |
| PSA Links: Profile News Message Board | |
| Charts:- Daily , Weekly | |
| Add PSA to Watchlist: View: Get PSA Trend Analysis ➞ | |
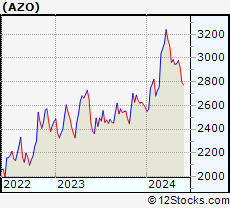 | AZO AutoZone, Inc. |
| Sector: Services & Goods | |
| SubSector: Auto Parts Stores | |
| MarketCap: 19128 Millions | |
| Recent Price: 2917.50 Smart Investing & Trading Score: 18 | |
| Day Percent Change: 0.57% Day Change: 16.51 | |
| Week Change: -2.07% Year-to-date Change: 12.8% | |
| AZO Links: Profile News Message Board | |
| Charts:- Daily , Weekly | |
| Add AZO to Watchlist: View: Get AZO Trend Analysis ➞ | |
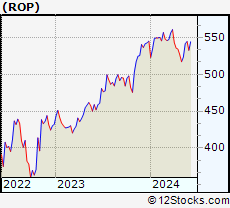 | ROP Roper Technologies, Inc. |
| Sector: Industrials | |
| SubSector: Diversified Machinery | |
| MarketCap: 33366.2 Millions | |
| Recent Price: 541.89 Smart Investing & Trading Score: 77 | |
| Day Percent Change: 0.57% Day Change: 3.09 | |
| Week Change: 3.51% Year-to-date Change: -0.6% | |
| ROP Links: Profile News Message Board | |
| Charts:- Daily , Weekly | |
| Add ROP to Watchlist: View: Get ROP Trend Analysis ➞ | |
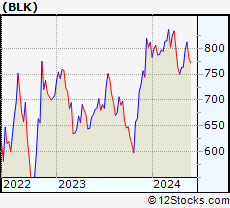 | BLK BlackRock, Inc. |
| Sector: Financials | |
| SubSector: Asset Management | |
| MarketCap: 61284.9 Millions | |
| Recent Price: 812.22 Smart Investing & Trading Score: 70 | |
| Day Percent Change: 0.56% Day Change: 4.51 | |
| Week Change: 1.95% Year-to-date Change: 0.1% | |
| BLK Links: Profile News Message Board | |
| Charts:- Daily , Weekly | |
| Add BLK to Watchlist: View: Get BLK Trend Analysis ➞ | |
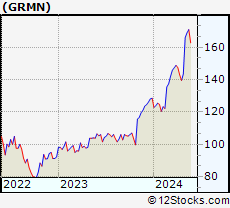 | GRMN Garmin Ltd. |
| Sector: Technology | |
| SubSector: Scientific & Technical Instruments | |
| MarketCap: 13909.3 Millions | |
| Recent Price: 170.94 Smart Investing & Trading Score: 76 | |
| Day Percent Change: 0.56% Day Change: 0.96 | |
| Week Change: 1.19% Year-to-date Change: 33.0% | |
| GRMN Links: Profile News Message Board | |
| Charts:- Daily , Weekly | |
| Add GRMN to Watchlist: View: Get GRMN Trend Analysis ➞ | |
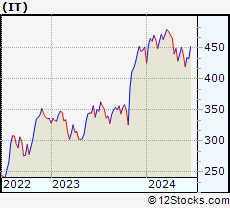 | IT Gartner, Inc. |
| Sector: Technology | |
| SubSector: Information Technology Services | |
| MarketCap: 7767.98 Millions | |
| Recent Price: 450.26 Smart Investing & Trading Score: 57 | |
| Day Percent Change: 0.55% Day Change: 2.48 | |
| Week Change: 2.5% Year-to-date Change: -0.2% | |
| IT Links: Profile News Message Board | |
| Charts:- Daily , Weekly | |
| Add IT to Watchlist: View: Get IT Trend Analysis ➞ | |
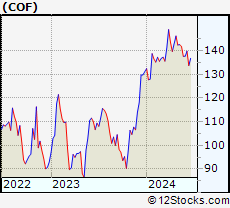 | COF Capital One Financial Corporation |
| Sector: Financials | |
| SubSector: Credit Services | |
| MarketCap: 23094.2 Millions | |
| Recent Price: 141.81 Smart Investing & Trading Score: 26 | |
| Day Percent Change: 0.54% Day Change: 0.76 | |
| Week Change: -0.53% Year-to-date Change: 8.2% | |
| COF Links: Profile News Message Board | |
| Charts:- Daily , Weekly | |
| Add COF to Watchlist: View: Get COF Trend Analysis ➞ | |
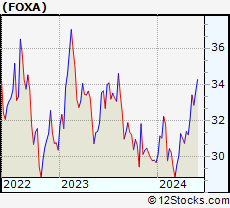 | FOXA Fox Corporation |
| Sector: Services & Goods | |
| SubSector: Entertainment - Diversified | |
| MarketCap: 13440.7 Millions | |
| Recent Price: 32.85 Smart Investing & Trading Score: 63 | |
| Day Percent Change: 0.52% Day Change: 0.17 | |
| Week Change: -1.68% Year-to-date Change: 10.7% | |
| FOXA Links: Profile News Message Board | |
| Charts:- Daily , Weekly | |
| Add FOXA to Watchlist: View: Get FOXA Trend Analysis ➞ | |
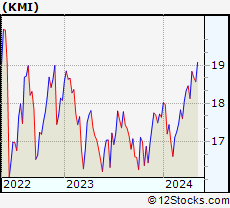 | KMI Kinder Morgan, Inc. |
| Sector: Energy | |
| SubSector: Oil & Gas Pipelines | |
| MarketCap: 31283.5 Millions | |
| Recent Price: 19.70 Smart Investing & Trading Score: 95 | |
| Day Percent Change: 0.51% Day Change: 0.10 | |
| Week Change: 3.25% Year-to-date Change: 11.7% | |
| KMI Links: Profile News Message Board | |
| Charts:- Daily , Weekly | |
| Add KMI to Watchlist: View: Get KMI Trend Analysis ➞ | |
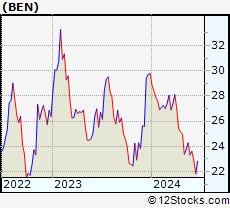 | BEN Franklin Resources, Inc. |
| Sector: Financials | |
| SubSector: Asset Management | |
| MarketCap: 9419.73 Millions | |
| Recent Price: 24.28 Smart Investing & Trading Score: 30 | |
| Day Percent Change: 0.50% Day Change: 0.12 | |
| Week Change: 2.27% Year-to-date Change: -18.5% | |
| BEN Links: Profile News Message Board | |
| Charts:- Daily , Weekly | |
| Add BEN to Watchlist: View: Get BEN Trend Analysis ➞ | |
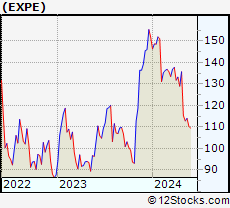 | EXPE Expedia Group, Inc. |
| Sector: Services & Goods | |
| SubSector: Lodging | |
| MarketCap: 8052.96 Millions | |
| Recent Price: 114.01 Smart Investing & Trading Score: 35 | |
| Day Percent Change: 0.49% Day Change: 0.56 | |
| Week Change: 1.04% Year-to-date Change: -24.9% | |
| EXPE Links: Profile News Message Board | |
| Charts:- Daily , Weekly | |
| Add EXPE to Watchlist: View: Get EXPE Trend Analysis ➞ | |
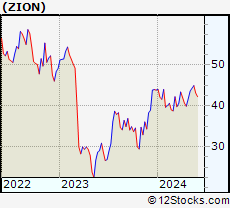 | ZION Zions Bancorporation, National Association |
| Sector: Financials | |
| SubSector: Regional - Pacific Banks | |
| MarketCap: 4577.89 Millions | |
| Recent Price: 44.96 Smart Investing & Trading Score: 83 | |
| Day Percent Change: 0.49% Day Change: 0.22 | |
| Week Change: 1.44% Year-to-date Change: 2.5% | |
| ZION Links: Profile News Message Board | |
| Charts:- Daily , Weekly | |
| Add ZION to Watchlist: View: Get ZION Trend Analysis ➞ | |
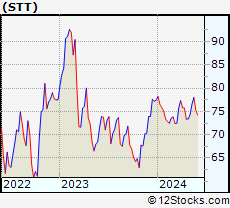 | STT State Street Corporation |
| Sector: Financials | |
| SubSector: Asset Management | |
| MarketCap: 18623 Millions | |
| Recent Price: 78.01 Smart Investing & Trading Score: 95 | |
| Day Percent Change: 0.49% Day Change: 0.38 | |
| Week Change: 1.87% Year-to-date Change: 0.7% | |
| STT Links: Profile News Message Board | |
| Charts:- Daily , Weekly | |
| Add STT to Watchlist: View: Get STT Trend Analysis ➞ | |
| For tabular summary view of above stock list: Summary View ➞ 0 - 25 , 25 - 50 , 50 - 75 , 75 - 100 , 100 - 125 , 125 - 150 , 150 - 175 , 175 - 200 , 200 - 225 , 225 - 250 , 250 - 275 , 275 - 300 , 300 - 325 , 325 - 350 , 350 - 375 , 375 - 400 , 400 - 425 , 425 - 450 , 450 - 475 , 475 - 500 | ||
| Click To Change The Sort Order: By Market Cap or Company Size Performance: Year-to-date, Week and Day | |
| Select Chart Type: | ||
|
Best Stocks Today 12Stocks.com |
© 2024 12Stocks.com Terms & Conditions Privacy Contact Us
All Information Provided Only For Education And Not To Be Used For Investing or Trading. See Terms & Conditions


One More Thing ... Get Best Stocks Delivered Daily!
Never Ever Miss A Move With Our Top Ten Stocks Lists
Find Best Stocks In Any Market - Bull or Bear Market
Take A Peek At Our Top Ten Stocks Lists: Daily, Weekly, Year-to-Date & Top Trends
Find Best Stocks In Any Market - Bull or Bear Market
Take A Peek At Our Top Ten Stocks Lists: Daily, Weekly, Year-to-Date & Top Trends
S&P 500 Stocks With Best Up Trends [0-bearish to 100-bullish]: Freeport-McMoRan [100], Chubb [100], Tractor Supply[100], DuPont de[100], Arch Capital[100], Air Products[100], Newmont [100], Citizens Financial[100], EQT [100], McKesson [100], Aflac [100]
Best S&P 500 Stocks Year-to-Date:
NVIDIA [86.74%], Constellation [81.97%], NRG [59.19%], Micron [46.81%], Chipotle Mexican[40.51%], Western Digital[37.67%], Leidos Holdings[37.35%], Eaton [37.13%], Arch Capital[35.98%], Arista Networks[35.83%], Targa Resources[35.46%] Best S&P 500 Stocks This Week:
Insulet [12.88%], Moderna [11.23%], Advanced Micro[8.26%], Enphase [7.78%], Chubb [7.63%], Incyte [7.61%], Teradyne [7.31%], Walmart [6.89%], Palo Alto[6.85%], Teleflex [6.72%], AES [6.72%] Best S&P 500 Stocks Daily:
Valero [4.77%], Freeport-McMoRan [4.21%], Chubb [3.55%], Tractor Supply[3.42%], Starbucks [3.41%], DuPont de[3.02%], Marathon [2.80%], Globe Life[2.54%], DaVita [2.45%], American [2.29%], Arch Capital[2.20%]