
 Login Sign Up


| |||||
 |  | ||||

| 12Stocks.com Market Intelligence |
Best S&P 500 Stocks
|
On this page, you will find the most comprehensive analysis of S&P 500 stocks and ETFs - from latest trends to performances to charts ➞. First, here are the year-to-date (YTD) performances of the most requested S&P 500 stocks at 12Stocks.com (click stock for review):
| NVIDIA 87% | ||
| Google 26% | ||
| Walmart 23% | ||
| Amazon.com 22% | ||
| Goldman Sachs 21% | ||
| Caterpillar 21% | ||
| JPMorgan Chase 20% | ||
| Merck 20% | ||
| Microsoft 12% | ||
| Chevron 9% | ||
| Johnson & Johnson -1% | ||
| Apple -1% | ||
| McDonald s -8% | ||
| Gilead -16% | ||
| Starbucks -19% | ||
| Boeing -29% | ||
| Intel -37% | ||
| Quick: S&P 500 Stocks Lists: Performances & Trends, S&P 500 Stock Charts
Sort S&P 500 stocks: Daily, Weekly, Year-to-Date, Market Cap & Trends. Filter S&P 500 stocks list by sector: Show all, Tech, Finance, Energy, Staples, Retail, Industrial, Materials, Utilities and HealthCare |
| 12Stocks.com S&P 500 Stocks Performances & Trends Daily Report | |||||||||
|
| 
The overall Smart Investing & Trading Score is 88 (0-bearish to 100-bullish) which puts S&P 500 index in short term bullish trend. The Smart Investing & Trading Score from previous trading session is 95 and hence a deterioration of trend. | ||||||||
Here are the Smart Investing & Trading Scores of the most requested S&P 500 stocks at 12Stocks.com (click stock name for detailed review):
|


| 12Stocks.com: Top Performing S&P 500 Index Stocks | ||||||||||||||||||||||||||||||||||||||||||||||||
 The top performing S&P 500 Index stocks year to date are
Now, more recently, over last week, the top performing S&P 500 Index stocks on the move are


|
||||||||||||||||||||||||||||||||||||||||||||||||
| 12Stocks.com: Investing in S&P 500 Index with Stocks | |
|
The following table helps investors and traders sort through current performance and trends (as measured by Smart Investing & Trading Score) of various
stocks in the S&P 500 Index. Quick View: Move mouse or cursor over stock symbol (ticker) to view short-term technical chart and over stock name to view long term chart. Click on  to add stock symbol to your watchlist and to add stock symbol to your watchlist and  to view watchlist. Click on any ticker or stock name for detailed market intelligence report for that stock. to view watchlist. Click on any ticker or stock name for detailed market intelligence report for that stock. |
12Stocks.com Performance of Stocks in S&P 500 Index
| Ticker | Stock Name | Watchlist | Category | Recent Price | Smart Investing & Trading Score | Change % | YTD Change% |
| APD | Air Products |   | Materials | 262.70 | 100 | 2.20% | -4.05% |
| CF | CF Industries | | Materials | 76.22 | 49 | -1.42% | -4.13% |
| USB | U.S. Bancorp | | Financials | 41.43 | 30 | -0.53% | -4.27% |
| ITW | Illinois Tool | | Industrials | 250.60 | 52 | 0.33% | -4.33% |
| ROST | Ross Stores | | Services & Goods | 132.33 | 25 | -1.50% | -4.38% |
| LVS | Las Vegas | | Services & Goods | 47.03 | 64 | 0.88% | -4.43% |
| KVUE | Kenvue | | Consumer Staples | 20.47 | 76 | -0.63% | -4.61% |
| CSCO | Cisco Systems | | Technology | 48.17 | 38 | -0.35% | -4.65% |
| VICI | VICI Properties | | Financials | 30.38 | 88 | 0.33% | -4.71% |
| CLX | Clorox | | Consumer Staples | 135.62 | 0 | -0.99% | -4.89% |
| UPS | United Parcel | | Transports | 149.24 | 82 | -0.28% | -5.08% |
| KMX | CarMax | | Services & Goods | 72.82 | 32 | -0.22% | -5.11% |
| EXR | Extra Space | | Financials | 151.89 | 83 | 0.36% | -5.26% |
| PSA | Public Storage | | Financials | 288.67 | 95 | 0.57% | -5.35% |
| HST | Host Hotels | | Financials | 18.42 | 18 | -1.76% | -5.39% |
| ABT | Abbott | | Health Care | 104.09 | 18 | -0.74% | -5.43% |
| FDS | FactSet Research | | Technology | 448.88 | 59 | 0.75% | -5.91% |
| MNST | Monster Beverage | | Consumer Staples | 54.11 | 40 | 0.04% | -6.08% |
| CRL | Charles River | | Health Care | 221.61 | 0 | -1.40% | -6.26% |
| DRI | Darden Restaurants | | Services & Goods | 154.00 | 49 | 1.70% | -6.27% |
| BBY | Best Buy | | Services & Goods | 73.35 | 7 | -0.39% | -6.30% |
| LKQ | LKQ | | Consumer Staples | 44.67 | 64 | 1.18% | -6.53% |
| EA | Electronic Arts | | Technology | 127.75 | 33 | -1.09% | -6.62% |
| SLB | Schlumberger | | Energy | 48.59 | 38 | 0.35% | -6.63% |
| EXPD | Expeditors | | Transports | 117.90 | 47 | 0.22% | -7.31% |
| For chart view version of above stock list: Chart View ➞ 0 - 25 , 25 - 50 , 50 - 75 , 75 - 100 , 100 - 125 , 125 - 150 , 150 - 175 , 175 - 200 , 200 - 225 , 225 - 250 , 250 - 275 , 275 - 300 , 300 - 325 , 325 - 350 , 350 - 375 , 375 - 400 , 400 - 425 , 425 - 450 , 450 - 475 , 475 - 500 | ||
 | Click To Change The Sort Order: By Market Cap or Company Size Performance: Year-to-date, Week and Day |  |
|
Get the most comprehensive stock market coverage daily at 12Stocks.com ➞ Best Stocks Today ➞ Best Stocks Weekly ➞ Best Stocks Year-to-Date ➞ Best Stocks Trends ➞  Best Stocks Today 12Stocks.com Best Nasdaq Stocks ➞ Best S&P 500 Stocks ➞ Best Tech Stocks ➞ Best Biotech Stocks ➞ |
| Detailed Overview of S&P 500 Stocks |
| S&P 500 Technical Overview, Leaders & Laggards, Top S&P 500 ETF Funds & Detailed S&P 500 Stocks List, Charts, Trends & More |
| S&P 500: Technical Analysis, Trends & YTD Performance | |
| S&P 500 index as represented by
SPY, an exchange-traded fund [ETF], holds basket of five hundred (mostly largecap) stocks from across all major sectors of the US stock market. The S&P 500 index (contains stocks like Apple and Exxon) is up by 11.39% and is currently outperforming the overall market by 0.82% year-to-date. Below is a quick view of technical charts and trends: | |
 SPY Weekly Chart |
|
| Long Term Trend: Very Good | |
| Medium Term Trend: Very Good | |
 SPY Daily Chart |
|
| Short Term Trend: Good | |
| Overall Trend Score: 88 | |
| YTD Performance: 11.39% | |
| **Trend Scores & Views Are Only For Educational Purposes And Not For Investing | |
| 12Stocks.com: Investing in S&P 500 Index using Exchange Traded Funds | |
|
The following table shows list of key exchange traded funds (ETF) that
help investors track S&P 500 index. The following list also includes leveraged ETF funds that track twice or thrice the daily returns of S&P 500 indices. Short or inverse ETF funds move in the opposite direction to the index they track and are useful during market pullbacks or during bear markets. Quick View: Move mouse or cursor over ETF symbol (ticker) to view short-term technical chart and over ETF name to view long term chart. Click on ticker or stock name for detailed view. Click on to add stock symbol to your watchlist and to view watchlist. |
12Stocks.com List of ETFs that track S&P 500 Index
| Ticker | ETF Name | Watchlist | Recent Price | Smart Investing & Trading Score | Change % | Week % | Year-to-date % |
| SPY | SPDR S&P 500 ETF | | 529.45 | 88 | 0.14 | 1.65 | 11.39% |
| IVV | iShares Core S&P 500 ETF | | 532.13 | 83 | -0.34 | 1.67 | 11.41% |
| VOO | Vanguard 500 ETF | | 486.69 | 83 | -0.32 | 1.66 | 11.42% |
| OEF | iShares S&P 100 | | 252.41 | 83 | 0.12 | 1.84 | 12.99% |
| SSO | ProShares Ultra S&P500 | | 78.55 | 83 | 0.32 | 3.18 | 20.72% |
| UPRO | ProShares UltraPro S&P500 | | 71.44 | 88 | 0.39 | 4.7 | 30.51% |
| SPXL | Direxion Daily S&P500 Bull 3X ETF | | 135.59 | 83 | -1.13 | 4.66 | 30.39% |
| SH | ProShares Short S&P500 | | 11.85 | 17 | -0.08 | -1.41 | -8.78% |
| SDS | ProShares UltraShort S&P500 | | 24.60 | 17 | -0.24 | -2.96 | -17.78% |
| SPXU | ProShares UltraPro Short S&P500 | | 31.63 | 17 | -0.41 | -4.47 | -26.44% |
| SPXS | Direxion Daily S&P 500 Bear 3X ETF | | 8.56 | 17 | 1.18 | -4.57 | -25.89% |
| 12Stocks.com: Charts, Trends, Fundamental Data and Performances of S&P 500 Stocks | |
|
We now take in-depth look at all S&P 500 stocks including charts, multi-period performances and overall trends (as measured by Smart Investing & Trading Score). One can sort S&P 500 stocks (click link to choose) by Daily, Weekly and by Year-to-Date performances. Also, one can sort by size of the company or by market capitalization. |
| Select Your Default Chart Type: | |||||
| |||||
| Click on stock symbol or name for detailed view. Click on to add stock symbol to your watchlist and to view watchlist. Quick View: Move mouse or cursor over "Daily" to quickly view daily technical stock chart and over "Weekly" to view weekly technical stock chart. | |||||

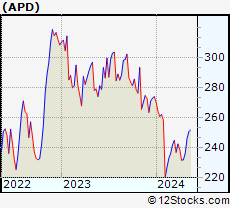 | APD Air Products and Chemicals, Inc. |
| Sector: Materials | |
| SubSector: Chemicals - Major Diversified | |
| MarketCap: 46203.6 Millions | |
| Recent Price: 262.70 Smart Investing & Trading Score: 100 | |
| Day Percent Change: 2.20% Day Change: 5.66 | |
| Week Change: 4.85% Year-to-date Change: -4.1% | |
| APD Links: Profile News Message Board | |
| Charts:- Daily , Weekly | |
| Add APD to Watchlist: View: Get APD Trend Analysis ➞ | |
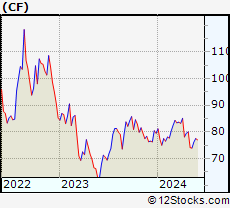 | CF CF Industries Holdings, Inc. |
| Sector: Materials | |
| SubSector: Agricultural Chemicals | |
| MarketCap: 5581.89 Millions | |
| Recent Price: 76.22 Smart Investing & Trading Score: 49 | |
| Day Percent Change: -1.42% Day Change: -1.10 | |
| Week Change: 3.07% Year-to-date Change: -4.1% | |
| CF Links: Profile News Message Board | |
| Charts:- Daily , Weekly | |
| Add CF to Watchlist: View: Get CF Trend Analysis ➞ | |
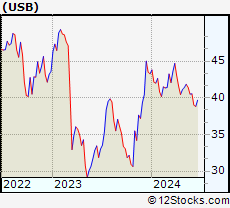 | USB U.S. Bancorp |
| Sector: Financials | |
| SubSector: Regional - Midwest Banks | |
| MarketCap: 56757.8 Millions | |
| Recent Price: 41.43 Smart Investing & Trading Score: 30 | |
| Day Percent Change: -0.53% Day Change: -0.22 | |
| Week Change: -1% Year-to-date Change: -4.3% | |
| USB Links: Profile News Message Board | |
| Charts:- Daily , Weekly | |
| Add USB to Watchlist: View: Get USB Trend Analysis ➞ | |
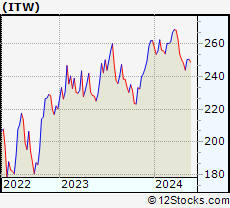 | ITW Illinois Tool Works Inc. |
| Sector: Industrials | |
| SubSector: Diversified Machinery | |
| MarketCap: 45324.8 Millions | |
| Recent Price: 250.60 Smart Investing & Trading Score: 52 | |
| Day Percent Change: 0.33% Day Change: 0.83 | |
| Week Change: 0.11% Year-to-date Change: -4.3% | |
| ITW Links: Profile News Message Board | |
| Charts:- Daily , Weekly | |
| Add ITW to Watchlist: View: Get ITW Trend Analysis ➞ | |
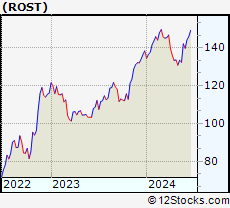 | ROST Ross Stores, Inc. |
| Sector: Services & Goods | |
| SubSector: Apparel Stores | |
| MarketCap: 24938.8 Millions | |
| Recent Price: 132.33 Smart Investing & Trading Score: 25 | |
| Day Percent Change: -1.50% Day Change: -2.01 | |
| Week Change: -0.86% Year-to-date Change: -4.4% | |
| ROST Links: Profile News Message Board | |
| Charts:- Daily , Weekly | |
| Add ROST to Watchlist: View: Get ROST Trend Analysis ➞ | |
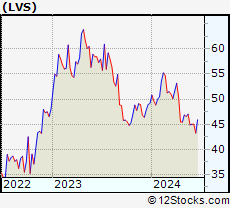 | LVS Las Vegas Sands Corp. |
| Sector: Services & Goods | |
| SubSector: Resorts & Casinos | |
| MarketCap: 36431.6 Millions | |
| Recent Price: 47.03 Smart Investing & Trading Score: 64 | |
| Day Percent Change: 0.88% Day Change: 0.41 | |
| Week Change: 1.05% Year-to-date Change: -4.4% | |
| LVS Links: Profile News Message Board | |
| Charts:- Daily , Weekly | |
| Add LVS to Watchlist: View: Get LVS Trend Analysis ➞ | |
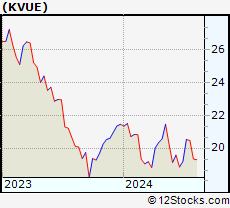 | KVUE Kenvue Inc. |
| Sector: Consumer Staples | |
| SubSector: Household & Personal Products | |
| MarketCap: 50220 Millions | |
| Recent Price: 20.47 Smart Investing & Trading Score: 76 | |
| Day Percent Change: -0.63% Day Change: -0.13 | |
| Week Change: -0.34% Year-to-date Change: -4.6% | |
| KVUE Links: Profile News Message Board | |
| Charts:- Daily , Weekly | |
| Add KVUE to Watchlist: View: Get KVUE Trend Analysis ➞ | |
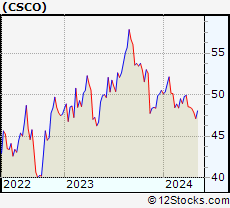 | CSCO Cisco Systems, Inc. |
| Sector: Technology | |
| SubSector: Communication Equipment | |
| MarketCap: 168483 Millions | |
| Recent Price: 48.17 Smart Investing & Trading Score: 38 | |
| Day Percent Change: -0.35% Day Change: -0.17 | |
| Week Change: 0.23% Year-to-date Change: -4.7% | |
| CSCO Links: Profile News Message Board | |
| Charts:- Daily , Weekly | |
| Add CSCO to Watchlist: View: Get CSCO Trend Analysis ➞ | |
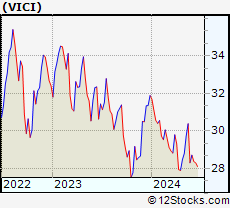 | VICI VICI Properties Inc. |
| Sector: Financials | |
| SubSector: REIT - Diversified | |
| MarketCap: 7327.03 Millions | |
| Recent Price: 30.38 Smart Investing & Trading Score: 88 | |
| Day Percent Change: 0.33% Day Change: 0.10 | |
| Week Change: 2.2% Year-to-date Change: -4.7% | |
| VICI Links: Profile News Message Board | |
| Charts:- Daily , Weekly | |
| Add VICI to Watchlist: View: Get VICI Trend Analysis ➞ | |
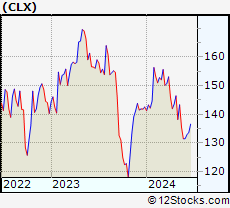 | CLX The Clorox Company |
| Sector: Consumer Staples | |
| SubSector: Housewares & Accessories | |
| MarketCap: 23688.3 Millions | |
| Recent Price: 135.62 Smart Investing & Trading Score: 0 | |
| Day Percent Change: -0.99% Day Change: -1.35 | |
| Week Change: -5.39% Year-to-date Change: -4.9% | |
| CLX Links: Profile News Message Board | |
| Charts:- Daily , Weekly | |
| Add CLX to Watchlist: View: Get CLX Trend Analysis ➞ | |
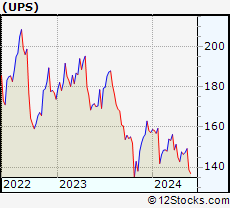 | UPS United Parcel Service, Inc. |
| Sector: Transports | |
| SubSector: Air Delivery & Freight Services | |
| MarketCap: 81928.9 Millions | |
| Recent Price: 149.24 Smart Investing & Trading Score: 82 | |
| Day Percent Change: -0.28% Day Change: -0.42 | |
| Week Change: 1.27% Year-to-date Change: -5.1% | |
| UPS Links: Profile News Message Board | |
| Charts:- Daily , Weekly | |
| Add UPS to Watchlist: View: Get UPS Trend Analysis ➞ | |
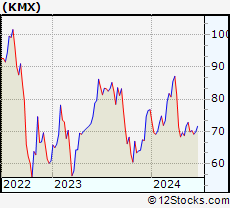 | KMX CarMax, Inc. |
| Sector: Services & Goods | |
| SubSector: Auto Dealerships | |
| MarketCap: 8121.71 Millions | |
| Recent Price: 72.82 Smart Investing & Trading Score: 32 | |
| Day Percent Change: -0.22% Day Change: -0.16 | |
| Week Change: 1.55% Year-to-date Change: -5.1% | |
| KMX Links: Profile News Message Board | |
| Charts:- Daily , Weekly | |
| Add KMX to Watchlist: View: Get KMX Trend Analysis ➞ | |
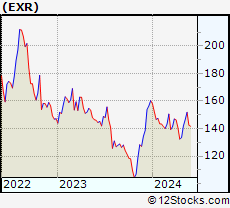 | EXR Extra Space Storage Inc. |
| Sector: Financials | |
| SubSector: REIT - Industrial | |
| MarketCap: 11203.9 Millions | |
| Recent Price: 151.89 Smart Investing & Trading Score: 83 | |
| Day Percent Change: 0.36% Day Change: 0.54 | |
| Week Change: 3.56% Year-to-date Change: -5.3% | |
| EXR Links: Profile News Message Board | |
| Charts:- Daily , Weekly | |
| Add EXR to Watchlist: View: Get EXR Trend Analysis ➞ | |
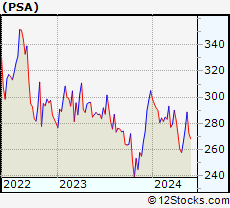 | PSA Public Storage |
| Sector: Financials | |
| SubSector: REIT - Industrial | |
| MarketCap: 32733.9 Millions | |
| Recent Price: 288.67 Smart Investing & Trading Score: 95 | |
| Day Percent Change: 0.57% Day Change: 1.65 | |
| Week Change: 4.61% Year-to-date Change: -5.4% | |
| PSA Links: Profile News Message Board | |
| Charts:- Daily , Weekly | |
| Add PSA to Watchlist: View: Get PSA Trend Analysis ➞ | |
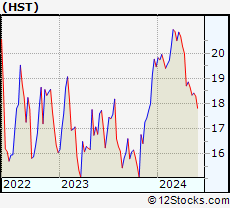 | HST Host Hotels & Resorts, Inc. |
| Sector: Financials | |
| SubSector: REIT - Hotel/Motel | |
| MarketCap: 8253.74 Millions | |
| Recent Price: 18.42 Smart Investing & Trading Score: 18 | |
| Day Percent Change: -1.76% Day Change: -0.33 | |
| Week Change: 0.44% Year-to-date Change: -5.4% | |
| HST Links: Profile News Message Board | |
| Charts:- Daily , Weekly | |
| Add HST to Watchlist: View: Get HST Trend Analysis ➞ | |
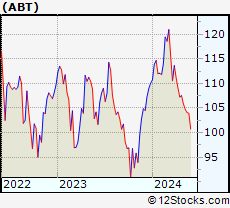 | ABT Abbott Laboratories |
| Sector: Health Care | |
| SubSector: Medical Appliances & Equipment | |
| MarketCap: 125288 Millions | |
| Recent Price: 104.09 Smart Investing & Trading Score: 18 | |
| Day Percent Change: -0.74% Day Change: -0.78 | |
| Week Change: -0.62% Year-to-date Change: -5.4% | |
| ABT Links: Profile News Message Board | |
| Charts:- Daily , Weekly | |
| Add ABT to Watchlist: View: Get ABT Trend Analysis ➞ | |
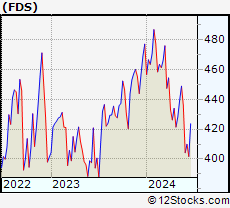 | FDS FactSet Research Systems Inc. |
| Sector: Technology | |
| SubSector: Information & Delivery Services | |
| MarketCap: 9024.37 Millions | |
| Recent Price: 448.88 Smart Investing & Trading Score: 59 | |
| Day Percent Change: 0.75% Day Change: 3.36 | |
| Week Change: 2.21% Year-to-date Change: -5.9% | |
| FDS Links: Profile News Message Board | |
| Charts:- Daily , Weekly | |
| Add FDS to Watchlist: View: Get FDS Trend Analysis ➞ | |
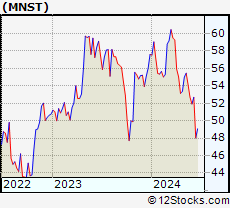 | MNST Monster Beverage Corporation |
| Sector: Consumer Staples | |
| SubSector: Beverages - Soft Drinks | |
| MarketCap: 30126.8 Millions | |
| Recent Price: 54.11 Smart Investing & Trading Score: 40 | |
| Day Percent Change: 0.04% Day Change: 0.02 | |
| Week Change: -2.43% Year-to-date Change: -6.1% | |
| MNST Links: Profile News Message Board | |
| Charts:- Daily , Weekly | |
| Add MNST to Watchlist: View: Get MNST Trend Analysis ➞ | |
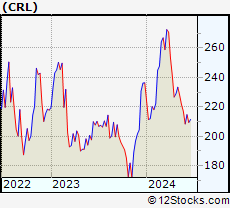 | CRL Charles River Laboratories International, Inc. |
| Sector: Health Care | |
| SubSector: Medical Laboratories & Research | |
| MarketCap: 5700.5 Millions | |
| Recent Price: 221.61 Smart Investing & Trading Score: 0 | |
| Day Percent Change: -1.40% Day Change: -3.14 | |
| Week Change: -2.85% Year-to-date Change: -6.3% | |
| CRL Links: Profile News Message Board | |
| Charts:- Daily , Weekly | |
| Add CRL to Watchlist: View: Get CRL Trend Analysis ➞ | |
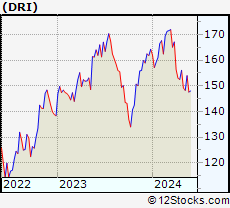 | DRI Darden Restaurants, Inc. |
| Sector: Services & Goods | |
| SubSector: Restaurants | |
| MarketCap: 5623.1 Millions | |
| Recent Price: 154.00 Smart Investing & Trading Score: 49 | |
| Day Percent Change: 1.70% Day Change: 2.58 | |
| Week Change: 3.88% Year-to-date Change: -6.3% | |
| DRI Links: Profile News Message Board | |
| Charts:- Daily , Weekly | |
| Add DRI to Watchlist: View: Get DRI Trend Analysis ➞ | |
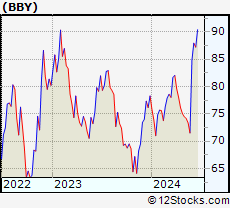 | BBY Best Buy Co., Inc. |
| Sector: Services & Goods | |
| SubSector: Electronics Stores | |
| MarketCap: 15771.3 Millions | |
| Recent Price: 73.35 Smart Investing & Trading Score: 7 | |
| Day Percent Change: -0.39% Day Change: -0.29 | |
| Week Change: -1.11% Year-to-date Change: -6.3% | |
| BBY Links: Profile News Message Board | |
| Charts:- Daily , Weekly | |
| Add BBY to Watchlist: View: Get BBY Trend Analysis ➞ | |
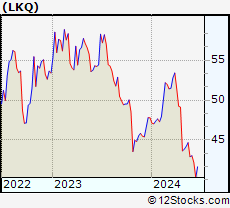 | LKQ LKQ Corporation |
| Sector: Consumer Staples | |
| SubSector: Auto Parts | |
| MarketCap: 5633.79 Millions | |
| Recent Price: 44.67 Smart Investing & Trading Score: 64 | |
| Day Percent Change: 1.18% Day Change: 0.52 | |
| Week Change: 1.04% Year-to-date Change: -6.5% | |
| LKQ Links: Profile News Message Board | |
| Charts:- Daily , Weekly | |
| Add LKQ to Watchlist: View: Get LKQ Trend Analysis ➞ | |
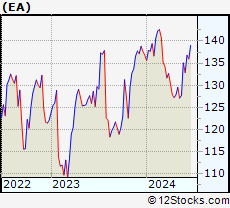 | EA Electronic Arts Inc. |
| Sector: Technology | |
| SubSector: Multimedia & Graphics Software | |
| MarketCap: 27296.5 Millions | |
| Recent Price: 127.75 Smart Investing & Trading Score: 33 | |
| Day Percent Change: -1.09% Day Change: -1.41 | |
| Week Change: 0.48% Year-to-date Change: -6.6% | |
| EA Links: Profile News Message Board | |
| Charts:- Daily , Weekly | |
| Add EA to Watchlist: View: Get EA Trend Analysis ➞ | |
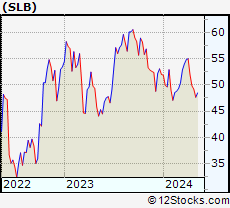 | SLB Schlumberger Limited |
| Sector: Energy | |
| SubSector: Oil & Gas Equipment & Services | |
| MarketCap: 23892 Millions | |
| Recent Price: 48.59 Smart Investing & Trading Score: 38 | |
| Day Percent Change: 0.35% Day Change: 0.17 | |
| Week Change: 0.19% Year-to-date Change: -6.6% | |
| SLB Links: Profile News Message Board | |
| Charts:- Daily , Weekly | |
| Add SLB to Watchlist: View: Get SLB Trend Analysis ➞ | |
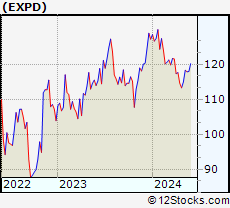 | EXPD Expeditors International of Washington, Inc. |
| Sector: Transports | |
| SubSector: Air Delivery & Freight Services | |
| MarketCap: 10129.8 Millions | |
| Recent Price: 117.90 Smart Investing & Trading Score: 47 | |
| Day Percent Change: 0.22% Day Change: 0.26 | |
| Week Change: -0.36% Year-to-date Change: -7.3% | |
| EXPD Links: Profile News Message Board | |
| Charts:- Daily , Weekly | |
| Add EXPD to Watchlist: View: Get EXPD Trend Analysis ➞ | |
| For tabular summary view of above stock list: Summary View ➞ 0 - 25 , 25 - 50 , 50 - 75 , 75 - 100 , 100 - 125 , 125 - 150 , 150 - 175 , 175 - 200 , 200 - 225 , 225 - 250 , 250 - 275 , 275 - 300 , 300 - 325 , 325 - 350 , 350 - 375 , 375 - 400 , 400 - 425 , 425 - 450 , 450 - 475 , 475 - 500 | ||
| Click To Change The Sort Order: By Market Cap or Company Size Performance: Year-to-date, Week and Day | |
| Select Chart Type: | ||
|
Best Stocks Today 12Stocks.com |
© 2024 12Stocks.com Terms & Conditions Privacy Contact Us
All Information Provided Only For Education And Not To Be Used For Investing or Trading. See Terms & Conditions


One More Thing ... Get Best Stocks Delivered Daily!
Never Ever Miss A Move With Our Top Ten Stocks Lists
Find Best Stocks In Any Market - Bull or Bear Market
Take A Peek At Our Top Ten Stocks Lists: Daily, Weekly, Year-to-Date & Top Trends
Find Best Stocks In Any Market - Bull or Bear Market
Take A Peek At Our Top Ten Stocks Lists: Daily, Weekly, Year-to-Date & Top Trends
S&P 500 Stocks With Best Up Trends [0-bearish to 100-bullish]: Freeport-McMoRan [100], Chubb [100], Tractor Supply[100], DuPont de[100], Arch Capital[100], Air Products[100], Newmont [100], Citizens Financial[100], EQT [100], McKesson [100], Aflac [100]
Best S&P 500 Stocks Year-to-Date:
NVIDIA [86.74%], Constellation [81.97%], NRG [59.19%], Micron [46.81%], Chipotle Mexican[40.51%], Western Digital[37.67%], Leidos Holdings[37.35%], Eaton [37.13%], Arch Capital[35.98%], Arista Networks[35.83%], Targa Resources[35.46%] Best S&P 500 Stocks This Week:
Insulet [12.88%], Moderna [11.23%], Advanced Micro[8.26%], Enphase [7.78%], Chubb [7.63%], Incyte [7.61%], Teradyne [7.31%], Walmart [6.89%], Palo Alto[6.85%], Teleflex [6.72%], AES [6.72%] Best S&P 500 Stocks Daily:
Valero [4.77%], Freeport-McMoRan [4.21%], Chubb [3.55%], Tractor Supply[3.42%], Starbucks [3.41%], DuPont de[3.02%], Marathon [2.80%], Globe Life[2.54%], DaVita [2.45%], American [2.29%], Arch Capital[2.20%]