
 Login Sign Up


| |||||
 |  | ||||

| 12Stocks.com Market Intelligence |
Best S&P 500 Stocks
|
On this page, you will find the most comprehensive analysis of S&P 500 stocks and ETFs - from latest trends to performances to charts ➞. First, here are the year-to-date (YTD) performances of the most requested S&P 500 stocks at 12Stocks.com (click stock for review):
| NVIDIA 87% | ||
| Google 26% | ||
| Walmart 23% | ||
| Amazon.com 22% | ||
| Goldman Sachs 21% | ||
| Caterpillar 21% | ||
| JPMorgan Chase 20% | ||
| Merck 20% | ||
| Microsoft 12% | ||
| Chevron 9% | ||
| Johnson & Johnson -1% | ||
| Apple -1% | ||
| McDonald s -8% | ||
| Gilead -16% | ||
| Starbucks -19% | ||
| Boeing -29% | ||
| Intel -37% | ||
| Quick: S&P 500 Stocks Lists: Performances & Trends, S&P 500 Stock Charts
Sort S&P 500 stocks: Daily, Weekly, Year-to-Date, Market Cap & Trends. Filter S&P 500 stocks list by sector: Show all, Tech, Finance, Energy, Staples, Retail, Industrial, Materials, Utilities and HealthCare |
| 12Stocks.com S&P 500 Stocks Performances & Trends Daily Report | |||||||||
|
| 
The overall Smart Investing & Trading Score is 88 (0-bearish to 100-bullish) which puts S&P 500 index in short term bullish trend. The Smart Investing & Trading Score from previous trading session is 95 and hence a deterioration of trend. | ||||||||
Here are the Smart Investing & Trading Scores of the most requested S&P 500 stocks at 12Stocks.com (click stock name for detailed review):
|


| 12Stocks.com: Top Performing S&P 500 Index Stocks | ||||||||||||||||||||||||||||||||||||||||||||||||
 The top performing S&P 500 Index stocks year to date are
Now, more recently, over last week, the top performing S&P 500 Index stocks on the move are


|
||||||||||||||||||||||||||||||||||||||||||||||||
| 12Stocks.com: Investing in S&P 500 Index with Stocks | |
|
The following table helps investors and traders sort through current performance and trends (as measured by Smart Investing & Trading Score) of various
stocks in the S&P 500 Index. Quick View: Move mouse or cursor over stock symbol (ticker) to view short-term technical chart and over stock name to view long term chart. Click on  to add stock symbol to your watchlist and to add stock symbol to your watchlist and  to view watchlist. Click on any ticker or stock name for detailed market intelligence report for that stock. to view watchlist. Click on any ticker or stock name for detailed market intelligence report for that stock. |
12Stocks.com Performance of Stocks in S&P 500 Index
| Ticker | Stock Name | Watchlist | Category | Recent Price | Smart Investing & Trading Score | Change % | YTD Change% |
| SPY | SPDR S&P |   | Utilities | 529.45 | 88 | 0.14 | 11.39% |
| BSX | Boston Scientific | | Health Care | 74.65 | 88 | 0.13 | 29.13% |
| CTAS | Cintas | | Services & Goods | 692.14 | 61 | 0.11 | 14.85% |
| ADBE | Adobe | | Technology | 483.43 | 47 | 0.11 | -18.97% |
| MCHP | Microchip | | Technology | 94.33 | 76 | 0.10 | 4.60% |
| ARE | Alexandria Real | | Financials | 124.17 | 63 | 0.09 | -2.05% |
| SPG | Simon Property | | Financials | 148.79 | 58 | 0.09 | 4.31% |
| HOLX | Hologic | | Health Care | 75.02 | 53 | 0.09 | 5.00% |
| V | Visa | | Financials | 280.10 | 47 | 0.09 | 7.59% |
| ATO | Atmos | | Utilities | 118.64 | 93 | 0.07 | 2.36% |
| AIZ | Assurant | | Financials | 175.60 | 32 | 0.07 | 4.22% |
| PCAR | PACCAR Inc | | Consumer Staples | 106.00 | 7 | 0.07 | 8.55% |
| EQR | Equity Residential | | Financials | 67.13 | 76 | 0.06 | 9.76% |
| VRSK | Verisk Analytics | | Services & Goods | 251.62 | 90 | 0.06 | 5.34% |
| EMR | Emerson Electric | | Industrials | 112.88 | 58 | 0.05 | 15.98% |
| HCA | HCA Healthcare | | Health Care | 322.86 | 71 | 0.05 | 19.28% |
| ADM | Archer-Daniels-Midland | | Consumer Staples | 61.62 | 83 | 0.05 | -14.68% |
| ANSS | ANSYS | | Technology | 327.71 | 25 | 0.05 | -9.69% |
| AAPL | Apple | | Technology | 189.87 | 83 | 0.05 | -1.38% |
| IEX | IDEX | | Industrials | 222.33 | 22 | 0.04 | 2.40% |
| MNST | Monster Beverage | | Consumer Staples | 54.11 | 40 | 0.04 | -6.08% |
| IBM | Business | | Technology | 169.03 | 57 | 0.04 | 3.35% |
| EQIX | Equinix | | Financials | 799.83 | 52 | 0.04 | -0.69% |
| WFC | Wells Fargo | | Financials | 61.08 | 58 | 0.03 | 24.10% |
| TXN | Texas Instruments | | Technology | 195.02 | 90 | 0.03 | 14.41% |
| For chart view version of above stock list: Chart View ➞ 0 - 25 , 25 - 50 , 50 - 75 , 75 - 100 , 100 - 125 , 125 - 150 , 150 - 175 , 175 - 200 , 200 - 225 , 225 - 250 , 250 - 275 , 275 - 300 , 300 - 325 , 325 - 350 , 350 - 375 , 375 - 400 , 400 - 425 , 425 - 450 , 450 - 475 , 475 - 500 | ||
 | Click To Change The Sort Order: By Market Cap or Company Size Performance: Year-to-date, Week and Day |  |
|
Get the most comprehensive stock market coverage daily at 12Stocks.com ➞ Best Stocks Today ➞ Best Stocks Weekly ➞ Best Stocks Year-to-Date ➞ Best Stocks Trends ➞  Best Stocks Today 12Stocks.com Best Nasdaq Stocks ➞ Best S&P 500 Stocks ➞ Best Tech Stocks ➞ Best Biotech Stocks ➞ |
| Detailed Overview of S&P 500 Stocks |
| S&P 500 Technical Overview, Leaders & Laggards, Top S&P 500 ETF Funds & Detailed S&P 500 Stocks List, Charts, Trends & More |
| S&P 500: Technical Analysis, Trends & YTD Performance | |
| S&P 500 index as represented by
SPY, an exchange-traded fund [ETF], holds basket of five hundred (mostly largecap) stocks from across all major sectors of the US stock market. The S&P 500 index (contains stocks like Apple and Exxon) is up by 11.39% and is currently outperforming the overall market by 0.82% year-to-date. Below is a quick view of technical charts and trends: | |
 SPY Weekly Chart |
|
| Long Term Trend: Very Good | |
| Medium Term Trend: Very Good | |
 SPY Daily Chart |
|
| Short Term Trend: Good | |
| Overall Trend Score: 88 | |
| YTD Performance: 11.39% | |
| **Trend Scores & Views Are Only For Educational Purposes And Not For Investing | |
| 12Stocks.com: Investing in S&P 500 Index using Exchange Traded Funds | |
|
The following table shows list of key exchange traded funds (ETF) that
help investors track S&P 500 index. The following list also includes leveraged ETF funds that track twice or thrice the daily returns of S&P 500 indices. Short or inverse ETF funds move in the opposite direction to the index they track and are useful during market pullbacks or during bear markets. Quick View: Move mouse or cursor over ETF symbol (ticker) to view short-term technical chart and over ETF name to view long term chart. Click on ticker or stock name for detailed view. Click on to add stock symbol to your watchlist and to view watchlist. |
12Stocks.com List of ETFs that track S&P 500 Index
| Ticker | ETF Name | Watchlist | Recent Price | Smart Investing & Trading Score | Change % | Week % | Year-to-date % |
| SPY | SPDR S&P 500 ETF | | 529.45 | 88 | 0.14 | 1.65 | 11.39% |
| IVV | iShares Core S&P 500 ETF | | 532.13 | 83 | -0.34 | 1.67 | 11.41% |
| VOO | Vanguard 500 ETF | | 486.69 | 83 | -0.32 | 1.66 | 11.42% |
| OEF | iShares S&P 100 | | 252.41 | 83 | 0.12 | 1.84 | 12.99% |
| SSO | ProShares Ultra S&P500 | | 78.55 | 83 | 0.32 | 3.18 | 20.72% |
| UPRO | ProShares UltraPro S&P500 | | 71.44 | 88 | 0.39 | 4.7 | 30.51% |
| SPXL | Direxion Daily S&P500 Bull 3X ETF | | 135.59 | 83 | -1.13 | 4.66 | 30.39% |
| SH | ProShares Short S&P500 | | 11.85 | 17 | -0.08 | -1.41 | -8.78% |
| SDS | ProShares UltraShort S&P500 | | 24.60 | 17 | -0.24 | -2.96 | -17.78% |
| SPXU | ProShares UltraPro Short S&P500 | | 31.63 | 17 | -0.41 | -4.47 | -26.44% |
| SPXS | Direxion Daily S&P 500 Bear 3X ETF | | 8.56 | 17 | 1.18 | -4.57 | -25.89% |
| 12Stocks.com: Charts, Trends, Fundamental Data and Performances of S&P 500 Stocks | |
|
We now take in-depth look at all S&P 500 stocks including charts, multi-period performances and overall trends (as measured by Smart Investing & Trading Score). One can sort S&P 500 stocks (click link to choose) by Daily, Weekly and by Year-to-Date performances. Also, one can sort by size of the company or by market capitalization. |
| Select Your Default Chart Type: | |||||
| |||||
| Click on stock symbol or name for detailed view. Click on to add stock symbol to your watchlist and to view watchlist. Quick View: Move mouse or cursor over "Daily" to quickly view daily technical stock chart and over "Weekly" to view weekly technical stock chart. | |||||
 | SPY SPDR S&P 500 ETF |
| Sector: Utilities | |
| SubSector: Exchange Traded Fund | |
| MarketCap: 0 Millions | |
| Recent Price: 529.45 Smart Investing & Trading Score: 88 | |
| Day Percent Change: 0.14% Day Change: 0.76 | |
| Week Change: 1.65% Year-to-date Change: 11.4% | |
| SPY Links: Profile News Message Board | |
| Charts:- Daily , Weekly | |
| Add SPY to Watchlist: View: Get SPY Trend Analysis ➞ | |
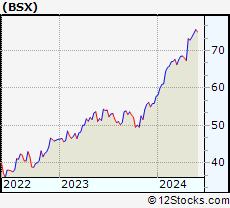 | BSX Boston Scientific Corporation |
| Sector: Health Care | |
| SubSector: Medical Appliances & Equipment | |
| MarketCap: 41541.2 Millions | |
| Recent Price: 74.65 Smart Investing & Trading Score: 88 | |
| Day Percent Change: 0.13% Day Change: 0.10 | |
| Week Change: 1.3% Year-to-date Change: 29.1% | |
| BSX Links: Profile News Message Board | |
| Charts:- Daily , Weekly | |
| Add BSX to Watchlist: View: Get BSX Trend Analysis ➞ | |
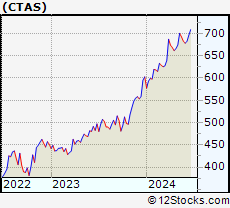 | CTAS Cintas Corporation |
| Sector: Services & Goods | |
| SubSector: Business Services | |
| MarketCap: 20154.6 Millions | |
| Recent Price: 692.14 Smart Investing & Trading Score: 61 | |
| Day Percent Change: 0.11% Day Change: 0.76 | |
| Week Change: -1.16% Year-to-date Change: 14.9% | |
| CTAS Links: Profile News Message Board | |
| Charts:- Daily , Weekly | |
| Add CTAS to Watchlist: View: Get CTAS Trend Analysis ➞ | |
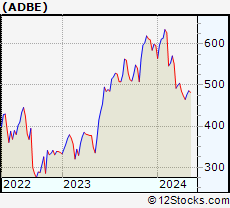 | ADBE Adobe Inc. |
| Sector: Technology | |
| SubSector: Application Software | |
| MarketCap: 157868 Millions | |
| Recent Price: 483.43 Smart Investing & Trading Score: 47 | |
| Day Percent Change: 0.11% Day Change: 0.55 | |
| Week Change: 0.24% Year-to-date Change: -19.0% | |
| ADBE Links: Profile News Message Board | |
| Charts:- Daily , Weekly | |
| Add ADBE to Watchlist: View: Get ADBE Trend Analysis ➞ | |
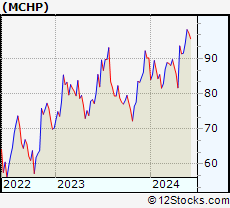 | MCHP Microchip Technology Incorporated |
| Sector: Technology | |
| SubSector: Semiconductor - Broad Line | |
| MarketCap: 16826.3 Millions | |
| Recent Price: 94.33 Smart Investing & Trading Score: 76 | |
| Day Percent Change: 0.10% Day Change: 0.09 | |
| Week Change: 3.09% Year-to-date Change: 4.6% | |
| MCHP Links: Profile News Message Board | |
| Charts:- Daily , Weekly | |
| Add MCHP to Watchlist: View: Get MCHP Trend Analysis ➞ | |
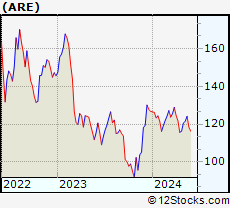 | ARE Alexandria Real Estate Equities, Inc. |
| Sector: Financials | |
| SubSector: REIT - Office | |
| MarketCap: 16793.6 Millions | |
| Recent Price: 124.17 Smart Investing & Trading Score: 63 | |
| Day Percent Change: 0.09% Day Change: 0.11 | |
| Week Change: 2.12% Year-to-date Change: -2.1% | |
| ARE Links: Profile News Message Board | |
| Charts:- Daily , Weekly | |
| Add ARE to Watchlist: View: Get ARE Trend Analysis ➞ | |
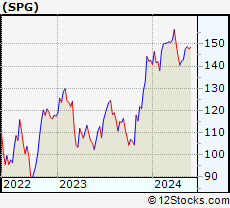 | SPG Simon Property Group, Inc. |
| Sector: Financials | |
| SubSector: REIT - Retail | |
| MarketCap: 17959.6 Millions | |
| Recent Price: 148.79 Smart Investing & Trading Score: 58 | |
| Day Percent Change: 0.09% Day Change: 0.13 | |
| Week Change: 0.72% Year-to-date Change: 4.3% | |
| SPG Links: Profile News Message Board | |
| Charts:- Daily , Weekly | |
| Add SPG to Watchlist: View: Get SPG Trend Analysis ➞ | |
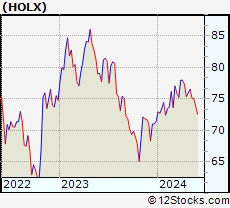 | HOLX Hologic, Inc. |
| Sector: Health Care | |
| SubSector: Medical Instruments & Supplies | |
| MarketCap: 9075.2 Millions | |
| Recent Price: 75.02 Smart Investing & Trading Score: 53 | |
| Day Percent Change: 0.09% Day Change: 0.07 | |
| Week Change: -0.16% Year-to-date Change: 5.0% | |
| HOLX Links: Profile News Message Board | |
| Charts:- Daily , Weekly | |
| Add HOLX to Watchlist: View: Get HOLX Trend Analysis ➞ | |
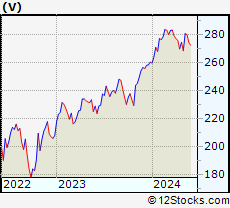 | V Visa Inc. |
| Sector: Financials | |
| SubSector: Credit Services | |
| MarketCap: 340798 Millions | |
| Recent Price: 280.10 Smart Investing & Trading Score: 47 | |
| Day Percent Change: 0.09% Day Change: 0.26 | |
| Week Change: -0.23% Year-to-date Change: 7.6% | |
| V Links: Profile News Message Board | |
| Charts:- Daily , Weekly | |
| Add V to Watchlist: View: Get V Trend Analysis ➞ | |
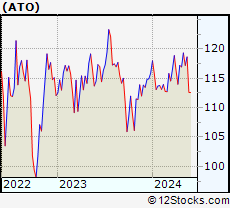 | ATO Atmos Energy Corporation |
| Sector: Utilities | |
| SubSector: Gas Utilities | |
| MarketCap: 11449 Millions | |
| Recent Price: 118.64 Smart Investing & Trading Score: 93 | |
| Day Percent Change: 0.07% Day Change: 0.08 | |
| Week Change: 1.25% Year-to-date Change: 2.4% | |
| ATO Links: Profile News Message Board | |
| Charts:- Daily , Weekly | |
| Add ATO to Watchlist: View: Get ATO Trend Analysis ➞ | |
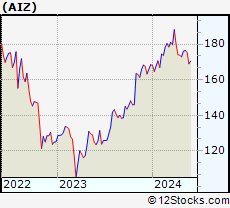 | AIZ Assurant, Inc. |
| Sector: Financials | |
| SubSector: Accident & Health Insurance | |
| MarketCap: 6110.3 Millions | |
| Recent Price: 175.60 Smart Investing & Trading Score: 32 | |
| Day Percent Change: 0.07% Day Change: 0.12 | |
| Week Change: -0.51% Year-to-date Change: 4.2% | |
| AIZ Links: Profile News Message Board | |
| Charts:- Daily , Weekly | |
| Add AIZ to Watchlist: View: Get AIZ Trend Analysis ➞ | |
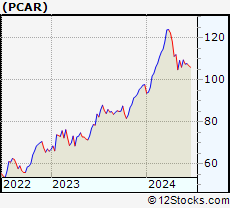 | PCAR PACCAR Inc |
| Sector: Consumer Staples | |
| SubSector: Trucks & Other Vehicles | |
| MarketCap: 19117.7 Millions | |
| Recent Price: 106.00 Smart Investing & Trading Score: 7 | |
| Day Percent Change: 0.07% Day Change: 0.07 | |
| Week Change: -2.91% Year-to-date Change: 8.6% | |
| PCAR Links: Profile News Message Board | |
| Charts:- Daily , Weekly | |
| Add PCAR to Watchlist: View: Get PCAR Trend Analysis ➞ | |
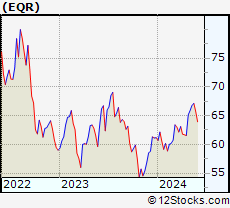 | EQR Equity Residential |
| Sector: Financials | |
| SubSector: REIT - Residential | |
| MarketCap: 22061.9 Millions | |
| Recent Price: 67.13 Smart Investing & Trading Score: 76 | |
| Day Percent Change: 0.06% Day Change: 0.04 | |
| Week Change: 0.49% Year-to-date Change: 9.8% | |
| EQR Links: Profile News Message Board | |
| Charts:- Daily , Weekly | |
| Add EQR to Watchlist: View: Get EQR Trend Analysis ➞ | |
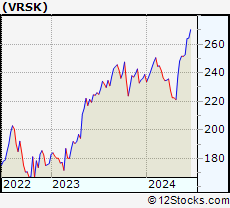 | VRSK Verisk Analytics, Inc. |
| Sector: Services & Goods | |
| SubSector: Business Services | |
| MarketCap: 22033.2 Millions | |
| Recent Price: 251.62 Smart Investing & Trading Score: 90 | |
| Day Percent Change: 0.06% Day Change: 0.14 | |
| Week Change: 1.33% Year-to-date Change: 5.3% | |
| VRSK Links: Profile News Message Board | |
| Charts:- Daily , Weekly | |
| Add VRSK to Watchlist: View: Get VRSK Trend Analysis ➞ | |
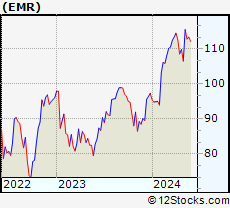 | EMR Emerson Electric Co. |
| Sector: Industrials | |
| SubSector: Industrial Electrical Equipment | |
| MarketCap: 30457.9 Millions | |
| Recent Price: 112.88 Smart Investing & Trading Score: 58 | |
| Day Percent Change: 0.05% Day Change: 0.06 | |
| Week Change: -2.31% Year-to-date Change: 16.0% | |
| EMR Links: Profile News Message Board | |
| Charts:- Daily , Weekly | |
| Add EMR to Watchlist: View: Get EMR Trend Analysis ➞ | |
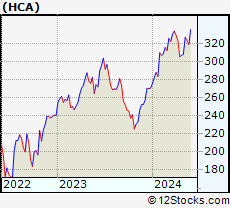 | HCA HCA Healthcare, Inc. |
| Sector: Health Care | |
| SubSector: Hospitals | |
| MarketCap: 29466.6 Millions | |
| Recent Price: 322.86 Smart Investing & Trading Score: 71 | |
| Day Percent Change: 0.05% Day Change: 0.15 | |
| Week Change: -1.16% Year-to-date Change: 19.3% | |
| HCA Links: Profile News Message Board | |
| Charts:- Daily , Weekly | |
| Add HCA to Watchlist: View: Get HCA Trend Analysis ➞ | |
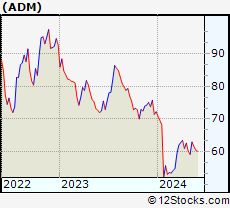 | ADM Archer-Daniels-Midland Company |
| Sector: Consumer Staples | |
| SubSector: Farm Products | |
| MarketCap: 18988.7 Millions | |
| Recent Price: 61.62 Smart Investing & Trading Score: 83 | |
| Day Percent Change: 0.05% Day Change: 0.03 | |
| Week Change: -2.16% Year-to-date Change: -14.7% | |
| ADM Links: Profile News Message Board | |
| Charts:- Daily , Weekly | |
| Add ADM to Watchlist: View: Get ADM Trend Analysis ➞ | |
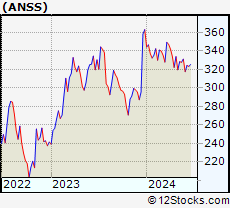 | ANSS ANSYS, Inc. |
| Sector: Technology | |
| SubSector: Application Software | |
| MarketCap: 19497.4 Millions | |
| Recent Price: 327.71 Smart Investing & Trading Score: 25 | |
| Day Percent Change: 0.05% Day Change: 0.18 | |
| Week Change: -0.16% Year-to-date Change: -9.7% | |
| ANSS Links: Profile News Message Board | |
| Charts:- Daily , Weekly | |
| Add ANSS to Watchlist: View: Get ANSS Trend Analysis ➞ | |
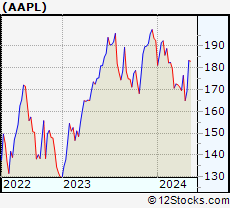 | AAPL Apple Inc. |
| Sector: Technology | |
| SubSector: Electronic Equipment | |
| MarketCap: 1112940 Millions | |
| Recent Price: 189.87 Smart Investing & Trading Score: 83 | |
| Day Percent Change: 0.05% Day Change: 0.09 | |
| Week Change: 3.73% Year-to-date Change: -1.4% | |
| AAPL Links: Profile News Message Board | |
| Charts:- Daily , Weekly | |
| Add AAPL to Watchlist: View: Get AAPL Trend Analysis ➞ | |
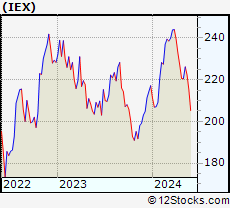 | IEX IDEX Corporation |
| Sector: Industrials | |
| SubSector: Diversified Machinery | |
| MarketCap: 9721.46 Millions | |
| Recent Price: 222.33 Smart Investing & Trading Score: 22 | |
| Day Percent Change: 0.04% Day Change: 0.09 | |
| Week Change: -1.69% Year-to-date Change: 2.4% | |
| IEX Links: Profile News Message Board | |
| Charts:- Daily , Weekly | |
| Add IEX to Watchlist: View: Get IEX Trend Analysis ➞ | |
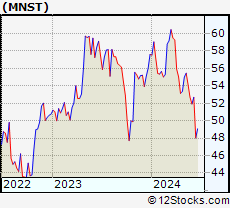 | MNST Monster Beverage Corporation |
| Sector: Consumer Staples | |
| SubSector: Beverages - Soft Drinks | |
| MarketCap: 30126.8 Millions | |
| Recent Price: 54.11 Smart Investing & Trading Score: 40 | |
| Day Percent Change: 0.04% Day Change: 0.02 | |
| Week Change: -2.43% Year-to-date Change: -6.1% | |
| MNST Links: Profile News Message Board | |
| Charts:- Daily , Weekly | |
| Add MNST to Watchlist: View: Get MNST Trend Analysis ➞ | |
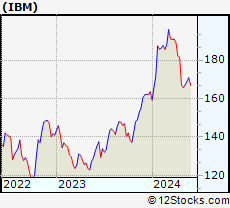 | IBM International Business Machines Corporation |
| Sector: Technology | |
| SubSector: Information Technology Services | |
| MarketCap: 97241.6 Millions | |
| Recent Price: 169.03 Smart Investing & Trading Score: 57 | |
| Day Percent Change: 0.04% Day Change: 0.06 | |
| Week Change: 1.12% Year-to-date Change: 3.4% | |
| IBM Links: Profile News Message Board | |
| Charts:- Daily , Weekly | |
| Add IBM to Watchlist: View: Get IBM Trend Analysis ➞ | |
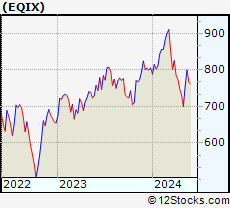 | EQIX Equinix, Inc. (REIT) |
| Sector: Financials | |
| SubSector: REIT - Diversified | |
| MarketCap: 45855.3 Millions | |
| Recent Price: 799.83 Smart Investing & Trading Score: 52 | |
| Day Percent Change: 0.04% Day Change: 0.33 | |
| Week Change: 5.56% Year-to-date Change: -0.7% | |
| EQIX Links: Profile News Message Board | |
| Charts:- Daily , Weekly | |
| Add EQIX to Watchlist: View: Get EQIX Trend Analysis ➞ | |
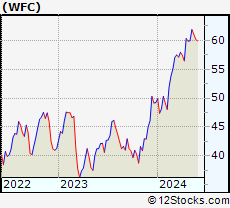 | WFC Wells Fargo & Company |
| Sector: Financials | |
| SubSector: Money Center Banks | |
| MarketCap: 129138 Millions | |
| Recent Price: 61.08 Smart Investing & Trading Score: 58 | |
| Day Percent Change: 0.03% Day Change: 0.02 | |
| Week Change: -1.31% Year-to-date Change: 24.1% | |
| WFC Links: Profile News Message Board | |
| Charts:- Daily , Weekly | |
| Add WFC to Watchlist: View: Get WFC Trend Analysis ➞ | |
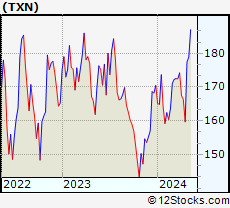 | TXN Texas Instruments Incorporated |
| Sector: Technology | |
| SubSector: Semiconductor - Broad Line | |
| MarketCap: 99509.1 Millions | |
| Recent Price: 195.02 Smart Investing & Trading Score: 90 | |
| Day Percent Change: 0.03% Day Change: 0.05 | |
| Week Change: 4.26% Year-to-date Change: 14.4% | |
| TXN Links: Profile News Message Board | |
| Charts:- Daily , Weekly | |
| Add TXN to Watchlist: View: Get TXN Trend Analysis ➞ | |
| For tabular summary view of above stock list: Summary View ➞ 0 - 25 , 25 - 50 , 50 - 75 , 75 - 100 , 100 - 125 , 125 - 150 , 150 - 175 , 175 - 200 , 200 - 225 , 225 - 250 , 250 - 275 , 275 - 300 , 300 - 325 , 325 - 350 , 350 - 375 , 375 - 400 , 400 - 425 , 425 - 450 , 450 - 475 , 475 - 500 | ||
| Click To Change The Sort Order: By Market Cap or Company Size Performance: Year-to-date, Week and Day | |
| Select Chart Type: | ||
|
Best Stocks Today 12Stocks.com |
© 2024 12Stocks.com Terms & Conditions Privacy Contact Us
All Information Provided Only For Education And Not To Be Used For Investing or Trading. See Terms & Conditions


One More Thing ... Get Best Stocks Delivered Daily!
Never Ever Miss A Move With Our Top Ten Stocks Lists
Find Best Stocks In Any Market - Bull or Bear Market
Take A Peek At Our Top Ten Stocks Lists: Daily, Weekly, Year-to-Date & Top Trends
Find Best Stocks In Any Market - Bull or Bear Market
Take A Peek At Our Top Ten Stocks Lists: Daily, Weekly, Year-to-Date & Top Trends
S&P 500 Stocks With Best Up Trends [0-bearish to 100-bullish]: Freeport-McMoRan [100], Chubb [100], Tractor Supply[100], DuPont de[100], Arch Capital[100], Air Products[100], Newmont [100], Citizens Financial[100], EQT [100], McKesson [100], Aflac [100]
Best S&P 500 Stocks Year-to-Date:
NVIDIA [86.74%], Constellation [81.97%], NRG [59.19%], Micron [46.81%], Chipotle Mexican[40.51%], Western Digital[37.67%], Leidos Holdings[37.35%], Eaton [37.13%], Arch Capital[35.98%], Arista Networks[35.83%], Targa Resources[35.46%] Best S&P 500 Stocks This Week:
Insulet [12.88%], Moderna [11.23%], Advanced Micro[8.26%], Enphase [7.78%], Chubb [7.63%], Incyte [7.61%], Teradyne [7.31%], Walmart [6.89%], Palo Alto[6.85%], Teleflex [6.72%], AES [6.72%] Best S&P 500 Stocks Daily:
Valero [4.77%], Freeport-McMoRan [4.21%], Chubb [3.55%], Tractor Supply[3.42%], Starbucks [3.41%], DuPont de[3.02%], Marathon [2.80%], Globe Life[2.54%], DaVita [2.45%], American [2.29%], Arch Capital[2.20%]