
 Login Sign Up


| |||||
 |  | ||||

| 12Stocks.com Market Intelligence |
Best Nasdaq Stocks
|
On this page, you will find the most comprehensive analysis of Nasdaq 100 stocks and ETFs - from latest trends to performances to charts ➞. First, here are the year-to-date (YTD) performances of the most requested Nasdaq stocks at 12Stocks.com (click stock for review):
| NVIDIA 91% | ||
| QUALCOMM 34% | ||
| Netflix 25% | ||
| Google 25% | ||
| Amazon.com 21% | ||
| Costco 20% | ||
| Microsoft 12% | ||
| Amgen 9% | ||
| Apple -1% | ||
| Baidu -5% | ||
| Comcast -10% | ||
| Biogen -11% | ||
| Gilead -16% | ||
| Starbucks -22% | ||
| Expedia -25% | ||
| Tesla -30% | ||
| Intel -36% | ||
| Nasdaq 100 Stocks Lists: Performances & Trends, Nasdaq 100 Stock Charts
Sort Nasdaq 100 stocks: Daily, Weekly, Year-to-Date, Market Cap & Trends. |
| 12Stocks.com Nasdaq Stocks Performances & Trends Daily Report | |||||||||
|
| 
The overall Smart Investing & Trading Score is 95 (0-bearish to 100-bullish) which puts Nasdaq index in short term bullish trend. The Smart Investing & Trading Score from previous trading session is 90 and an improvement of trend continues. | ||||||||
| Here are the Smart Investing & Trading Scores of the most requested Nasdaq 100 stocks at 12Stocks.com (click stock name for detailed review): |


| 12Stocks.com: Top Performing Nasdaq 100 Index Stocks | ||||||||||||||||||||||||||||||||||||||||||||||||
 The top performing Nasdaq 100 Index stocks year to date are
Now, more recently, over last week, the top performing Nasdaq 100 Index stocks on the move are


|
||||||||||||||||||||||||||||||||||||||||||||||||
| 12Stocks.com: Investing in Nasdaq 100 Index with Stocks | |
|
The following table helps investors and traders sort through current performance and trends (as measured by Smart Investing & Trading Score) of various
stocks in the Nasdaq 100 Index. Quick View: Move mouse or cursor over stock symbol (ticker) to view short-term technical chart and over stock name to view long term chart. Click on  to add stock symbol to your watchlist and to add stock symbol to your watchlist and  to view watchlist. Click on any ticker or stock name for detailed market intelligence report for that stock. to view watchlist. Click on any ticker or stock name for detailed market intelligence report for that stock. |
12Stocks.com Performance of Stocks in Nasdaq 100 Index
| Ticker | Stock Name | Watchlist | Category | Recent Price | Smart Investing & Trading Score | Change % | YTD Change% |
| CDNS | Cadence Design |   | Technology | 288.93 | 59 | -1.42% | 6.08% |
| ZS | Zscaler | | Technology | 179.31 | 59 | -1.00% | -19.07% |
| EA | Electronic Arts | | Technology | 129.16 | 57 | 1.21% | -5.59% |
| REGN | Regeneron | | Health Care | 967.98 | 57 | -1.05% | 10.21% |
| GFS | GLOBALFOUNDRIES | | Technology | 54.18 | 57 | -0.53% | -10.45% |
| INTC | Intel | | Technology | 32.03 | 57 | 2.43% | -36.26% |
| TMUS | T-Mobile US | | Technology | 163.58 | 55 | 0.55% | 2.03% |
| AMZN | Amazon.com | | Services & Goods | 183.63 | 53 | -1.27% | 20.86% |
| CHTR | Charter | | Technology | 277.54 | 52 | 2.12% | -28.59% |
| MDLZ | Mondelez | | Consumer Staples | 71.92 | 52 | 0.83% | -0.70% |
| DLTR | Dollar Tree | | Services & Goods | 121.30 | 50 | 2.10% | -14.61% |
| GILD | Gilead | | Health Care | 67.86 | 50 | 1.27% | -16.23% |
| ROST | Ross Stores | | Services & Goods | 134.34 | 49 | 1.01% | -2.93% |
| MDB | MongoDB | | Technology | 369.94 | 49 | -1.74% | -9.52% |
| PYPL | PayPal | | Financials | 64.10 | 49 | 0.31% | 4.38% |
| ILMN | Illumina | | Health Care | 114.46 | 47 | -0.48% | -17.80% |
| TEAM | Atlassian | | Technology | 182.21 | 45 | -1.09% | -23.40% |
| KHC | Kraft Heinz | | Consumer Staples | 36.07 | 43 | 0.61% | -2.46% |
| FTNT | Fortinet | | Technology | 61.24 | 42 | 0.84% | 4.63% |
| MAR | Marriott | | Services & Goods | 238.96 | 42 | 1.25% | 5.96% |
| TSLA | Tesla | | Consumer Staples | 174.84 | 40 | 0.49% | -29.64% |
| META | Meta Platforms | | Technology | 473.23 | 40 | -1.73% | 33.68% |
| ADBE | Adobe | | Technology | 482.88 | 40 | -0.51% | -19.06% |
| CDW | CDW | | Technology | 224.14 | 39 | 0.31% | -1.40% |
| CMCSA | Comcast | | Services & Goods | 39.37 | 37 | 0.31% | -10.22% |
| CPRT | Copart | | Services & Goods | 54.58 | 34 | -1.32% | 11.39% |
| CSGP | CoStar | | Financials | 88.13 | 34 | -0.40% | 0.85% |
| DDOG | Datadog | | Technology | 120.61 | 32 | 1.81% | -0.63% |
| SIRI | Sirius XM | | Services & Goods | 3.05 | 32 | 0.33% | -44.24% |
| MNST | Monster Beverage | | Consumer Staples | 54.09 | 32 | -0.28% | -6.11% |
| For chart view version of above stock list: Chart View ➞ 0 - 30 , 30 - 60 , 60 - 90 , 90 - 120 | ||
 | Click To Change The Sort Order: By Market Cap or Company Size Performance: Year-to-date, Week and Day |  |
|
Get the most comprehensive stock market coverage daily at 12Stocks.com ➞ Best Stocks Today ➞ Best Stocks Weekly ➞ Best Stocks Year-to-Date ➞ Best Stocks Trends ➞  Best Stocks Today 12Stocks.com Best Dow Stocks ➞ Best S&P 500 Stocks ➞ Best Tech Stocks ➞ Best Biotech Stocks ➞ |
| Detailed Overview of Nasdaq 100 Stocks |
| Nasdaq 100 Technical Overview, Leaders & Laggards, Top Nasdaq 100 ETF Funds & Detailed Nasdaq 100 Stocks List, Charts, Trends & More |
| Nasdaq 100: Technical Analysis, Trends & YTD Performance | |
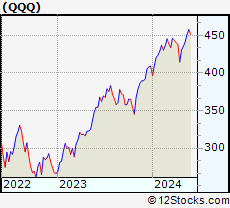
| Nasdaq 100 index as represented by
QQQ, an exchange-traded fund [ETF], holds basket of one hundred (mostly largecap) stocks from technology, biotech & retail sectors of the US stock market. The Nasdaq 100 index (contains stocks like Apple and Amgen) is up by 11.01% and is currently outperforming the overall market by 0.59% year-to-date. Below is a quick view of technical charts and trends: | |
 QQQ Weekly Chart |
|
| Long Term Trend: Very Good | |
| Medium Term Trend: Very Good | |
 QQQ Daily Chart |
|
| Short Term Trend: Very Good | |
| Overall Trend Score: 95 | |
| YTD Performance: 11.01% | |
| **Trend Scores & Views Are Only For Educational Purposes And Not For Investing | |
| 12Stocks.com: Investing in Nasdaq 100 Index using Exchange Traded Funds | |
|
The following table shows list of key exchange traded funds (ETF) that
help investors track Nasdaq 100 index. The following list also includes leveraged ETF funds that track twice or thrice the daily returns of Nasdaq 100 indices. Short or inverse ETF funds move in the opposite direction to the index they track and are useful during market pullbacks or during bear markets. Quick View: Move mouse or cursor over ETF symbol (ticker) to view short-term technical chart and over ETF name to view long term chart. Click on ticker or stock name for detailed view. Click on to add stock symbol to your watchlist and to view watchlist. |
12Stocks.com List of ETFs that track Nasdaq 100 Index
| Ticker | ETF Name | Watchlist | Recent Price | Smart Investing & Trading Score | Change % | Week % | Year-to-date % |
| SQQQ | ProShares UltraPro Short QQQ | | 9.94 | 10 | 0.71 | -6.31 | -26.1% |
| TQQQ | ProShares UltraPro QQQ | | 63.08 | 90 | -0.61 | 6.61 | 24.42% |
| QQQ | PowerShares QQQ ETF | | 454.60 | 95 | 0.94 | 2.84 | 11.01% |
| QYLD | Recon Capital NASDAQ 100 Cov Call ETF | | 17.61 | 37 | -0.23 | -0.17 | 1.56% |
| QID | ProShares UltraShort QQQ | | 43.54 | 15 | 0.48 | -4.18 | -17.93% |
| QLD | ProShares Ultra QQQ | | 89.53 | 90 | -0.41 | 4.38 | 17.8% |
| QQQX | Nuveen Nasdaq 100 Dynamic Overwrite Fund | | 23.90 | 77 | -0.42 | 1.1 | 3.24% |
| QQQE | Direxion NASDAQ-100 Equal Wtd ETF | | 88.43 | 82 | 0.06 | 2 | 4.48% |
| QTEC | First Trust NASDAQ-100-Tech Sector ETF | | 192.24 | 95 | 0.44 | 4.03 | 9.56% |
| QQEW | First Trust NASDAQ-100 Equal Wtd ETF | | 122.85 | 64 | 0.04 | 1.98 | 4.6% |
| QQXT | First Trust NASDAQ-100 ex-Tech Sect ETF | | 89.72 | 77 | 0.16 | 1.29 | 1.81% |
| 12Stocks.com: Charts, Trends, Fundamental Data and Performances of Nasdaq 100 Stocks | |
|
We now take in-depth look at all Nasdaq 100 stocks including charts, multi-period performances and overall trends (as measured by Smart Investing & Trading Score). One can sort Nasdaq 100 stocks (click link to choose) by Daily, Weekly and by Year-to-Date performances. Also, one can sort by size of the company or by market capitalization. |
| Select Your Default Chart Type: | |||||
| |||||
| Click on stock symbol or name for detailed view. Click on to add stock symbol to your watchlist and to view watchlist. Quick View: Move mouse or cursor over "Daily" to quickly view daily technical stock chart and over "Weekly" to view weekly technical stock chart. | |||||

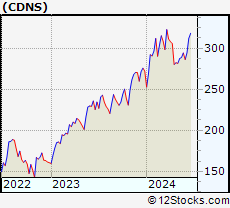 | CDNS Cadence Design Systems, Inc. |
| Sector: Technology | |
| SubSector: Application Software | |
| MarketCap: 16865.8 Millions | |
| Recent Price: 288.93 Smart Investing & Trading Score: 59 | |
| Day Percent Change: -1.42% Day Change: -4.17 | |
| Week Change: 0.5% Year-to-date Change: 6.1% | |
| CDNS Links: Profile News Message Board | |
| Charts:- Daily , Weekly | |
| Add CDNS to Watchlist: View: Get Complete CDNS Trend Analysis ➞ | |
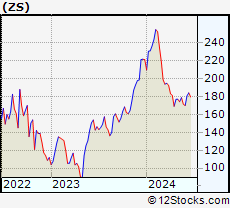 | ZS Zscaler, Inc. |
| Sector: Technology | |
| SubSector: Security Software & Services | |
| MarketCap: 7532.17 Millions | |
| Recent Price: 179.31 Smart Investing & Trading Score: 59 | |
| Day Percent Change: -1.00% Day Change: -1.82 | |
| Week Change: 2.87% Year-to-date Change: -19.1% | |
| ZS Links: Profile News Message Board | |
| Charts:- Daily , Weekly | |
| Add ZS to Watchlist: View: Get Complete ZS Trend Analysis ➞ | |
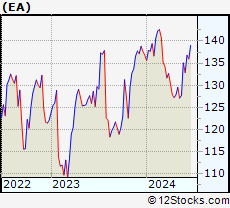 | EA Electronic Arts Inc. |
| Sector: Technology | |
| SubSector: Multimedia & Graphics Software | |
| MarketCap: 27296.5 Millions | |
| Recent Price: 129.16 Smart Investing & Trading Score: 57 | |
| Day Percent Change: 1.21% Day Change: 1.54 | |
| Week Change: 1.59% Year-to-date Change: -5.6% | |
| EA Links: Profile News Message Board | |
| Charts:- Daily , Weekly | |
| Add EA to Watchlist: View: Get Complete EA Trend Analysis ➞ | |
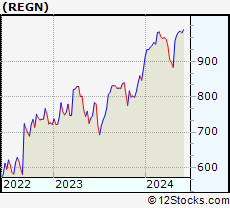 | REGN Regeneron Pharmaceuticals, Inc. |
| Sector: Health Care | |
| SubSector: Biotechnology | |
| MarketCap: 51903.7 Millions | |
| Recent Price: 967.98 Smart Investing & Trading Score: 57 | |
| Day Percent Change: -1.05% Day Change: -10.23 | |
| Week Change: -0.6% Year-to-date Change: 10.2% | |
| REGN Links: Profile News Message Board | |
| Charts:- Daily , Weekly | |
| Add REGN to Watchlist: View: Get Complete REGN Trend Analysis ➞ | |
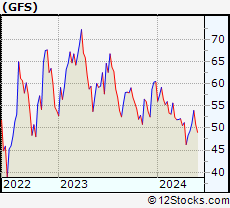 | GFS GLOBALFOUNDRIES Inc. |
| Sector: Technology | |
| SubSector: Semiconductors | |
| MarketCap: 35570 Millions | |
| Recent Price: 54.18 Smart Investing & Trading Score: 57 | |
| Day Percent Change: -0.53% Day Change: -0.29 | |
| Week Change: 6.05% Year-to-date Change: -10.5% | |
| GFS Links: Profile News Message Board | |
| Charts:- Daily , Weekly | |
| Add GFS to Watchlist: View: Get Complete GFS Trend Analysis ➞ | |
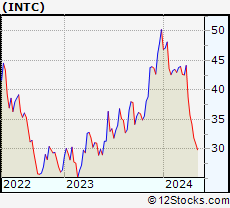 | INTC Intel Corporation |
| Sector: Technology | |
| SubSector: Semiconductor - Broad Line | |
| MarketCap: 222357 Millions | |
| Recent Price: 32.03 Smart Investing & Trading Score: 57 | |
| Day Percent Change: 2.43% Day Change: 0.76 | |
| Week Change: 7.3% Year-to-date Change: -36.3% | |
| INTC Links: Profile News Message Board | |
| Charts:- Daily , Weekly | |
| Add INTC to Watchlist: View: Get Complete INTC Trend Analysis ➞ | |
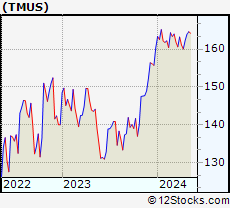 | TMUS T-Mobile US, Inc. |
| Sector: Technology | |
| SubSector: Wireless Communications | |
| MarketCap: 71949 Millions | |
| Recent Price: 163.58 Smart Investing & Trading Score: 55 | |
| Day Percent Change: 0.55% Day Change: 0.90 | |
| Week Change: -0.38% Year-to-date Change: 2.0% | |
| TMUS Links: Profile News Message Board | |
| Charts:- Daily , Weekly | |
| Add TMUS to Watchlist: View: Get Complete TMUS Trend Analysis ➞ | |
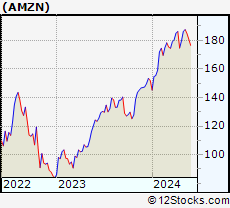 | AMZN Amazon.com, Inc. |
| Sector: Services & Goods | |
| SubSector: Catalog & Mail Order Houses | |
| MarketCap: 998070 Millions | |
| Recent Price: 183.63 Smart Investing & Trading Score: 53 | |
| Day Percent Change: -1.27% Day Change: -2.36 | |
| Week Change: -2.05% Year-to-date Change: 20.9% | |
| AMZN Links: Profile News Message Board | |
| Charts:- Daily , Weekly | |
| Add AMZN to Watchlist: View: Get Complete AMZN Trend Analysis ➞ | |
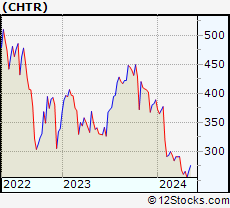 | CHTR Charter Communications, Inc. |
| Sector: Technology | |
| SubSector: CATV Systems | |
| MarketCap: 82268.3 Millions | |
| Recent Price: 277.54 Smart Investing & Trading Score: 52 | |
| Day Percent Change: 2.12% Day Change: 5.77 | |
| Week Change: 0.72% Year-to-date Change: -28.6% | |
| CHTR Links: Profile News Message Board | |
| Charts:- Daily , Weekly | |
| Add CHTR to Watchlist: View: Get Complete CHTR Trend Analysis ➞ | |
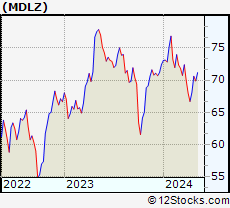 | MDLZ Mondelez International, Inc. |
| Sector: Consumer Staples | |
| SubSector: Confectioners | |
| MarketCap: 68385.8 Millions | |
| Recent Price: 71.92 Smart Investing & Trading Score: 52 | |
| Day Percent Change: 0.83% Day Change: 0.59 | |
| Week Change: 1.01% Year-to-date Change: -0.7% | |
| MDLZ Links: Profile News Message Board | |
| Charts:- Daily , Weekly | |
| Add MDLZ to Watchlist: View: Get Complete MDLZ Trend Analysis ➞ | |
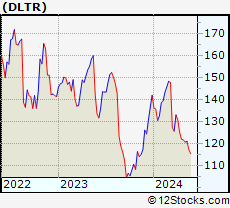 | DLTR Dollar Tree, Inc. |
| Sector: Services & Goods | |
| SubSector: Discount, Variety Stores | |
| MarketCap: 21383.2 Millions | |
| Recent Price: 121.30 Smart Investing & Trading Score: 50 | |
| Day Percent Change: 2.10% Day Change: 2.50 | |
| Week Change: 0.21% Year-to-date Change: -14.6% | |
| DLTR Links: Profile News Message Board | |
| Charts:- Daily , Weekly | |
| Add DLTR to Watchlist: View: Get Complete DLTR Trend Analysis ➞ | |
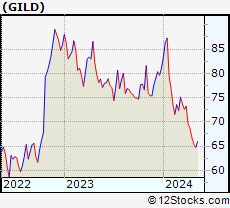 | GILD Gilead Sciences, Inc. |
| Sector: Health Care | |
| SubSector: Biotechnology | |
| MarketCap: 99485.6 Millions | |
| Recent Price: 67.86 Smart Investing & Trading Score: 50 | |
| Day Percent Change: 1.27% Day Change: 0.85 | |
| Week Change: 2.88% Year-to-date Change: -16.2% | |
| GILD Links: Profile News Message Board | |
| Charts:- Daily , Weekly | |
| Add GILD to Watchlist: View: Get Complete GILD Trend Analysis ➞ | |
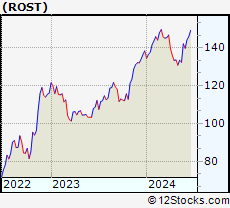 | ROST Ross Stores, Inc. |
| Sector: Services & Goods | |
| SubSector: Apparel Stores | |
| MarketCap: 24938.8 Millions | |
| Recent Price: 134.34 Smart Investing & Trading Score: 49 | |
| Day Percent Change: 1.01% Day Change: 1.34 | |
| Week Change: 0.64% Year-to-date Change: -2.9% | |
| ROST Links: Profile News Message Board | |
| Charts:- Daily , Weekly | |
| Add ROST to Watchlist: View: Get Complete ROST Trend Analysis ➞ | |
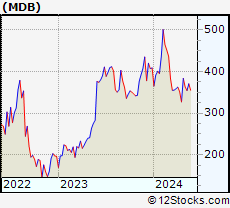 | MDB MongoDB, Inc. |
| Sector: Technology | |
| SubSector: Application Software | |
| MarketCap: 7591.22 Millions | |
| Recent Price: 369.94 Smart Investing & Trading Score: 49 | |
| Day Percent Change: -1.74% Day Change: -6.55 | |
| Week Change: 4.37% Year-to-date Change: -9.5% | |
| MDB Links: Profile News Message Board | |
| Charts:- Daily , Weekly | |
| Add MDB to Watchlist: View: Get Complete MDB Trend Analysis ➞ | |
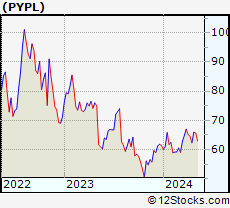 | PYPL PayPal Holdings, Inc. |
| Sector: Financials | |
| SubSector: Credit Services | |
| MarketCap: 108949 Millions | |
| Recent Price: 64.10 Smart Investing & Trading Score: 49 | |
| Day Percent Change: 0.31% Day Change: 0.20 | |
| Week Change: 1.86% Year-to-date Change: 4.4% | |
| PYPL Links: Profile News Message Board | |
| Charts:- Daily , Weekly | |
| Add PYPL to Watchlist: View: Get Complete PYPL Trend Analysis ➞ | |
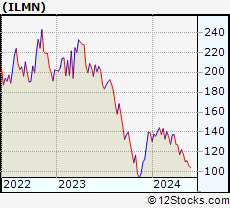 | ILMN Illumina, Inc. |
| Sector: Health Care | |
| SubSector: Biotechnology | |
| MarketCap: 39194.3 Millions | |
| Recent Price: 114.46 Smart Investing & Trading Score: 47 | |
| Day Percent Change: -0.48% Day Change: -0.55 | |
| Week Change: 3.56% Year-to-date Change: -17.8% | |
| ILMN Links: Profile News Message Board | |
| Charts:- Daily , Weekly | |
| Add ILMN to Watchlist: View: Get Complete ILMN Trend Analysis ➞ | |
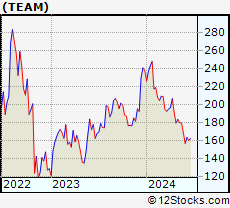 | TEAM Atlassian Corporation Plc |
| Sector: Technology | |
| SubSector: Information Technology Services | |
| MarketCap: 32265.7 Millions | |
| Recent Price: 182.21 Smart Investing & Trading Score: 45 | |
| Day Percent Change: -1.09% Day Change: -2.00 | |
| Week Change: 1.37% Year-to-date Change: -23.4% | |
| TEAM Links: Profile News Message Board | |
| Charts:- Daily , Weekly | |
| Add TEAM to Watchlist: View: Get Complete TEAM Trend Analysis ➞ | |
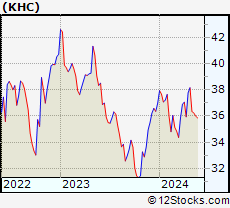 | KHC The Kraft Heinz Company |
| Sector: Consumer Staples | |
| SubSector: Food - Major Diversified | |
| MarketCap: 32096.3 Millions | |
| Recent Price: 36.07 Smart Investing & Trading Score: 43 | |
| Day Percent Change: 0.61% Day Change: 0.22 | |
| Week Change: -0.47% Year-to-date Change: -2.5% | |
| KHC Links: Profile News Message Board | |
| Charts:- Daily , Weekly | |
| Add KHC to Watchlist: View: Get Complete KHC Trend Analysis ➞ | |
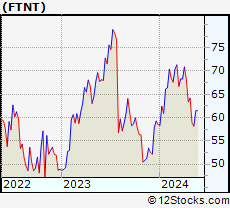 | FTNT Fortinet, Inc. |
| Sector: Technology | |
| SubSector: Application Software | |
| MarketCap: 16993.8 Millions | |
| Recent Price: 61.24 Smart Investing & Trading Score: 42 | |
| Day Percent Change: 0.84% Day Change: 0.51 | |
| Week Change: 5.3% Year-to-date Change: 4.6% | |
| FTNT Links: Profile News Message Board | |
| Charts:- Daily , Weekly | |
| Add FTNT to Watchlist: View: Get Complete FTNT Trend Analysis ➞ | |
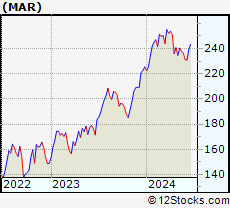 | MAR Marriott International, Inc. |
| Sector: Services & Goods | |
| SubSector: Lodging | |
| MarketCap: 25831.6 Millions | |
| Recent Price: 238.96 Smart Investing & Trading Score: 42 | |
| Day Percent Change: 1.25% Day Change: 2.96 | |
| Week Change: -0.62% Year-to-date Change: 6.0% | |
| MAR Links: Profile News Message Board | |
| Charts:- Daily , Weekly | |
| Add MAR to Watchlist: View: Get Complete MAR Trend Analysis ➞ | |
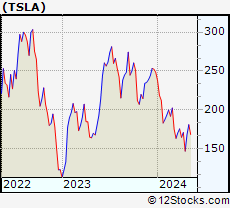 | TSLA Tesla, Inc. |
| Sector: Consumer Staples | |
| SubSector: Auto Manufacturers - Major | |
| MarketCap: 89058.8 Millions | |
| Recent Price: 174.84 Smart Investing & Trading Score: 40 | |
| Day Percent Change: 0.49% Day Change: 0.85 | |
| Week Change: 3.78% Year-to-date Change: -29.6% | |
| TSLA Links: Profile News Message Board | |
| Charts:- Daily , Weekly | |
| Add TSLA to Watchlist: View: Get Complete TSLA Trend Analysis ➞ | |
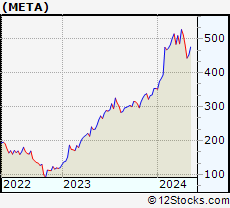 | META Meta Platforms, Inc. |
| Sector: Technology | |
| SubSector: Internet Content & Information | |
| MarketCap: 732990 Millions | |
| Recent Price: 473.23 Smart Investing & Trading Score: 40 | |
| Day Percent Change: -1.73% Day Change: -8.31 | |
| Week Change: -0.62% Year-to-date Change: 33.7% | |
| META Links: Profile News Message Board | |
| Charts:- Daily , Weekly | |
| Add META to Watchlist: View: Get Complete META Trend Analysis ➞ | |
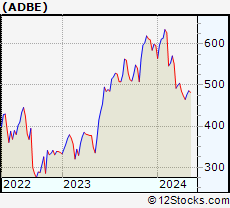 | ADBE Adobe Inc. |
| Sector: Technology | |
| SubSector: Application Software | |
| MarketCap: 157868 Millions | |
| Recent Price: 482.88 Smart Investing & Trading Score: 40 | |
| Day Percent Change: -0.51% Day Change: -2.47 | |
| Week Change: 0.12% Year-to-date Change: -19.1% | |
| ADBE Links: Profile News Message Board | |
| Charts:- Daily , Weekly | |
| Add ADBE to Watchlist: View: Get Complete ADBE Trend Analysis ➞ | |
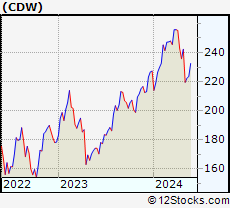 | CDW CDW Corporation |
| Sector: Technology | |
| SubSector: Information Technology Services | |
| MarketCap: 12775 Millions | |
| Recent Price: 224.14 Smart Investing & Trading Score: 39 | |
| Day Percent Change: 0.31% Day Change: 0.70 | |
| Week Change: 0.76% Year-to-date Change: -1.4% | |
| CDW Links: Profile News Message Board | |
| Charts:- Daily , Weekly | |
| Add CDW to Watchlist: View: Get Complete CDW Trend Analysis ➞ | |
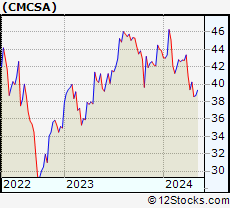 | CMCSA Comcast Corporation |
| Sector: Services & Goods | |
| SubSector: Entertainment - Diversified | |
| MarketCap: 164849 Millions | |
| Recent Price: 39.37 Smart Investing & Trading Score: 37 | |
| Day Percent Change: 0.31% Day Change: 0.12 | |
| Week Change: 0.15% Year-to-date Change: -10.2% | |
| CMCSA Links: Profile News Message Board | |
| Charts:- Daily , Weekly | |
| Add CMCSA to Watchlist: View: Get Complete CMCSA Trend Analysis ➞ | |
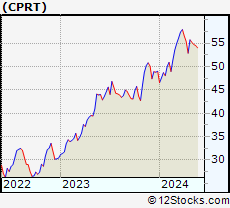 | CPRT Copart, Inc. |
| Sector: Services & Goods | |
| SubSector: Auto Dealerships | |
| MarketCap: 15462.1 Millions | |
| Recent Price: 54.58 Smart Investing & Trading Score: 34 | |
| Day Percent Change: -1.32% Day Change: -0.73 | |
| Week Change: -0.29% Year-to-date Change: 11.4% | |
| CPRT Links: Profile News Message Board | |
| Charts:- Daily , Weekly | |
| Add CPRT to Watchlist: View: Get Complete CPRT Trend Analysis ➞ | |
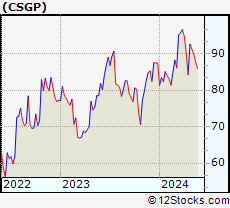 | CSGP CoStar Group, Inc. |
| Sector: Financials | |
| SubSector: Property Management | |
| MarketCap: 21454.4 Millions | |
| Recent Price: 88.13 Smart Investing & Trading Score: 34 | |
| Day Percent Change: -0.40% Day Change: -0.35 | |
| Week Change: -1.95% Year-to-date Change: 0.9% | |
| CSGP Links: Profile News Message Board | |
| Charts:- Daily , Weekly | |
| Add CSGP to Watchlist: View: Get Complete CSGP Trend Analysis ➞ | |
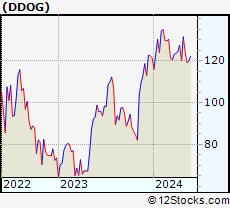 | DDOG Datadog, Inc. |
| Sector: Technology | |
| SubSector: Application Software | |
| MarketCap: 10653.2 Millions | |
| Recent Price: 120.61 Smart Investing & Trading Score: 32 | |
| Day Percent Change: 1.81% Day Change: 2.14 | |
| Week Change: 1.23% Year-to-date Change: -0.6% | |
| DDOG Links: Profile News Message Board | |
| Charts:- Daily , Weekly | |
| Add DDOG to Watchlist: View: Get Complete DDOG Trend Analysis ➞ | |
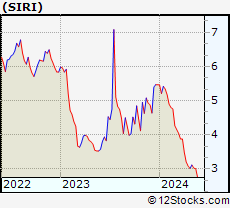 | SIRI Sirius XM Holdings Inc. |
| Sector: Services & Goods | |
| SubSector: Broadcasting - Radio | |
| MarketCap: 21325.5 Millions | |
| Recent Price: 3.05 Smart Investing & Trading Score: 32 | |
| Day Percent Change: 0.33% Day Change: 0.01 | |
| Week Change: 0.66% Year-to-date Change: -44.2% | |
| SIRI Links: Profile News Message Board | |
| Charts:- Daily , Weekly | |
| Add SIRI to Watchlist: View: Get Complete SIRI Trend Analysis ➞ | |
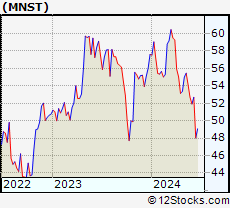 | MNST Monster Beverage Corporation |
| Sector: Consumer Staples | |
| SubSector: Beverages - Soft Drinks | |
| MarketCap: 30126.8 Millions | |
| Recent Price: 54.09 Smart Investing & Trading Score: 32 | |
| Day Percent Change: -0.28% Day Change: -0.15 | |
| Week Change: -2.47% Year-to-date Change: -6.1% | |
| MNST Links: Profile News Message Board | |
| Charts:- Daily , Weekly | |
| Add MNST to Watchlist: View: Get Complete MNST Trend Analysis ➞ | |
| For tabular summary view of above stock list: Summary View ➞ 0 - 30 , 30 - 60 , 60 - 90 , 90 - 120 | ||
| Click To Change The Sort Order: By Market Cap or Company Size Performance: Year-to-date, Week and Day | |
| Select Chart Type: | ||
|
Best Stocks Today 12Stocks.com |
© 2024 12Stocks.com Terms & Conditions Privacy Contact Us
All Information Provided Only For Education And Not To Be Used For Investing or Trading. See Terms & Conditions


One More Thing ... Get Best Stocks Delivered Daily!
Never Ever Miss A Move With Our Top Ten Stocks Lists
Find Best Stocks In Any Market - Bull or Bear Market
Take A Peek At Our Top Ten Stocks Lists: Daily, Weekly, Year-to-Date & Top Trends
Find Best Stocks In Any Market - Bull or Bear Market
Take A Peek At Our Top Ten Stocks Lists: Daily, Weekly, Year-to-Date & Top Trends
Nasdaq 100 Stocks With Best Up Trends [0-bearish to 100-bullish]: Marvell [100], Moderna [100], PepsiCo [100], DexCom [100], Google [100], Google [100], Micron [100], Trade Desk[95], Verisk Analytics[95], Pinduoduo [95], PowerShares QQQ[95]
Best Nasdaq 100 Stocks Year-to-Date:
NVIDIA [90.54%], Constellation Energy[84.73%], Micron [49.86%], Meta Platforms[33.68%], QUALCOMM [33.63%], Moderna [33.41%], CrowdStrike [32.8%], Applied Materials[32.06%], Trade Desk[29.5%], KLA [28.93%], Broadcom [26.51%] Best Nasdaq 100 Stocks This Week:
Moderna [11.05%], Intel [7.3%], Advanced Micro[7.04%], Trade Desk[6.8%], Marvell [6.73%], Walgreens Boots[6.69%], UltraPro[6.61%], Palo Alto[6.49%], QUALCOMM [6.15%], IDEXX [6.1%], GLOBALFOUNDRIES [6.05%] Best Nasdaq 100 Stocks Daily:
Marvell [4.18%], Trade Desk[3.26%], Moderna [2.80%], Walgreens Boots[2.52%], Intel [2.43%], Cognizant [2.13%], Charter [2.12%], Dollar Tree[2.10%], Workday [2.09%], PepsiCo [2.03%], Advanced Micro[1.85%]