
 Login Sign Up


| |||||
 |  | ||||

| 12Stocks.com Market Intelligence |
Best Europe Stocks
|
On this page, you will find the most comprehensive analysis of European stocks and ETFs - from latest trends to performances to charts ➞. First, here are the year-to-date (YTD) performances of the most requested Europe stocks at 12Stocks.com (click stock for review):
| Deutsche Bank 26% | ||
| SAP SE 25% | ||
| ASML Holding 22% | ||
| GlaxoSmithKline 21% | ||
| Koninklijke Philips 20% | ||
| AstraZeneca 14% | ||
| HSBC 10% | ||
| British American 8% | ||
| BP 6% | ||
| Fresenius Medical 5% | ||
| Novartis AG 2% | ||
| UBS -2% | ||
| Diageo -2% | ||
| Transocean -5% | ||
| In a hurry? Europe Stocks Lists: Performance Trends Table, Stock Charts
Sort Europe stocks: Daily, Weekly, Year-to-Date, Market Cap & Trends. Filter Europe stocks list by sector: Show all, Tech, Finance, Energy, Staples, Retail, Industrial, Materials, Utilities and HealthCare Filter Europe stocks list by size:All Europe Large Medium Small and MicroCap |
| 12Stocks.com Europe Stocks Performances & Trends Daily | |||||||||
|
|  The overall Smart Investing & Trading Score is 76 (0-bearish to 100-bullish) which puts Europe index in short term neutral to bullish trend. The Smart Investing & Trading Score from previous trading session is 95 and hence a deterioration of trend.
| ||||||||
Here are the Smart Investing & Trading Scores of the most requested Europe stocks at 12Stocks.com (click stock name for detailed review):
|


| 12Stocks.com: Top Performing Europe Index Stocks | ||||||||||||||||||||||||||||||||||||||||||||||||
 The top performing Europe Index stocks year to date are
Now, more recently, over last week, the top performing Europe Index stocks on the move are


|
||||||||||||||||||||||||||||||||||||||||||||||||
| 12Stocks.com: Investing in Europe Index with Stocks | |
|
The following table helps investors and traders sort through current performance and trends (as measured by Smart Investing & Trading Score) of various
stocks in the Europe Index. Quick View: Move mouse or cursor over stock symbol (ticker) to view short-term technical chart and over stock name to view long term chart. Click on  to add stock symbol to your watchlist and to add stock symbol to your watchlist and  to view watchlist. Click on any ticker or stock name for detailed market intelligence report for that stock. to view watchlist. Click on any ticker or stock name for detailed market intelligence report for that stock. |
12Stocks.com Performance of Stocks in Europe Index
| Ticker | Stock Name | Watchlist | Category | Recent Price | Smart Investing & Trading Score | Change % | YTD Change% |
| SLN | Silence |   | Health Care | 23.00 | 62 | 0.26% | 31.02% |
| BNTX | BioNTech SE | | Health Care | 90.61 | 61 | -2.55% | -14.15% |
| NVT | nVent Electric | | Technology | 80.01 | 58 | -0.50% | 35.40% |
| NBTX | Nanobiotix S.A | | Health Care | 7.23 | 58 | -0.41% | -2.56% |
| GENI | Genius Sports | | Services & Goods | 5.50 | 57 | 0.92% | -11.65% |
| QURE | uniQure N.V | | Health Care | 5.01 | 57 | -1.18% | -26.00% |
| IHG | InterContinental Hotels | | Services & Goods | 100.45 | 57 | 0.85% | 10.17% |
| CUK | Carnival | | Services & Goods | 13.67 | 57 | 0.74% | -18.92% |
| SQNS | Sequans | | Technology | 0.52 | 54 | 4.00% | -81.63% |
| VEON | VEON | | Technology | 25.84 | 54 | 0.35% | 31.17% |
| BP | BP | | Energy | 37.49 | 53 | 1.02% | 5.90% |
| NCNA | NuCana | | Health Care | 3.57 | 53 | -2.72% | NA |
| IHS | IHS Holding | | Services & Goods | 3.36 | 53 | -0.88% | -26.96% |
| CRSP | CRISPR | | Health Care | 56.22 | 52 | 0.99% | -10.19% |
| CLLS | Cellectis S.A | | Health Care | 2.99 | 51 | -1.64% | -2.92% |
| LYB | LyondellBasell Industries | | Materials | 100.91 | 50 | 0.97% | 6.13% |
| MOLN | Molecular Partners | | Health Care | 3.78 | 47 | -2.33% | -5.85% |
| BYNO | byNordic Acquisition | | Financials | 11.18 | 44 | 0.27% | 2.10% |
| CRTO | Criteo S.A | | Technology | 36.50 | 44 | -1.22% | 44.15% |
| DB | Deutsche Bank | | Financials | 17.08 | 43 | -0.52% | 26.05% |
| DEO | Diageo | | Consumer Staples | 142.40 | 42 | -0.38% | -2.24% |
| SNY | Sanofi | | Health Care | 48.67 | 41 | -0.31% | -2.13% |
| ASML | ASML Holding | | Technology | 924.97 | 40 | 0.59% | 22.20% |
| CPRI | Capri | | Consumer Staples | 35.95 | 40 | -0.55% | -28.44% |
| ARQQ | Arqit Quantum | | Technology | 0.44 | 37 | 10.89% | -4.42% |
| For chart view version of above stock list: Chart View ➞ 0 - 25 , 25 - 50 , 50 - 75 , 75 - 100 , 100 - 125 , 125 - 150 | ||
 | Click To Change The Sort Order: By Market Cap or Company Size Performance: Year-to-date, Week and Day |  |
|
Get the most comprehensive stock market coverage daily at 12Stocks.com ➞ Best Stocks Today ➞ Best Stocks Weekly ➞ Best Stocks Year-to-Date ➞ Best Stocks Trends ➞  Best Stocks Today 12Stocks.com Best Nasdaq Stocks ➞ Best S&P 500 Stocks ➞ Best Tech Stocks ➞ Best Biotech Stocks ➞ |
| Detailed Overview of Europe Stocks |
| Europe Technical Overview, Leaders & Laggards, Top Europe ETF Funds & Detailed Europe Stocks List, Charts, Trends & More |
| Europe: Technical Analysis, Trends & YTD Performance | |
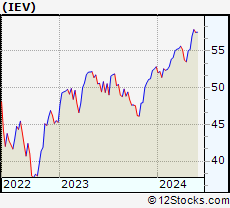
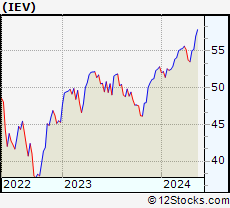
 IEV Weekly Chart |
|
| Long Term Trend: Very Good | |
| Medium Term Trend: Very Good | |
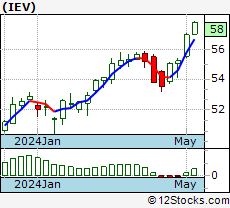
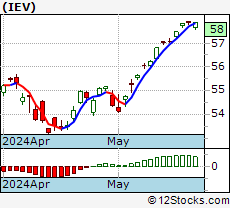 IEV Daily Chart |
|
| Short Term Trend: Good | |
| Overall Trend Score: 76 | |
| YTD Performance: 9.57% | |
| **Trend Scores & Views Are Only For Educational Purposes And Not For Investing | |
| 12Stocks.com: Investing in Europe Index using Exchange Traded Funds | |
|
The following table shows list of key exchange traded funds (ETF) that
help investors play Europe stock market. For detailed view, check out our ETF Funds section of our website. Quick View: Move mouse or cursor over ETF symbol (ticker) to view short-term technical chart and over ETF name to view long term chart. Click on ticker or stock name for detailed view. Click on to add stock symbol to your watchlist and to view watchlist. |
12Stocks.com List of ETFs that track Europe Index
| Ticker | ETF Name | Watchlist | Recent Price | Smart Investing & Trading Score | Change % | Week % | Year-to-date % |
| IEV | Europe | | 57.92 | 76 | 0.03 | 1.56 | 9.57% |
| VGK | Europe | | 70.09 | 83 | 0.00 | 1.68 | 8.7% |
| EURL | Europe Bull 3X | | 28.58 | 83 | -1.45 | 2.66 | 20.54% |
| EPV | Short Europe | | 7.25 | 17 | -0.62 | -3.15 | -15.66% |
| IEUS | Europe Small-Cap | | 59.60 | 88 | 0.32 | 3.03 | 6.05% |
| HEDJ | Europe Hedged Equity | | 48.09 | 58 | -0.19 | 0.38 | 12.23% |
| EUSC | Europe Hedged SmallCap | | 40.54 | 76 | -0.01 | 1.25 | 12.6% |
| EUFN | Europe Financials | | 24.13 | 95 | 0.67 | 2.51 | 15.12% |
| EWU | United Kingdom | | 36.74 | 83 | 0.26 | 1.63 | 11.16% |
| EWQ | France | | 42.25 | 76 | 0.09 | 0.6 | 7.84% |
| EWG | Germany | | 32.42 | 76 | 0.22 | 0.75 | 9.2% |
| EWL | Switzerland | | 48.97 | 95 | 0.31 | 2.15 | 1.45% |
| EWN | Netherlands | | 51.72 | 83 | -0.10 | 2.11 | 15.89% |
| EWI | Italy | | 39.34 | 95 | 0.08 | 3.01 | 15.94% |
| FEP | Europe AlphaDEX | | 39.49 | 88 | -0.15 | 2.09 | 8.73% |
| FDD | European Sel Div | | 12.73 | 90 | 0.35 | 2.41 | 5.46% |
| FXE | Euro | | 100.43 | 68 | 0.07 | 0.97 | -1.58% |
| 12Stocks.com: Charts, Trends, Fundamental Data and Performances of Europe Stocks | |
|
We now take in-depth look at all Europe stocks including charts, multi-period performances and overall trends (as measured by Smart Investing & Trading Score). One can sort Europe stocks (click link to choose) by Daily, Weekly and by Year-to-Date performances. Also, one can sort by size of the company or by market capitalization. |
| Select Your Default Chart Type: | |||||
| |||||
| Click on stock symbol or name for detailed view. Click on to add stock symbol to your watchlist and to view watchlist. Quick View: Move mouse or cursor over "Daily" to quickly view daily technical stock chart and over "Weekly" to view weekly technical stock chart. | |||||
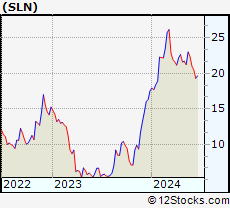 | SLN Silence Therapeutics plc |
| Sector: Health Care | |
| SubSector: Biotechnology | |
| MarketCap: 198 Millions | |
| Recent Price: 23.00 Smart Investing & Trading Score: 62 | |
| Day Percent Change: 0.26% Day Change: 0.06 | |
| Week Change: 8.44% Year-to-date Change: 31.0% | |
| SLN Links: Profile News Message Board | |
| Charts:- Daily , Weekly | |
| Add SLN to Watchlist: View: Get Complete SLN Trend Analysis ➞ | |
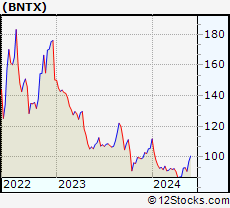 | BNTX BioNTech SE |
| Sector: Health Care | |
| SubSector: Biotechnology | |
| MarketCap: 11933.7 Millions | |
| Recent Price: 90.61 Smart Investing & Trading Score: 61 | |
| Day Percent Change: -2.55% Day Change: -2.37 | |
| Week Change: -2.5% Year-to-date Change: -14.2% | |
| BNTX Links: Profile News Message Board | |
| Charts:- Daily , Weekly | |
| Add BNTX to Watchlist: View: Get Complete BNTX Trend Analysis ➞ | |
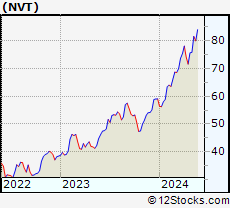 | NVT nVent Electric plc |
| Sector: Technology | |
| SubSector: Diversified Electronics | |
| MarketCap: 2752.86 Millions | |
| Recent Price: 80.01 Smart Investing & Trading Score: 58 | |
| Day Percent Change: -0.50% Day Change: -0.40 | |
| Week Change: -1.97% Year-to-date Change: 35.4% | |
| NVT Links: Profile News Message Board | |
| Charts:- Daily , Weekly | |
| Add NVT to Watchlist: View: Get Complete NVT Trend Analysis ➞ | |
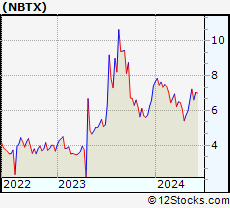 | NBTX Nanobiotix S.A. |
| Sector: Health Care | |
| SubSector: Biotechnology | |
| MarketCap: 177 Millions | |
| Recent Price: 7.23 Smart Investing & Trading Score: 58 | |
| Day Percent Change: -0.41% Day Change: -0.03 | |
| Week Change: 9.55% Year-to-date Change: -2.6% | |
| NBTX Links: Profile News Message Board | |
| Charts:- Daily , Weekly | |
| Add NBTX to Watchlist: View: Get Complete NBTX Trend Analysis ➞ | |
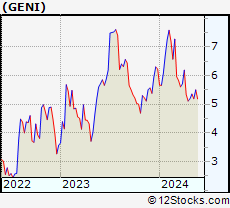 | GENI Genius Sports Limited |
| Sector: Services & Goods | |
| SubSector: Internet Content & Information | |
| MarketCap: 1410 Millions | |
| Recent Price: 5.50 Smart Investing & Trading Score: 57 | |
| Day Percent Change: 0.92% Day Change: 0.05 | |
| Week Change: 5.97% Year-to-date Change: -11.7% | |
| GENI Links: Profile News Message Board | |
| Charts:- Daily , Weekly | |
| Add GENI to Watchlist: View: Get Complete GENI Trend Analysis ➞ | |
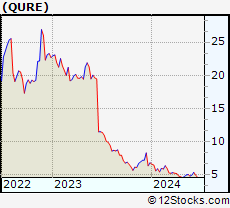 | QURE uniQure N.V. |
| Sector: Health Care | |
| SubSector: Biotechnology | |
| MarketCap: 2267.25 Millions | |
| Recent Price: 5.01 Smart Investing & Trading Score: 57 | |
| Day Percent Change: -1.18% Day Change: -0.06 | |
| Week Change: 1.83% Year-to-date Change: -26.0% | |
| QURE Links: Profile News Message Board | |
| Charts:- Daily , Weekly | |
| Add QURE to Watchlist: View: Get Complete QURE Trend Analysis ➞ | |
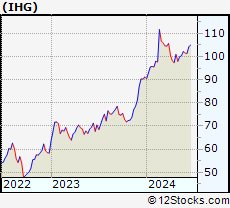 | IHG InterContinental Hotels Group PLC |
| Sector: Services & Goods | |
| SubSector: Lodging | |
| MarketCap: 6387.46 Millions | |
| Recent Price: 100.45 Smart Investing & Trading Score: 57 | |
| Day Percent Change: 0.85% Day Change: 0.85 | |
| Week Change: 0.51% Year-to-date Change: 10.2% | |
| IHG Links: Profile News Message Board | |
| Charts:- Daily , Weekly | |
| Add IHG to Watchlist: View: Get Complete IHG Trend Analysis ➞ | |
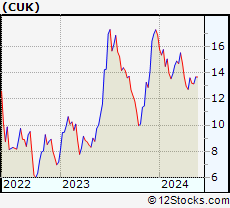 | CUK Carnival Corporation & Plc |
| Sector: Services & Goods | |
| SubSector: General Entertainment | |
| MarketCap: 10703.9 Millions | |
| Recent Price: 13.67 Smart Investing & Trading Score: 57 | |
| Day Percent Change: 0.74% Day Change: 0.10 | |
| Week Change: 3.95% Year-to-date Change: -18.9% | |
| CUK Links: Profile News Message Board | |
| Charts:- Daily , Weekly | |
| Add CUK to Watchlist: View: Get Complete CUK Trend Analysis ➞ | |
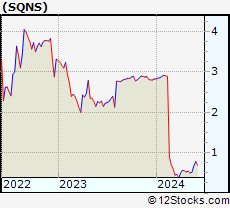 | SQNS Sequans Communications S.A. |
| Sector: Technology | |
| SubSector: Semiconductor - Integrated Circuits | |
| MarketCap: 113.61 Millions | |
| Recent Price: 0.52 Smart Investing & Trading Score: 54 | |
| Day Percent Change: 4.00% Day Change: 0.02 | |
| Week Change: 4.19% Year-to-date Change: -81.6% | |
| SQNS Links: Profile News Message Board | |
| Charts:- Daily , Weekly | |
| Add SQNS to Watchlist: View: Get Complete SQNS Trend Analysis ➞ | |
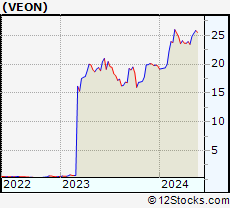 | VEON VEON Ltd. |
| Sector: Technology | |
| SubSector: Telecom Services - Foreign | |
| MarketCap: 2497.89 Millions | |
| Recent Price: 25.84 Smart Investing & Trading Score: 54 | |
| Day Percent Change: 0.35% Day Change: 0.09 | |
| Week Change: 1.89% Year-to-date Change: 31.2% | |
| VEON Links: Profile News Message Board | |
| Charts:- Daily , Weekly | |
| Add VEON to Watchlist: View: Get Complete VEON Trend Analysis ➞ | |
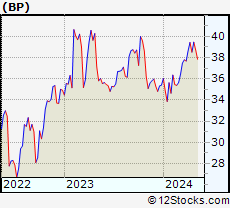 | BP BP PLC |
| Sector: Energy | |
| SubSector: Major Integrated Oil & Gas | |
| MarketCap: 66398.6 Millions | |
| Recent Price: 37.49 Smart Investing & Trading Score: 53 | |
| Day Percent Change: 1.02% Day Change: 0.38 | |
| Week Change: -0.92% Year-to-date Change: 5.9% | |
| BP Links: Profile News Message Board | |
| Charts:- Daily , Weekly | |
| Add BP to Watchlist: View: Get Complete BP Trend Analysis ➞ | |
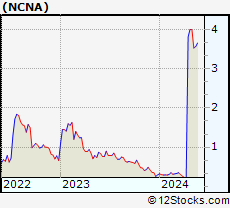 | NCNA NuCana plc |
| Sector: Health Care | |
| SubSector: Biotechnology | |
| MarketCap: 185.785 Millions | |
| Recent Price: 3.57 Smart Investing & Trading Score: 53 | |
| Day Percent Change: -2.72% Day Change: -0.10 | |
| Week Change: 1.13% Year-to-date Change: 1,106.9% | |
| NCNA Links: Profile News Message Board | |
| Charts:- Daily , Weekly | |
| Add NCNA to Watchlist: View: Get Complete NCNA Trend Analysis ➞ | |
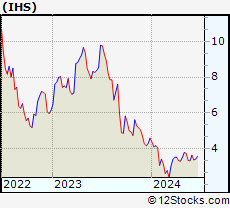 | IHS IHS Holding Limited |
| Sector: Services & Goods | |
| SubSector: Telecom Services | |
| MarketCap: 3310 Millions | |
| Recent Price: 3.36 Smart Investing & Trading Score: 53 | |
| Day Percent Change: -0.88% Day Change: -0.03 | |
| Week Change: -10.4% Year-to-date Change: -27.0% | |
| IHS Links: Profile News Message Board | |
| Charts:- Daily , Weekly | |
| Add IHS to Watchlist: View: Get Complete IHS Trend Analysis ➞ | |
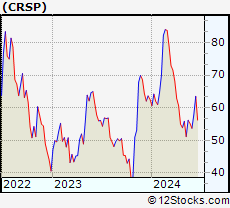 | CRSP CRISPR Therapeutics AG |
| Sector: Health Care | |
| SubSector: Biotechnology | |
| MarketCap: 2691.35 Millions | |
| Recent Price: 56.22 Smart Investing & Trading Score: 52 | |
| Day Percent Change: 0.99% Day Change: 0.55 | |
| Week Change: 9.87% Year-to-date Change: -10.2% | |
| CRSP Links: Profile News Message Board | |
| Charts:- Daily , Weekly | |
| Add CRSP to Watchlist: View: Get Complete CRSP Trend Analysis ➞ | |
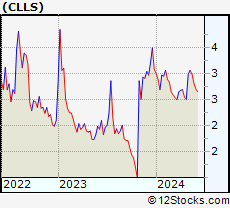 | CLLS Cellectis S.A. |
| Sector: Health Care | |
| SubSector: Biotechnology | |
| MarketCap: 398.685 Millions | |
| Recent Price: 2.99 Smart Investing & Trading Score: 51 | |
| Day Percent Change: -1.64% Day Change: -0.05 | |
| Week Change: -2.29% Year-to-date Change: -2.9% | |
| CLLS Links: Profile News Message Board | |
| Charts:- Daily , Weekly | |
| Add CLLS to Watchlist: View: Get Complete CLLS Trend Analysis ➞ | |
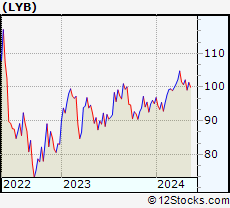 | LYB LyondellBasell Industries N.V. |
| Sector: Materials | |
| SubSector: Specialty Chemicals | |
| MarketCap: 16420.7 Millions | |
| Recent Price: 100.91 Smart Investing & Trading Score: 50 | |
| Day Percent Change: 0.97% Day Change: 0.97 | |
| Week Change: -0.45% Year-to-date Change: 6.1% | |
| LYB Links: Profile News Message Board | |
| Charts:- Daily , Weekly | |
| Add LYB to Watchlist: View: Get Complete LYB Trend Analysis ➞ | |
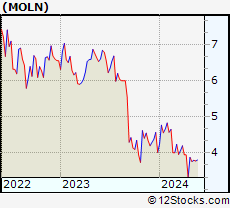 | MOLN Molecular Partners AG |
| Sector: Health Care | |
| SubSector: Biotechnology | |
| MarketCap: 216 Millions | |
| Recent Price: 3.78 Smart Investing & Trading Score: 47 | |
| Day Percent Change: -2.33% Day Change: -0.09 | |
| Week Change: -0.53% Year-to-date Change: -5.9% | |
| MOLN Links: Profile News Message Board | |
| Charts:- Daily , Weekly | |
| Add MOLN to Watchlist: View: Get Complete MOLN Trend Analysis ➞ | |
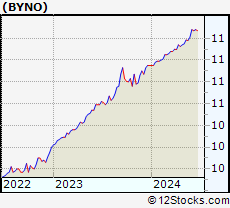 | BYNO byNordic Acquisition Corporation |
| Sector: Financials | |
| SubSector: SPAC | |
| MarketCap: 254 Millions | |
| Recent Price: 11.18 Smart Investing & Trading Score: 44 | |
| Day Percent Change: 0.27% Day Change: 0.03 | |
| Week Change: -0.04% Year-to-date Change: 2.1% | |
| BYNO Links: Profile News Message Board | |
| Charts:- Daily , Weekly | |
| Add BYNO to Watchlist: View: Get Complete BYNO Trend Analysis ➞ | |
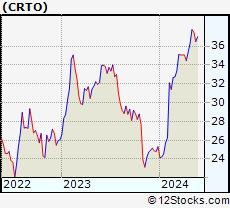 | CRTO Criteo S.A. |
| Sector: Technology | |
| SubSector: Internet Information Providers | |
| MarketCap: 515.78 Millions | |
| Recent Price: 36.50 Smart Investing & Trading Score: 44 | |
| Day Percent Change: -1.22% Day Change: -0.45 | |
| Week Change: -2.69% Year-to-date Change: 44.2% | |
| CRTO Links: Profile News Message Board | |
| Charts:- Daily , Weekly | |
| Add CRTO to Watchlist: View: Get Complete CRTO Trend Analysis ➞ | |
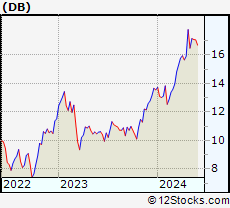 | DB Deutsche Bank Aktiengesellschaft |
| Sector: Financials | |
| SubSector: Foreign Regional Banks | |
| MarketCap: 14500.5 Millions | |
| Recent Price: 17.08 Smart Investing & Trading Score: 43 | |
| Day Percent Change: -0.52% Day Change: -0.09 | |
| Week Change: -0.35% Year-to-date Change: 26.1% | |
| DB Links: Profile News Message Board | |
| Charts:- Daily , Weekly | |
| Add DB to Watchlist: View: Get Complete DB Trend Analysis ➞ | |
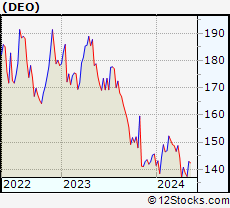 | DEO Diageo plc |
| Sector: Consumer Staples | |
| SubSector: Beverages - Wineries & Distillers | |
| MarketCap: 66740.6 Millions | |
| Recent Price: 142.40 Smart Investing & Trading Score: 42 | |
| Day Percent Change: -0.38% Day Change: -0.55 | |
| Week Change: -0.38% Year-to-date Change: -2.2% | |
| DEO Links: Profile News Message Board | |
| Charts:- Daily , Weekly | |
| Add DEO to Watchlist: View: Get Complete DEO Trend Analysis ➞ | |
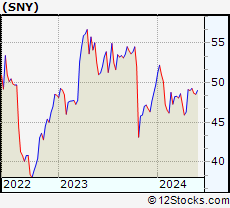 | SNY Sanofi |
| Sector: Health Care | |
| SubSector: Drug Manufacturers - Major | |
| MarketCap: 104761 Millions | |
| Recent Price: 48.67 Smart Investing & Trading Score: 41 | |
| Day Percent Change: -0.31% Day Change: -0.15 | |
| Week Change: -1.24% Year-to-date Change: -2.1% | |
| SNY Links: Profile News Message Board | |
| Charts:- Daily , Weekly | |
| Add SNY to Watchlist: View: Get Complete SNY Trend Analysis ➞ | |
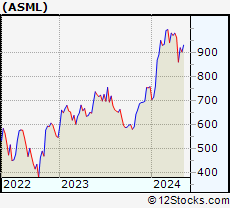 | ASML ASML Holding N.V. |
| Sector: Technology | |
| SubSector: Semiconductor Equipment & Materials | |
| MarketCap: 102565 Millions | |
| Recent Price: 924.97 Smart Investing & Trading Score: 40 | |
| Day Percent Change: 0.59% Day Change: 5.43 | |
| Week Change: -0.57% Year-to-date Change: 22.2% | |
| ASML Links: Profile News Message Board | |
| Charts:- Daily , Weekly | |
| Add ASML to Watchlist: View: Get Complete ASML Trend Analysis ➞ | |
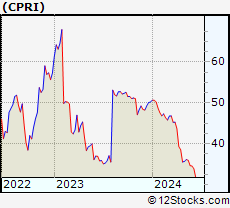 | CPRI Capri Holdings Limited |
| Sector: Consumer Staples | |
| SubSector: Textile - Apparel Clothing | |
| MarketCap: 1935.65 Millions | |
| Recent Price: 35.95 Smart Investing & Trading Score: 40 | |
| Day Percent Change: -0.55% Day Change: -0.20 | |
| Week Change: -0.48% Year-to-date Change: -28.4% | |
| CPRI Links: Profile News Message Board | |
| Charts:- Daily , Weekly | |
| Add CPRI to Watchlist: View: Get Complete CPRI Trend Analysis ➞ | |
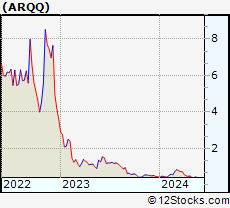 | ARQQ Arqit Quantum Inc. |
| Sector: Technology | |
| SubSector: Software - Infrastructure | |
| MarketCap: 165 Millions | |
| Recent Price: 0.44 Smart Investing & Trading Score: 37 | |
| Day Percent Change: 10.89% Day Change: 0.04 | |
| Week Change: 9.42% Year-to-date Change: -4.4% | |
| ARQQ Links: Profile News Message Board | |
| Charts:- Daily , Weekly | |
| Add ARQQ to Watchlist: View: Get Complete ARQQ Trend Analysis ➞ | |
| For tabular summary view of above stock list: Summary View ➞ 0 - 25 , 25 - 50 , 50 - 75 , 75 - 100 , 100 - 125 , 125 - 150 | ||
| Click To Change The Sort Order: By Market Cap or Company Size Performance: Year-to-date, Week and Day | |
| Select Chart Type: | ||
|
Best Stocks Today 12Stocks.com |
© 2024 12Stocks.com Terms & Conditions Privacy Contact Us
All Information Provided Only For Education And Not To Be Used For Investing or Trading. See Terms & Conditions


One More Thing ... Get Best Stocks Delivered Daily!
Never Ever Miss A Move With Our Top Ten Stocks Lists
Find Best Stocks In Any Market - Bull or Bear Market
Take A Peek At Our Top Ten Stocks Lists: Daily, Weekly, Year-to-Date & Top Trends
Find Best Stocks In Any Market - Bull or Bear Market
Take A Peek At Our Top Ten Stocks Lists: Daily, Weekly, Year-to-Date & Top Trends
Europe Stocks With Best Up Trends [0-bearish to 100-bullish]: Innate Pharma[100], On Holding[100], Inventiva S.A[100], Super [100], Rio Tinto[100], ING Groep[100], Forafric Global[100], Valneva SE[100], Manchester United[100], Sportradar [100], Vodafone [100]
Best Europe Stocks Year-to-Date:
NuCana [1106.9%], Affimed N.V[738.4%], ADC [146.99%], MorphoSys AG[91.92%], Jumia [91.78%], NewAmsterdam Pharma[78.74%], Summit [70.11%], Spotify [61.15%], Merus N.V[59.67%], MYT Netherlands[55.28%], Addex [44.33%] Best Europe Stocks This Week:
AC Immune[37.66%], On Holding[25.39%], CureVac N.V[19.93%], Paysafe [19.7%], Valneva SE[19.68%], Sportradar [15.01%], Lilium N.V[12.96%], Exscientia [12.8%], Jumia [12.65%], Vodafone [12.53%], Inventiva S.A[12.25%] Best Europe Stocks Daily:
Arqit Quantum[10.89%], Autolus [7.86%], Mynaric AG[5.88%], Innate Pharma[5.28%], On Holding[4.04%], Inventiva S.A[3.89%], Liberty Global[3.61%], Liberty Global[2.94%], Lloyds Banking[2.92%], Navigator [2.90%], Super [2.86%]