
 Login Sign Up


| |||||
 |  | ||||

| 12Stocks.com Market Intelligence |
Best Energy Stocks
| In a hurry? Energy Stocks Lists: Performance Trends Table, Stock Charts
Sort Energy stocks: Daily, Weekly, Year-to-Date, Market Cap & Trends. Filter Energy stocks list by size: All Energy Large Mid-Range Small & MicroCap |
| 12Stocks.com Energy Stocks Performances & Trends Daily | |||||||||
|
|  The overall Smart Investing & Trading Score is 46 (0-bearish to 100-bullish) which puts Energy sector in short term neutral trend. The Smart Investing & Trading Score from previous trading session is 36 and hence an improvement of trend.
| ||||||||
Here are the Smart Investing & Trading Scores of the most requested Energy stocks at 12Stocks.com (click stock name for detailed review):
|


| 12Stocks.com: Investing in Energy sector with Stocks | |
|
The following table helps investors and traders sort through current performance and trends (as measured by Smart Investing & Trading Score) of various
stocks in the Energy sector. Quick View: Move mouse or cursor over stock symbol (ticker) to view short-term Technical chart and over stock name to view long term chart. Click on  to add stock symbol to your watchlist and to add stock symbol to your watchlist and  to view watchlist. Click on any ticker or stock name for detailed market intelligence report for that stock. to view watchlist. Click on any ticker or stock name for detailed market intelligence report for that stock. |
12Stocks.com Performance of Stocks in Energy Sector
| Ticker | Stock Name | Watchlist | Category | Recent Price | Smart Investing & Trading Score | Change % | YTD Change% |
| INDO | Indonesia |   | E&P | 4.22 | 58 | 9.46 | 51.98% |
| SSL | Sasol | | Integrated | 7.10 | 42 | 5.34 | -28.57% |
| ACDC | ProFrac Holding | | Equipment | 7.12 | 17 | 5.17 | -16.33% |
| TELL | Tellurian | | Drilling & Exploration | 0.44 | 24 | 4.37 | -41.48% |
| BATL | Battalion Oil | | E&P | 5.26 | 37 | 4.20 | -45.22% |
| VAL | Valaris | | Equipment | 67.75 | 58 | 4.16 | -1.19% |
| NBR | Nabors Industries | | Drilling & Exploration | 73.27 | 42 | 4.14 | -10.24% |
| SM | SM | | Independent | 49.63 | 68 | 3.95 | 28.16% |
| TRP | TC | | Pipelines | 37.71 | 74 | 3.57 | -3.53% |
| OII | Oceaneering | | Equipment | 23.32 | 65 | 3.55 | 9.59% |
| RIG | Transocean | | Drilling & Exploration | 5.54 | 68 | 3.17 | -12.76% |
| UGP | Ultrapar Participacoes | | Refining | 5.31 | 64 | 2.91 | -2.03% |
| YPF | YPF Sociedad | | Integrated | 23.00 | 100 | 2.86 | 33.80% |
| NR | Newpark Resources | | Equipment | 7.20 | 43 | 2.49 | 8.36% |
| SDRL | Seadrill | | Drilling | 49.33 | 58 | 2.44 | 4.05% |
| DRQ | Dril-Quip | | Equipment | 18.98 | 32 | 2.40 | -18.41% |
| PUMP | ProPetro Holding | | Equipment | 9.37 | 100 | 2.29 | 11.81% |
| CLB | Core | | Equipment | 16.05 | 68 | 2.23 | -9.12% |
| EQNR | Equinor ASA | | Integrated | 27.52 | 61 | 1.95 | -13.04% |
| NE | Noble | | Drilling | 44.92 | 58 | 1.93 | -6.73% |
| VET | Vermilion | | Drilling & Exploration | 11.98 | 68 | 1.87 | -0.66% |
| LBRT | Liberty Oilfield | | Equipment | 21.73 | 20 | 1.85 | 19.76% |
| DO | Diamond Offshore | | Drilling | 12.83 | 68 | 1.83 | -1.84% |
| MTDR | Matador Resources | | Independent | 63.22 | 17 | 1.79 | 11.19% |
| OIS | Oil States | | Equipment | 4.37 | 32 | 1.75 | -35.71% |
| For chart view version of above stock list: Chart View ➞ 0 - 25 , 25 - 50 , 50 - 75 , 75 - 100 , 100 - 125 , 125 - 150 | ||
 | Click To Change The Sort Order: By Market Cap or Company Size Performance: Year-to-date, Week and Day |  |
|
Get the most comprehensive stock market coverage daily at 12Stocks.com ➞ Best Stocks Today ➞ Best Stocks Weekly ➞ Best Stocks Year-to-Date ➞ Best Stocks Trends ➞  Best Stocks Today 12Stocks.com Best Nasdaq Stocks ➞ Best S&P 500 Stocks ➞ Best Tech Stocks ➞ Best Biotech Stocks ➞ |
| Detailed Overview of Energy Stocks |
| Energy Technical Overview, Leaders & Laggards, Top Energy ETF Funds & Detailed Energy Stocks List, Charts, Trends & More |
| Energy Sector: Technical Analysis, Trends & YTD Performance | |
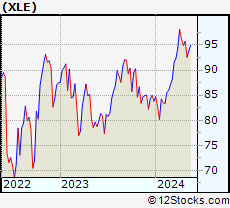
| Energy sector is composed of stocks
from oil production, refining, exploration, drilling
and services subsectors. Energy sector, as represented by XLE, an exchange-traded fund [ETF] that holds basket of Energy stocks (e.g, Exxon, Halliburton) is up by 10.26% and is currently outperforming the overall market by 3.47% year-to-date. Below is a quick view of Technical charts and trends: |
|
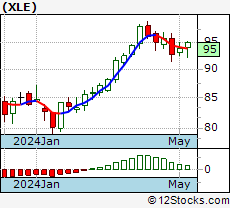 XLE Weekly Chart |
|
| Long Term Trend: Very Good | |
| Medium Term Trend: Not Good | |
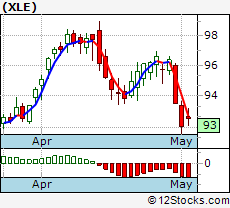 XLE Daily Chart |
|
| Short Term Trend: Not Good | |
| Overall Trend Score: 46 | |
| YTD Performance: 10.26% | |
| **Trend Scores & Views Are Only For Educational Purposes And Not For Investing | |
| 12Stocks.com: Top Performing Energy Sector Stocks | ||||||||||||||||||||||||||||||||||||||||||||||||
 The top performing Energy sector stocks year to date are
Now, more recently, over last week, the top performing Energy sector stocks on the move are


|
||||||||||||||||||||||||||||||||||||||||||||||||
| 12Stocks.com: Investing in Energy Sector using Exchange Traded Funds | |
|
The following table shows list of key exchange traded funds (ETF) that
help investors track Energy Index. For detailed view, check out our ETF Funds section of our website. Quick View: Move mouse or cursor over ETF symbol (ticker) to view short-term Technical chart and over ETF name to view long term chart. Click on ticker or stock name for detailed view. Click on to add stock symbol to your watchlist and to view watchlist. |
12Stocks.com List of ETFs that track Energy Index
| Ticker | ETF Name | Watchlist | Recent Price | Smart Investing & Trading Score | Change % | Week % | Year-to-date % |
| XLE | Energy | | 92.44 | 46 | -0.13 | -3.45 | 10.26% |
| OIH | Oil Services | | 315.63 | 58 | 1.21 | -3.17 | 1.97% |
| USO | Oil | | 75.67 | 26 | -0.34 | -5.87 | 13.53% |
| UNG | Natural Gas | | 14.92 | 52 | 0.40 | 6.12 | 194.28% |
| IYE | Energy | | 48.39 | 46 | -0.06 | -3.26 | 9.68% |
| ERX | Energy Bull 3X | | 67.11 | 41 | -0.64 | -7.17 | 18.63% |
| ERY | Energy Bear 3X | | 22.77 | 59 | 0.49 | 7.25 | -18.47% |
| DIG | Oil & Gas | | 43.43 | 46 | -0.73 | -7.46 | 18.21% |
| DUG | Short Oil & | | 9.59 | 59 | 0.63 | 7.63 | -17.54% |
| XOP | Oil & Gas | | 150.06 | 53 | 0.67 | -4.43 | 9.6% |
| 12Stocks.com: Charts, Trends, Fundamental Data and Performances of Energy Stocks | |
|
We now take in-depth look at all Energy stocks including charts, multi-period performances and overall trends (as measured by Smart Investing & Trading Score). One can sort Energy stocks (click link to choose) by Daily, Weekly and by Year-to-Date performances. Also, one can sort by size of the company or by market capitalization. |
| Select Your Default Chart Type: | |||||
| |||||
| Click on stock symbol or name for detailed view. Click on to add stock symbol to your watchlist and to view watchlist. Quick View: Move mouse or cursor over "Daily" to quickly view daily Technical stock chart and over "Weekly" to view weekly Technical stock chart. | |||||
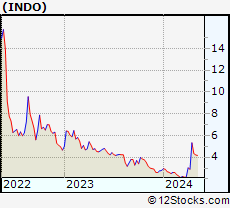 | INDO Indonesia Energy Corporation Limited |
| Sector: Energy | |
| SubSector: Oil & Gas E&P | |
| MarketCap: 32847 Millions | |
| Recent Price: 4.22 Smart Investing & Trading Score: 58 | |
| Day Percent Change: 9.46% Day Change: 0.36 | |
| Week Change: -2.87% Year-to-date Change: 52.0% | |
| INDO Links: Profile News Message Board | |
| Charts:- Daily , Weekly | |
| Add INDO to Watchlist: View: Get Complete INDO Trend Analysis ➞ | |
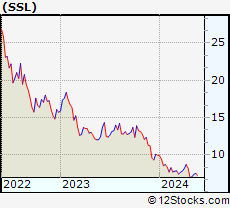 | SSL Sasol Limited |
| Sector: Energy | |
| SubSector: Major Integrated Oil & Gas | |
| MarketCap: 1233.85 Millions | |
| Recent Price: 7.10 Smart Investing & Trading Score: 42 | |
| Day Percent Change: 5.34% Day Change: 0.36 | |
| Week Change: 2.45% Year-to-date Change: -28.6% | |
| SSL Links: Profile News Message Board | |
| Charts:- Daily , Weekly | |
| Add SSL to Watchlist: View: Get Complete SSL Trend Analysis ➞ | |
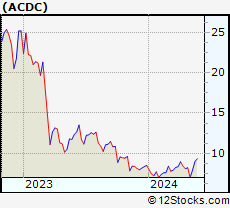 | ACDC ProFrac Holding Corp. |
| Sector: Energy | |
| SubSector: Oil & Gas Equipment & Services | |
| MarketCap: 1830 Millions | |
| Recent Price: 7.12 Smart Investing & Trading Score: 17 | |
| Day Percent Change: 5.17% Day Change: 0.35 | |
| Week Change: -13.38% Year-to-date Change: -16.3% | |
| ACDC Links: Profile News Message Board | |
| Charts:- Daily , Weekly | |
| Add ACDC to Watchlist: View: Get Complete ACDC Trend Analysis ➞ | |
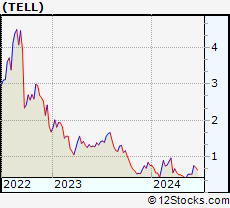 | TELL Tellurian Inc. |
| Sector: Energy | |
| SubSector: Oil & Gas Drilling & Exploration | |
| MarketCap: 245.339 Millions | |
| Recent Price: 0.44 Smart Investing & Trading Score: 24 | |
| Day Percent Change: 4.37% Day Change: 0.02 | |
| Week Change: -5.27% Year-to-date Change: -41.5% | |
| TELL Links: Profile News Message Board | |
| Charts:- Daily , Weekly | |
| Add TELL to Watchlist: View: Get Complete TELL Trend Analysis ➞ | |
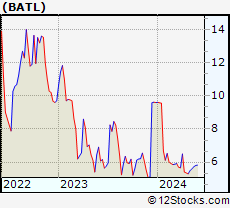 | BATL Battalion Oil Corporation |
| Sector: Energy | |
| SubSector: Oil & Gas E&P | |
| MarketCap: 12847 Millions | |
| Recent Price: 5.26 Smart Investing & Trading Score: 37 | |
| Day Percent Change: 4.20% Day Change: 0.21 | |
| Week Change: -0.72% Year-to-date Change: -45.2% | |
| BATL Links: Profile News Message Board | |
| Charts:- Daily , Weekly | |
| Add BATL to Watchlist: View: Get Complete BATL Trend Analysis ➞ | |
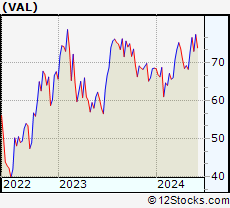 | VAL Valaris Limited |
| Sector: Energy | |
| SubSector: Oil & Gas Equipment & Services | |
| MarketCap: 4520 Millions | |
| Recent Price: 67.75 Smart Investing & Trading Score: 58 | |
| Day Percent Change: 4.16% Day Change: 2.70 | |
| Week Change: -2.09% Year-to-date Change: -1.2% | |
| VAL Links: Profile News Message Board | |
| Charts:- Daily , Weekly | |
| Add VAL to Watchlist: View: Get Complete VAL Trend Analysis ➞ | |
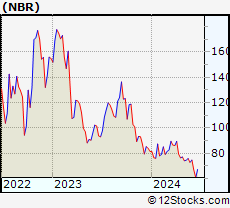 | NBR Nabors Industries Ltd. |
| Sector: Energy | |
| SubSector: Oil & Gas Drilling & Exploration | |
| MarketCap: 240.539 Millions | |
| Recent Price: 73.27 Smart Investing & Trading Score: 42 | |
| Day Percent Change: 4.14% Day Change: 2.91 | |
| Week Change: -5.09% Year-to-date Change: -10.2% | |
| NBR Links: Profile News Message Board | |
| Charts:- Daily , Weekly | |
| Add NBR to Watchlist: View: Get Complete NBR Trend Analysis ➞ | |
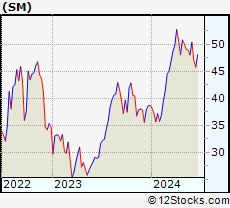 | SM SM Energy Company |
| Sector: Energy | |
| SubSector: Independent Oil & Gas | |
| MarketCap: 137.593 Millions | |
| Recent Price: 49.63 Smart Investing & Trading Score: 68 | |
| Day Percent Change: 3.95% Day Change: 1.88 | |
| Week Change: -2.39% Year-to-date Change: 28.2% | |
| SM Links: Profile News Message Board | |
| Charts:- Daily , Weekly | |
| Add SM to Watchlist: View: Get Complete SM Trend Analysis ➞ | |
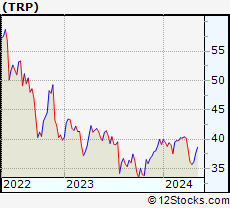 | TRP TC Energy Corporation |
| Sector: Energy | |
| SubSector: Oil & Gas Pipelines | |
| MarketCap: 44071.1 Millions | |
| Recent Price: 37.71 Smart Investing & Trading Score: 74 | |
| Day Percent Change: 3.57% Day Change: 1.30 | |
| Week Change: 4.46% Year-to-date Change: -3.5% | |
| TRP Links: Profile News Message Board | |
| Charts:- Daily , Weekly | |
| Add TRP to Watchlist: View: Get Complete TRP Trend Analysis ➞ | |
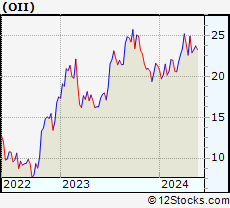 | OII Oceaneering International, Inc. |
| Sector: Energy | |
| SubSector: Oil & Gas Equipment & Services | |
| MarketCap: 324.061 Millions | |
| Recent Price: 23.32 Smart Investing & Trading Score: 65 | |
| Day Percent Change: 3.55% Day Change: 0.80 | |
| Week Change: -6.35% Year-to-date Change: 9.6% | |
| OII Links: Profile News Message Board | |
| Charts:- Daily , Weekly | |
| Add OII to Watchlist: View: Get Complete OII Trend Analysis ➞ | |
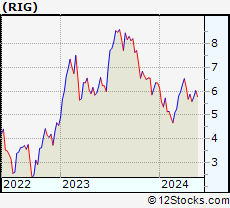 | RIG Transocean Ltd. |
| Sector: Energy | |
| SubSector: Oil & Gas Drilling & Exploration | |
| MarketCap: 646.539 Millions | |
| Recent Price: 5.54 Smart Investing & Trading Score: 68 | |
| Day Percent Change: 3.17% Day Change: 0.17 | |
| Week Change: -5.62% Year-to-date Change: -12.8% | |
| RIG Links: Profile News Message Board | |
| Charts:- Daily , Weekly | |
| Add RIG to Watchlist: View: Get Complete RIG Trend Analysis ➞ | |
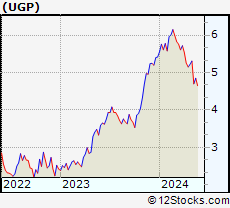 | UGP Ultrapar Participacoes S.A. |
| Sector: Energy | |
| SubSector: Oil & Gas Refining & Marketing | |
| MarketCap: 3473.54 Millions | |
| Recent Price: 5.31 Smart Investing & Trading Score: 64 | |
| Day Percent Change: 2.91% Day Change: 0.15 | |
| Week Change: 1.72% Year-to-date Change: -2.0% | |
| UGP Links: Profile News Message Board | |
| Charts:- Daily , Weekly | |
| Add UGP to Watchlist: View: Get Complete UGP Trend Analysis ➞ | |
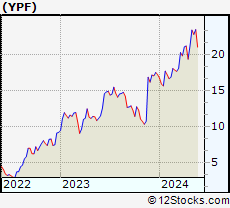 | YPF YPF Sociedad Anonima |
| Sector: Energy | |
| SubSector: Major Integrated Oil & Gas | |
| MarketCap: 2272.35 Millions | |
| Recent Price: 23.00 Smart Investing & Trading Score: 100 | |
| Day Percent Change: 2.86% Day Change: 0.64 | |
| Week Change: 8.64% Year-to-date Change: 33.8% | |
| YPF Links: Profile News Message Board | |
| Charts:- Daily , Weekly | |
| Add YPF to Watchlist: View: Get Complete YPF Trend Analysis ➞ | |
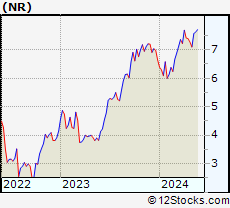 | NR Newpark Resources, Inc. |
| Sector: Energy | |
| SubSector: Oil & Gas Equipment & Services | |
| MarketCap: 109.261 Millions | |
| Recent Price: 7.20 Smart Investing & Trading Score: 43 | |
| Day Percent Change: 2.49% Day Change: 0.18 | |
| Week Change: -1.03% Year-to-date Change: 8.4% | |
| NR Links: Profile News Message Board | |
| Charts:- Daily , Weekly | |
| Add NR to Watchlist: View: Get Complete NR Trend Analysis ➞ | |
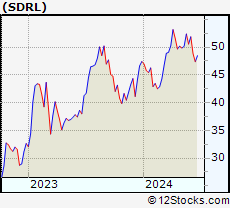 | SDRL Seadrill Limited |
| Sector: Energy | |
| SubSector: Oil & Gas Drilling | |
| MarketCap: 3300 Millions | |
| Recent Price: 49.33 Smart Investing & Trading Score: 58 | |
| Day Percent Change: 2.44% Day Change: 1.17 | |
| Week Change: -1.69% Year-to-date Change: 4.1% | |
| SDRL Links: Profile News Message Board | |
| Charts:- Daily , Weekly | |
| Add SDRL to Watchlist: View: Get Complete SDRL Trend Analysis ➞ | |
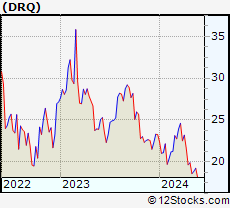 | DRQ Dril-Quip, Inc. |
| Sector: Energy | |
| SubSector: Oil & Gas Equipment & Services | |
| MarketCap: 1211.61 Millions | |
| Recent Price: 18.98 Smart Investing & Trading Score: 32 | |
| Day Percent Change: 2.40% Day Change: 0.45 | |
| Week Change: -4.65% Year-to-date Change: -18.4% | |
| DRQ Links: Profile News Message Board | |
| Charts:- Daily , Weekly | |
| Add DRQ to Watchlist: View: Get Complete DRQ Trend Analysis ➞ | |
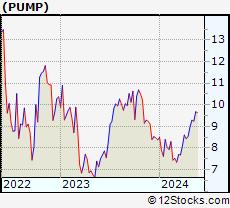 | PUMP ProPetro Holding Corp. |
| Sector: Energy | |
| SubSector: Oil & Gas Equipment & Services | |
| MarketCap: 181.261 Millions | |
| Recent Price: 9.37 Smart Investing & Trading Score: 100 | |
| Day Percent Change: 2.29% Day Change: 0.21 | |
| Week Change: 4.34% Year-to-date Change: 11.8% | |
| PUMP Links: Profile News Message Board | |
| Charts:- Daily , Weekly | |
| Add PUMP to Watchlist: View: Get Complete PUMP Trend Analysis ➞ | |
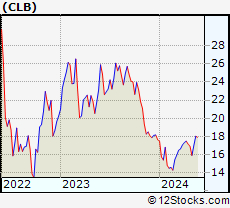 | CLB Core Laboratories N.V. |
| Sector: Energy | |
| SubSector: Oil & Gas Equipment & Services | |
| MarketCap: 599.661 Millions | |
| Recent Price: 16.05 Smart Investing & Trading Score: 68 | |
| Day Percent Change: 2.23% Day Change: 0.35 | |
| Week Change: -5.25% Year-to-date Change: -9.1% | |
| CLB Links: Profile News Message Board | |
| Charts:- Daily , Weekly | |
| Add CLB to Watchlist: View: Get Complete CLB Trend Analysis ➞ | |
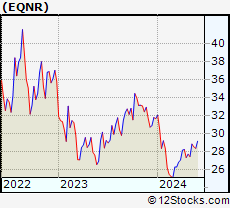 | EQNR Equinor ASA |
| Sector: Energy | |
| SubSector: Major Integrated Oil & Gas | |
| MarketCap: 37048.3 Millions | |
| Recent Price: 27.52 Smart Investing & Trading Score: 61 | |
| Day Percent Change: 1.95% Day Change: 0.53 | |
| Week Change: -0.63% Year-to-date Change: -13.0% | |
| EQNR Links: Profile News Message Board | |
| Charts:- Daily , Weekly | |
| Add EQNR to Watchlist: View: Get Complete EQNR Trend Analysis ➞ | |
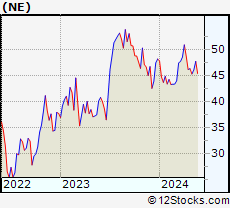 | NE Noble Corporation Plc |
| Sector: Energy | |
| SubSector: Oil & Gas Drilling | |
| MarketCap: 5520 Millions | |
| Recent Price: 44.92 Smart Investing & Trading Score: 58 | |
| Day Percent Change: 1.93% Day Change: 0.85 | |
| Week Change: -2.96% Year-to-date Change: -6.7% | |
| NE Links: Profile News Message Board | |
| Charts:- Daily , Weekly | |
| Add NE to Watchlist: View: Get Complete NE Trend Analysis ➞ | |
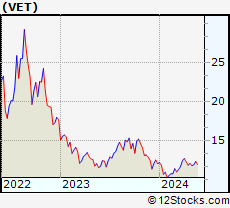 | VET Vermilion Energy Inc. |
| Sector: Energy | |
| SubSector: Oil & Gas Drilling & Exploration | |
| MarketCap: 335.839 Millions | |
| Recent Price: 11.98 Smart Investing & Trading Score: 68 | |
| Day Percent Change: 1.87% Day Change: 0.22 | |
| Week Change: -0.91% Year-to-date Change: -0.7% | |
| VET Links: Profile News Message Board | |
| Charts:- Daily , Weekly | |
| Add VET to Watchlist: View: Get Complete VET Trend Analysis ➞ | |
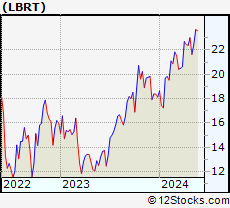 | LBRT Liberty Oilfield Services Inc. |
| Sector: Energy | |
| SubSector: Oil & Gas Equipment & Services | |
| MarketCap: 308.261 Millions | |
| Recent Price: 21.73 Smart Investing & Trading Score: 20 | |
| Day Percent Change: 1.85% Day Change: 0.40 | |
| Week Change: -5.58% Year-to-date Change: 19.8% | |
| LBRT Links: Profile News Message Board | |
| Charts:- Daily , Weekly | |
| Add LBRT to Watchlist: View: Get Complete LBRT Trend Analysis ➞ | |
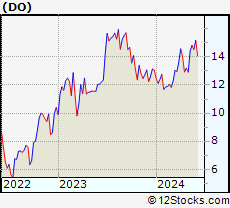 | DO Diamond Offshore Drilling, Inc. |
| Sector: Energy | |
| SubSector: Oil & Gas Drilling | |
| MarketCap: 1340 Millions | |
| Recent Price: 12.83 Smart Investing & Trading Score: 68 | |
| Day Percent Change: 1.83% Day Change: 0.23 | |
| Week Change: -2.8% Year-to-date Change: -1.8% | |
| DO Links: Profile News Message Board | |
| Charts:- Daily , Weekly | |
| Add DO to Watchlist: View: Get Complete DO Trend Analysis ➞ | |
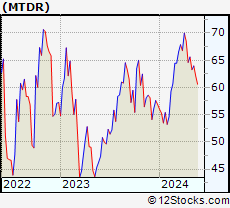 | MTDR Matador Resources Company |
| Sector: Energy | |
| SubSector: Independent Oil & Gas | |
| MarketCap: 196.593 Millions | |
| Recent Price: 63.22 Smart Investing & Trading Score: 17 | |
| Day Percent Change: 1.79% Day Change: 1.11 | |
| Week Change: -3.64% Year-to-date Change: 11.2% | |
| MTDR Links: Profile News Message Board | |
| Charts:- Daily , Weekly | |
| Add MTDR to Watchlist: View: Get Complete MTDR Trend Analysis ➞ | |
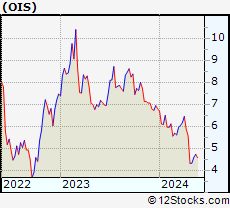 | OIS Oil States International, Inc. |
| Sector: Energy | |
| SubSector: Oil & Gas Equipment & Services | |
| MarketCap: 131.061 Millions | |
| Recent Price: 4.37 Smart Investing & Trading Score: 32 | |
| Day Percent Change: 1.75% Day Change: 0.08 | |
| Week Change: 1.28% Year-to-date Change: -35.7% | |
| OIS Links: Profile News Message Board | |
| Charts:- Daily , Weekly | |
| Add OIS to Watchlist: View: Get Complete OIS Trend Analysis ➞ | |
| For tabular summary view of above stock list: Summary View ➞ 0 - 25 , 25 - 50 , 50 - 75 , 75 - 100 , 100 - 125 , 125 - 150 | ||
| Click To Change The Sort Order: By Market Cap or Company Size Performance: Year-to-date, Week and Day | |
| Select Chart Type: | ||
|
Best Stocks Today 12Stocks.com |
© 2024 12Stocks.com Terms & Conditions Privacy Contact Us
All Information Provided Only For Education And Not To Be Used For Investing or Trading. See Terms & Conditions


One More Thing ... Get Best Stocks Delivered Daily!
Never Ever Miss A Move With Our Top Ten Stocks Lists
Find Best Stocks In Any Market - Bull or Bear Market
Take A Peek At Our Top Ten Stocks Lists: Daily, Weekly, Year-to-Date & Top Trends
Find Best Stocks In Any Market - Bull or Bear Market
Take A Peek At Our Top Ten Stocks Lists: Daily, Weekly, Year-to-Date & Top Trends
Energy Stocks With Best Up Trends [0-bearish to 100-bullish]: YPF Sociedad[100], ProPetro Holding[100], Enbridge [100], Genesis [100], Cheniere [100], National Fuel[93], Black Stone[93], Cheniere [93], Calumet Specialty[93], Flex LNG[93], Pembina Pipeline[90]
Best Energy Stocks Year-to-Date:
Indonesia [51.98%], Antero Resources[45.9%], Natural Gas[41.48%], NextDecade [36.27%], Kodiak Gas[35.34%], YPF Sociedad[33.8%], Equitrans Midstream[33.55%], Precision Drilling[30.8%], Archrock [30.75%], Targa Resources[29.24%], Diamondback [29.11%] Best Energy Stocks This Week:
YPF Sociedad[8.64%], TC [4.46%], ProPetro Holding[4.34%], Star [2.84%], Calumet Specialty[2.64%], National Fuel[2.51%], Sasol [2.45%], Cheniere [2.43%], Enbridge [2.4%], NGL [1.74%], Ultrapar Participacoes[1.72%] Best Energy Stocks Daily:
Indonesia [9.46%], Sasol [5.34%], ProFrac Holding[5.17%], Tellurian [4.37%], Battalion Oil[4.20%], Valaris [4.16%], Nabors Industries[4.14%], SM [3.95%], TC [3.57%], Oceaneering [3.55%], Transocean [3.17%]