
 Login Sign Up


| |||||
 |  | ||||

| 12Stocks.com Market Intelligence |
Best Emerging Markets Stocks
| In a hurry? Emerging Markets Stocks Lists: Trends Table, Stock Charts
Sort Emerging Markets stocks: Daily, Weekly, Year-to-Date, Market Cap & Trends. Filter Emerging Markets stocks list by sector: Show all, Tech, Finance, Energy, Staples, Retail, Industrial, Materials, Utilities and HealthCare Filter Emerging Markets stocks list by size:All Large Medium Small |
| 12Stocks.com Emerging Markets Stocks Performances & Trends Daily | |||||||||
|
|  The overall Smart Investing & Trading Score is 95 (0-bearish to 100-bullish) which puts Emerging Markets index in short term bullish trend. The Smart Investing & Trading Score from previous trading session is 100 and a deterioration of trend continues.
| ||||||||
Here are the Smart Investing & Trading Scores of the most requested Emerging Markets stocks at 12Stocks.com (click stock name for detailed review):
|


| 12Stocks.com: Top Performing Emerging Markets Index Stocks | ||||||||||||||||||||||||||||||||||||||||||||||||
 The top performing Emerging Markets Index stocks year to date are
Now, more recently, over last week, the top performing Emerging Markets Index stocks on the move are


|
||||||||||||||||||||||||||||||||||||||||||||||||
| 12Stocks.com: Investing in Emerging Markets Index with Stocks | |
|
The following table helps investors and traders sort through current performance and trends (as measured by Smart Investing & Trading Score ) of various
stocks in the Emerging Markets Index. Quick View: Move mouse or cursor over stock symbol (ticker) to view short-term technical chart and over stock name to view long term chart. Click on  to add stock symbol to your watchlist and to add stock symbol to your watchlist and  to view watchlist. Click on any ticker or stock name for detailed market intelligence report for that stock. to view watchlist. Click on any ticker or stock name for detailed market intelligence report for that stock. |
12Stocks.com Performance of Stocks in Emerging Markets Index
| Ticker | Stock Name | Watchlist | Category | Recent Price | Smart Investing & Trading Score | Change % | YTD Change% |
| ITUB | Itau Unibanco |   | Financials | 6.53 | 44 | 0.93 | -6.04% |
| VIPS | Vipshop | | Services & Goods | 17.32 | 69 | 0.93 | -2.48% |
| EH | EHang | | Industrials | 19.15 | 100 | 0.90 | 13.99% |
| WDH | Waterdrop | | Financials | 1.26 | 74 | 0.80 | 20.34% |
| BBD | Banco Bradesco | | Financials | 2.64 | 42 | 0.76 | -24.57% |
| TCOM | Trip.com | | Services & Goods | 56.83 | 95 | 0.74 | 57.82% |
| NTES | NetEase | | Technology | 104.97 | 74 | 0.73 | 12.68% |
| TWN | Taiwan Fund | | Financials | 39.99 | 83 | 0.69 | 15.62% |
| SUZ | Suzano S.A | | Consumer Staples | 10.16 | 32 | 0.69 | -10.56% |
| RC | Ready Capital | | Financials | 8.71 | 39 | 0.58 | -15.02% |
| NOAH | Noah | | Financials | 15.10 | 95 | 0.53 | 9.34% |
| SFWL | Shengfeng Development | | Industrials | 1.99 | 76 | 0.51 | -27.64% |
| BEST | BEST | | Consumer Staples | 1.99 | 32 | 0.51 | -22.01% |
| IBN | ICICI Bank | | Financials | 27.21 | 93 | 0.41 | 14.14% |
| NIO | NIO | | Consumer Staples | 5.28 | 42 | 0.38 | -41.79% |
| XPEV | XPeng | | Services & Goods | 8.30 | 60 | 0.36 | -43.11% |
| HIMX | Himax | | Technology | 6.67 | 95 | 0.30 | 9.88% |
| TV | Grupo Televisa | | Services & Goods | 3.31 | 78 | 0.30 | -0.90% |
| CINT | CI&T | | Technology | 3.39 | 10 | 0.30 | -36.34% |
| VTMX | Vesta Financials | | Financials | 36.99 | 90 | 0.30 | -6.98% |
| OMAB | Grupo Aeroportuario | | Transports | 88.92 | 95 | 0.28 | 5.07% |
| BAK | Braskem S.A | | Materials | 7.54 | 22 | 0.27 | -14.51% |
| ATAT | Atour Lifestyle | | Services & Goods | 18.58 | 60 | 0.27 | 6.05% |
| IMOS | ChipMOS | | Technology | 26.70 | 32 | 0.26 | -1.87% |
| CHT | Chunghwa Telecom | | Technology | 39.16 | 100 | 0.26 | 0.23% |
| For chart view version of above stock list: Chart View ➞ 0 - 25 , 25 - 50 , 50 - 75 , 75 - 100 , 100 - 125 , 125 - 150 , 150 - 175 , 175 - 200 | ||
 | Click To Change The Sort Order: By Market Cap or Company Size Performance: Year-to-date, Week and Day |  |
|
Get the most comprehensive stock market coverage daily at 12Stocks.com ➞ Best Stocks Today ➞ Best Stocks Weekly ➞ Best Stocks Year-to-Date ➞ Best Stocks Trends ➞  Best Stocks Today 12Stocks.com Best Nasdaq Stocks ➞ Best S&P 500 Stocks ➞ Best Tech Stocks ➞ Best Biotech Stocks ➞ |
| Detailed Overview of Emerging Markets Stocks |
| Emerging Markets Technical Overview, Leaders & Laggards, Top Emerging Markets ETF Funds & Detailed Emerging Markets Stocks List, Charts, Trends & More |
| Emerging Markets: Technical Analysis, Trends & YTD Performance | |
 EEM Weekly Chart |
|
| Long Term Trend: Very Good | |
| Medium Term Trend: Very Good | |
 EEM Daily Chart |
|
| Short Term Trend: Very Good | |
| Overall Trend Score: 95 | |
| YTD Performance: 8.9% | |
| **Trend Scores & Views Are Only For Educational Purposes And Not For Investing | |
| 12Stocks.com: Investing in Emerging Markets Index using Exchange Traded Funds | |
|
The following table shows list of key exchange traded funds (ETF) that
help investors play Emerging Markets stock market. For detailed view, check out our ETF Funds section of our website. Quick View: Move mouse or cursor over ETF symbol (ticker) to view short-term technical chart and over ETF name to view long term chart. Click on ticker or stock name for detailed view. Click on to add stock symbol to your watchlist and to view watchlist. |
12Stocks.com List of ETFs that track Emerging Markets Index
| Ticker | ETF Name | Watchlist | Recent Price | Smart Investing & Trading Score | Change % | Week % | Year-to-date % |
| EEM | Emerging Markets | | 43.79 | 95 | 0.44 | 3.04 | 8.9% |
| VWO | Emerging Markets | | 44.89 | 100 | 0.72 | 3.29 | 9.22% |
| SCHE | Emerging Markets Equity | | 27.20 | 100 | 0.63 | 3.34 | 9.72% |
| EWX | Emerging Markets Small | | 59.01 | 100 | 1.03 | 2.93 | 4.52% |
| EET | Emerging Markets | | 57.71 | 95 | 0.84 | 6.11 | 13.47% |
| EDC | Emrg Mkts Bull | | 35.76 | 95 | 1.19 | 8.96 | 17.52% |
| EEV | Short Emerging | | 16.89 | 0 | -2.09 | -6.05 | -14.37% |
| EUM | Short Emerging | | 13.19 | 10 | -0.49 | -2.84 | -6.78% |
| EDIV | Emerging Markets Dividend | | 36.11 | 100 | 0.92 | 2.73 | 11.04% |
| EMIF | Emerging Markets Infrastructure | | 23.47 | 95 | 0.38 | 2.98 | 9.67% |
| CEW | Emerging Currency Strat | | 18.13 | 100 | 0.28 | 1.46 | 0.7% |
| EBND | Em Mkts Lcl | | 20.46 | 50 | -0.05 | 1.29 | -3.67% |
| EMCB | Emerging Markets Corp | | 64.58 | 64 | -0.17 | 0 | 1.06% |
| VWOB | Emerging Mkts Govt | | 63.65 | 71 | -0.22 | 0.82 | -0.16% |
| EEMA | Emerging Markets Asia | | 73.44 | 95 | 0.25 | 3.54 | 11.09% |
| EELV | Em Mkts Low | | 24.47 | 95 | 0.23 | 1.75 | 1.79% |
| DVYE | Emerging Markets Dividend | | 29.45 | 100 | 0.89 | 3.66 | 11.17% |
| SDEM | SuperDividend Em Mkts | | 27.29 | 100 | 1.30 | 2.98 | 10.05% |
| DBEM | Em Mkts Hdgd | | 25.20 | 95 | 0.34 | 2.48 | 9.23% |
| PCY | Emerging Markets Sov | | 20.45 | 71 | -0.66 | 1.19 | -0.82% |
| QEMM | Emerging Mkts StratcFacts | | 60.71 | 100 | 0.58 | 2.57 | 6.22% |
| 12Stocks.com: Charts, Trends, Fundamental Data and Performances of Emerging Markets Stocks | |
|
We now take in-depth look at all Emerging Markets stocks including charts, multi-period performances and overall trends (as measured by Smart Investing & Trading Score ). One can sort Emerging Markets stocks (click link to choose) by Daily, Weekly and by Year-to-Date performances. Also, one can sort by size of the company or by market capitalization. |
| Select Your Default Chart Type: | |||||
| |||||
| Click on stock symbol or name for detailed view. Click on to add stock symbol to your watchlist and to view watchlist. Quick View: Move mouse or cursor over "Daily" to quickly view daily technical stock chart and over "Weekly" to view weekly technical stock chart. | |||||

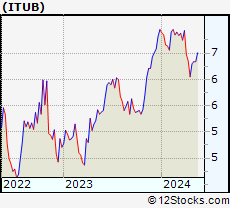 | ITUB Itau Unibanco Holding S.A. |
| Sector: Financials | |
| SubSector: Foreign Regional Banks | |
| MarketCap: 48121 Millions | |
| Recent Price: 6.53 Smart Investing & Trading Score : 44 | |
| Day Percent Change: 0.93% Day Change: 0.06 | |
| Week Change: 3% Year-to-date Change: -6.0% | |
| ITUB Links: Profile News Message Board | |
| Charts:- Daily , Weekly | |
| Add ITUB to Watchlist: View: Get Complete ITUB Trend Analysis ➞ | |
 | VIPS Vipshop Holdings Limited |
| Sector: Services & Goods | |
| SubSector: Catalog & Mail Order Houses | |
| MarketCap: 10496.2 Millions | |
| Recent Price: 17.32 Smart Investing & Trading Score : 69 | |
| Day Percent Change: 0.93% Day Change: 0.16 | |
| Week Change: 8.93% Year-to-date Change: -2.5% | |
| VIPS Links: Profile News Message Board | |
| Charts:- Daily , Weekly | |
| Add VIPS to Watchlist: View: Get Complete VIPS Trend Analysis ➞ | |
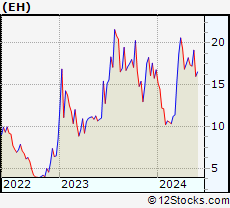 | EH EHang Holdings Limited |
| Sector: Industrials | |
| SubSector: Aerospace/Defense Products & Services | |
| MarketCap: 513.401 Millions | |
| Recent Price: 19.15 Smart Investing & Trading Score : 100 | |
| Day Percent Change: 0.90% Day Change: 0.17 | |
| Week Change: 11.01% Year-to-date Change: 14.0% | |
| EH Links: Profile News Message Board | |
| Charts:- Daily , Weekly | |
| Add EH to Watchlist: View: Get Complete EH Trend Analysis ➞ | |
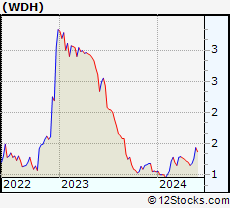 | WDH Waterdrop Inc. |
| Sector: Financials | |
| SubSector: Insurance - Diversified | |
| MarketCap: 874 Millions | |
| Recent Price: 1.26 Smart Investing & Trading Score : 74 | |
| Day Percent Change: 0.80% Day Change: 0.01 | |
| Week Change: 6.78% Year-to-date Change: 20.3% | |
| WDH Links: Profile News Message Board | |
| Charts:- Daily , Weekly | |
| Add WDH to Watchlist: View: Get Complete WDH Trend Analysis ➞ | |
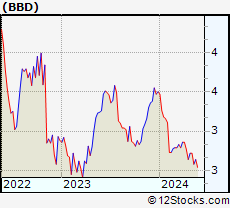 | BBD Banco Bradesco S.A. |
| Sector: Financials | |
| SubSector: Foreign Regional Banks | |
| MarketCap: 30281.7 Millions | |
| Recent Price: 2.64 Smart Investing & Trading Score : 42 | |
| Day Percent Change: 0.76% Day Change: 0.02 | |
| Week Change: 2.33% Year-to-date Change: -24.6% | |
| BBD Links: Profile News Message Board | |
| Charts:- Daily , Weekly | |
| Add BBD to Watchlist: View: Get Complete BBD Trend Analysis ➞ | |
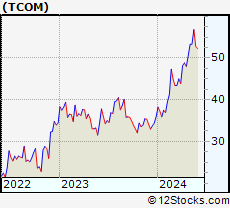 | TCOM Trip.com Group Limited |
| Sector: Services & Goods | |
| SubSector: Lodging | |
| MarketCap: 13449.6 Millions | |
| Recent Price: 56.83 Smart Investing & Trading Score : 95 | |
| Day Percent Change: 0.74% Day Change: 0.42 | |
| Week Change: 6.52% Year-to-date Change: 57.8% | |
| TCOM Links: Profile News Message Board | |
| Charts:- Daily , Weekly | |
| Add TCOM to Watchlist: View: Get Complete TCOM Trend Analysis ➞ | |
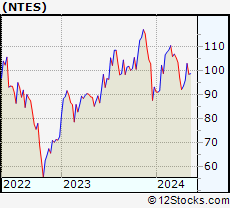 | NTES NetEase, Inc. |
| Sector: Technology | |
| SubSector: Internet Software & Services | |
| MarketCap: 40105.1 Millions | |
| Recent Price: 104.97 Smart Investing & Trading Score : 74 | |
| Day Percent Change: 0.73% Day Change: 0.76 | |
| Week Change: 6.54% Year-to-date Change: 12.7% | |
| NTES Links: Profile News Message Board | |
| Charts:- Daily , Weekly | |
| Add NTES to Watchlist: View: Get Complete NTES Trend Analysis ➞ | |
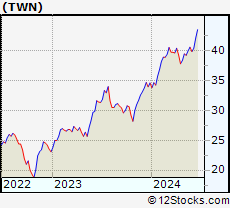 | TWN The Taiwan Fund, Inc. |
| Sector: Financials | |
| SubSector: Closed-End Fund - Foreign | |
| MarketCap: 110.547 Millions | |
| Recent Price: 39.99 Smart Investing & Trading Score : 83 | |
| Day Percent Change: 0.69% Day Change: 0.27 | |
| Week Change: 1.96% Year-to-date Change: 15.6% | |
| TWN Links: Profile News Message Board | |
| Charts:- Daily , Weekly | |
| Add TWN to Watchlist: View: Get Complete TWN Trend Analysis ➞ | |
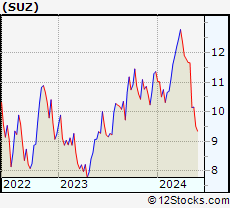 | SUZ Suzano S.A. |
| Sector: Consumer Staples | |
| SubSector: Paper & Paper Products | |
| MarketCap: 7042.93 Millions | |
| Recent Price: 10.16 Smart Investing & Trading Score : 32 | |
| Day Percent Change: 0.69% Day Change: 0.07 | |
| Week Change: 0.1% Year-to-date Change: -10.6% | |
| SUZ Links: Profile News Message Board | |
| Charts:- Daily , Weekly | |
| Add SUZ to Watchlist: View: Get Complete SUZ Trend Analysis ➞ | |
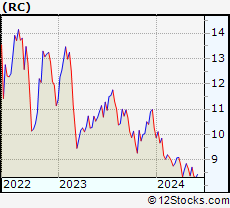 | RC Ready Capital Corporation |
| Sector: Financials | |
| SubSector: Mortgage Investment | |
| MarketCap: 358.039 Millions | |
| Recent Price: 8.71 Smart Investing & Trading Score : 39 | |
| Day Percent Change: 0.58% Day Change: 0.05 | |
| Week Change: 4.06% Year-to-date Change: -15.0% | |
| RC Links: Profile News Message Board | |
| Charts:- Daily , Weekly | |
| Add RC to Watchlist: View: Get Complete RC Trend Analysis ➞ | |
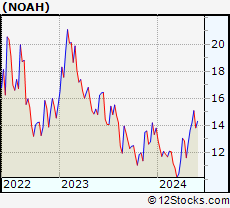 | NOAH Noah Holdings Limited |
| Sector: Financials | |
| SubSector: Asset Management | |
| MarketCap: 1495.33 Millions | |
| Recent Price: 15.10 Smart Investing & Trading Score : 95 | |
| Day Percent Change: 0.53% Day Change: 0.08 | |
| Week Change: 6.26% Year-to-date Change: 9.3% | |
| NOAH Links: Profile News Message Board | |
| Charts:- Daily , Weekly | |
| Add NOAH to Watchlist: View: Get Complete NOAH Trend Analysis ➞ | |
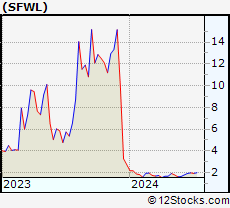 | SFWL Shengfeng Development Limited |
| Sector: Industrials | |
| SubSector: Integrated Freight & Logistics | |
| MarketCap: 747 Millions | |
| Recent Price: 1.99 Smart Investing & Trading Score : 76 | |
| Day Percent Change: 0.51% Day Change: 0.01 | |
| Week Change: 3.11% Year-to-date Change: -27.6% | |
| SFWL Links: Profile News Message Board | |
| Charts:- Daily , Weekly | |
| Add SFWL to Watchlist: View: Get Complete SFWL Trend Analysis ➞ | |
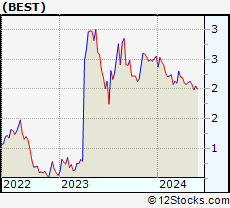 | BEST BEST Inc. |
| Sector: Consumer Staples | |
| SubSector: Packaging & Containers | |
| MarketCap: 1981.73 Millions | |
| Recent Price: 1.99 Smart Investing & Trading Score : 32 | |
| Day Percent Change: 0.51% Day Change: 0.01 | |
| Week Change: -4.33% Year-to-date Change: -22.0% | |
| BEST Links: Profile News Message Board | |
| Charts:- Daily , Weekly | |
| Add BEST to Watchlist: View: Get Complete BEST Trend Analysis ➞ | |
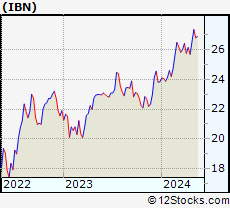 | IBN ICICI Bank Limited |
| Sector: Financials | |
| SubSector: Money Center Banks | |
| MarketCap: 31194.1 Millions | |
| Recent Price: 27.21 Smart Investing & Trading Score : 93 | |
| Day Percent Change: 0.41% Day Change: 0.11 | |
| Week Change: 1.57% Year-to-date Change: 14.1% | |
| IBN Links: Profile News Message Board | |
| Charts:- Daily , Weekly | |
| Add IBN to Watchlist: View: Get Complete IBN Trend Analysis ➞ | |
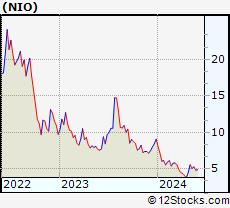 | NIO NIO Limited |
| Sector: Consumer Staples | |
| SubSector: Auto Manufacturers - Major | |
| MarketCap: 2679.71 Millions | |
| Recent Price: 5.28 Smart Investing & Trading Score : 42 | |
| Day Percent Change: 0.38% Day Change: 0.02 | |
| Week Change: 4.24% Year-to-date Change: -41.8% | |
| NIO Links: Profile News Message Board | |
| Charts:- Daily , Weekly | |
| Add NIO to Watchlist: View: Get Complete NIO Trend Analysis ➞ | |
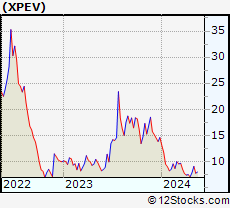 | XPEV XPeng Inc. |
| Sector: Services & Goods | |
| SubSector: Auto Manufacturers | |
| MarketCap: 32917 Millions | |
| Recent Price: 8.30 Smart Investing & Trading Score : 60 | |
| Day Percent Change: 0.36% Day Change: 0.03 | |
| Week Change: 7.37% Year-to-date Change: -43.1% | |
| XPEV Links: Profile News Message Board | |
| Charts:- Daily , Weekly | |
| Add XPEV to Watchlist: View: Get Complete XPEV Trend Analysis ➞ | |
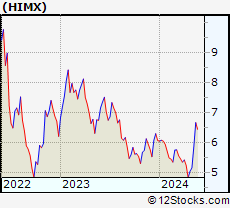 | HIMX Himax Technologies, Inc. |
| Sector: Technology | |
| SubSector: Semiconductor - Specialized | |
| MarketCap: 496.16 Millions | |
| Recent Price: 6.67 Smart Investing & Trading Score : 95 | |
| Day Percent Change: 0.30% Day Change: 0.02 | |
| Week Change: 13.92% Year-to-date Change: 9.9% | |
| HIMX Links: Profile News Message Board | |
| Charts:- Daily , Weekly | |
| Add HIMX to Watchlist: View: Get Complete HIMX Trend Analysis ➞ | |
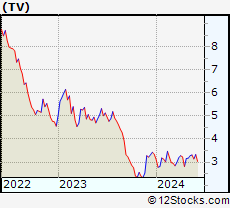 | TV Grupo Televisa, S.A.B. |
| Sector: Services & Goods | |
| SubSector: Broadcasting - TV | |
| MarketCap: 3740.43 Millions | |
| Recent Price: 3.31 Smart Investing & Trading Score : 78 | |
| Day Percent Change: 0.30% Day Change: 0.01 | |
| Week Change: 0.91% Year-to-date Change: -0.9% | |
| TV Links: Profile News Message Board | |
| Charts:- Daily , Weekly | |
| Add TV to Watchlist: View: Get Complete TV Trend Analysis ➞ | |
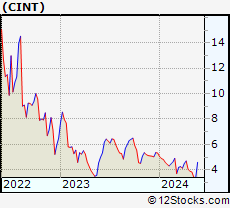 | CINT CI&T Inc |
| Sector: Technology | |
| SubSector: Software - Infrastructure | |
| MarketCap: 806 Millions | |
| Recent Price: 3.39 Smart Investing & Trading Score : 10 | |
| Day Percent Change: 0.30% Day Change: 0.01 | |
| Week Change: -0.88% Year-to-date Change: -36.3% | |
| CINT Links: Profile News Message Board | |
| Charts:- Daily , Weekly | |
| Add CINT to Watchlist: View: Get Complete CINT Trend Analysis ➞ | |
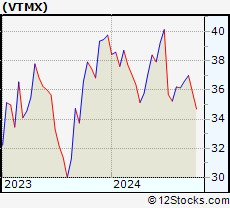 | VTMX Vesta Financials Corp SAB de CV |
| Sector: Financials | |
| SubSector: REIT - Industrial | |
| MarketCap: 2270 Millions | |
| Recent Price: 36.99 Smart Investing & Trading Score : 90 | |
| Day Percent Change: 0.30% Day Change: 0.11 | |
| Week Change: 1.04% Year-to-date Change: -7.0% | |
| VTMX Links: Profile News Message Board | |
| Charts:- Daily , Weekly | |
| Add VTMX to Watchlist: View: Get Complete VTMX Trend Analysis ➞ | |
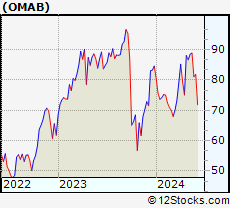 | OMAB Grupo Aeroportuario del Centro Norte, S.A.B. de C.V. |
| Sector: Transports | |
| SubSector: Air Services, Other | |
| MarketCap: 1196.38 Millions | |
| Recent Price: 88.92 Smart Investing & Trading Score : 95 | |
| Day Percent Change: 0.28% Day Change: 0.25 | |
| Week Change: 0.46% Year-to-date Change: 5.1% | |
| OMAB Links: Profile News Message Board | |
| Charts:- Daily , Weekly | |
| Add OMAB to Watchlist: View: Get Complete OMAB Trend Analysis ➞ | |
 | BAK Braskem S.A. |
| Sector: Materials | |
| SubSector: Chemicals - Major Diversified | |
| MarketCap: 2715.86 Millions | |
| Recent Price: 7.54 Smart Investing & Trading Score : 22 | |
| Day Percent Change: 0.27% Day Change: 0.02 | |
| Week Change: 2.45% Year-to-date Change: -14.5% | |
| BAK Links: Profile News Message Board | |
| Charts:- Daily , Weekly | |
| Add BAK to Watchlist: View: Get Complete BAK Trend Analysis ➞ | |
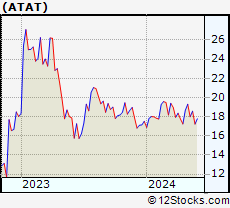 | ATAT Atour Lifestyle Holdings Limited |
| Sector: Services & Goods | |
| SubSector: Lodging | |
| MarketCap: 2120 Millions | |
| Recent Price: 18.58 Smart Investing & Trading Score : 60 | |
| Day Percent Change: 0.27% Day Change: 0.05 | |
| Week Change: 3.28% Year-to-date Change: 6.1% | |
| ATAT Links: Profile News Message Board | |
| Charts:- Daily , Weekly | |
| Add ATAT to Watchlist: View: Get Complete ATAT Trend Analysis ➞ | |
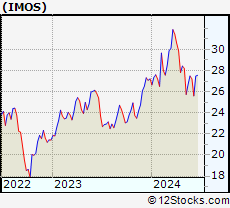 | IMOS ChipMOS TECHNOLOGIES INC. |
| Sector: Technology | |
| SubSector: Semiconductor Equipment & Materials | |
| MarketCap: 658.918 Millions | |
| Recent Price: 26.70 Smart Investing & Trading Score : 32 | |
| Day Percent Change: 0.26% Day Change: 0.07 | |
| Week Change: 3.73% Year-to-date Change: -1.9% | |
| IMOS Links: Profile News Message Board | |
| Charts:- Daily , Weekly | |
| Add IMOS to Watchlist: View: Get Complete IMOS Trend Analysis ➞ | |
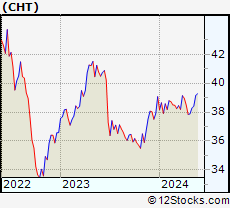 | CHT Chunghwa Telecom Co., Ltd. |
| Sector: Technology | |
| SubSector: Telecom Services - Domestic | |
| MarketCap: 28101.3 Millions | |
| Recent Price: 39.16 Smart Investing & Trading Score : 100 | |
| Day Percent Change: 0.26% Day Change: 0.10 | |
| Week Change: 1.93% Year-to-date Change: 0.2% | |
| CHT Links: Profile News Message Board | |
| Charts:- Daily , Weekly | |
| Add CHT to Watchlist: View: Get Complete CHT Trend Analysis ➞ | |
| For tabular summary view of above stock list: Summary View ➞ 0 - 25 , 25 - 50 , 50 - 75 , 75 - 100 , 100 - 125 , 125 - 150 , 150 - 175 , 175 - 200 | ||
| Click To Change The Sort Order: By Market Cap or Company Size Performance: Year-to-date, Week and Day | |
| Select Chart Type: | ||
|
Best Stocks Today 12Stocks.com |
© 2024 12Stocks.com Terms & Conditions Privacy Contact Us
All Information Provided Only For Education And Not To Be Used For Investing or Trading. See Terms & Conditions


One More Thing ... Get Best Stocks Delivered Daily!
Never Ever Miss A Move With Our Top Ten Stocks Lists
Find Best Stocks In Any Market - Bull or Bear Market
Take A Peek At Our Top Ten Stocks Lists: Daily, Weekly, Year-to-Date & Top Trends
Find Best Stocks In Any Market - Bull or Bear Market
Take A Peek At Our Top Ten Stocks Lists: Daily, Weekly, Year-to-Date & Top Trends
Emerging Markets Stocks With Best Up Trends [0-bearish to 100-bullish]: Fangdd Network[100], 36Kr [100], Cheetah Mobile[100], Boqii Holding[100], DRDGOLD [100], ZTO Express[100], Full Truck[100], Sibanye Stillwater[100], Embraer S.A[100], GDS [100], JD.com [100]
Best Emerging Markets Stocks Year-to-Date:
U Power[3454.69%], DouYu [1040%], Burning Rock[760.19%], China Liberal[576.73%], Yatsen Holding[515.09%], MicroCloud Hologram[495.68%], Uxin [355.06%], Zhihu [349.45%], Zhongchao [313.59%], Fangdd Network[149.63%], Smart Share[121.36%] Best Emerging Markets Stocks This Week:
Burning Rock[946.66%], Fangdd Network[360.27%], HUYA [36.36%], Viomi [27.4%], Uxin [27.09%], MOGU [24.34%], Huize Holding[21.83%], MicroCloud Hologram[21.76%], U Power[20.64%], Bilibili [19.47%], Embraer S.A[19.33%] Best Emerging Markets Stocks Daily:
Fangdd Network[321.26%], Golden Heaven[16.00%], 17 Education[12.89%], China Liberal[11.01%], 36Kr [10.41%], Cheetah Mobile[10.34%], Zhihu [8.42%], MicroCloud Hologram[8.38%], Hywin [8.28%], iHuman [7.89%], AMTD Digital[7.37%]