
 Login Sign Up


| |||||
 |  | ||||

| 12Stocks.com Market Intelligence |
Best Emerging Markets Stocks
| In a hurry? Emerging Markets Stocks Lists: Trends Table, Stock Charts
Sort Emerging Markets stocks: Daily, Weekly, Year-to-Date, Market Cap & Trends. Filter Emerging Markets stocks list by sector: Show all, Tech, Finance, Energy, Staples, Retail, Industrial, Materials, Utilities and HealthCare Filter Emerging Markets stocks list by size:All Large Medium Small |
| 12Stocks.com Emerging Markets Stocks Performances & Trends Daily | |||||||||
|
|  The overall Smart Investing & Trading Score is 95 (0-bearish to 100-bullish) which puts Emerging Markets index in short term bullish trend. The Smart Investing & Trading Score from previous trading session is 100 and a deterioration of trend continues.
| ||||||||
Here are the Smart Investing & Trading Scores of the most requested Emerging Markets stocks at 12Stocks.com (click stock name for detailed review):
|


| 12Stocks.com: Top Performing Emerging Markets Index Stocks | ||||||||||||||||||||||||||||||||||||||||||||||||
 The top performing Emerging Markets Index stocks year to date are
Now, more recently, over last week, the top performing Emerging Markets Index stocks on the move are


|
||||||||||||||||||||||||||||||||||||||||||||||||
| 12Stocks.com: Investing in Emerging Markets Index with Stocks | |
|
The following table helps investors and traders sort through current performance and trends (as measured by Smart Investing & Trading Score ) of various
stocks in the Emerging Markets Index. Quick View: Move mouse or cursor over stock symbol (ticker) to view short-term technical chart and over stock name to view long term chart. Click on  to add stock symbol to your watchlist and to add stock symbol to your watchlist and  to view watchlist. Click on any ticker or stock name for detailed market intelligence report for that stock. to view watchlist. Click on any ticker or stock name for detailed market intelligence report for that stock. |
12Stocks.com Performance of Stocks in Emerging Markets Index
| Ticker | Stock Name | Watchlist | Category | Recent Price | Smart Investing & Trading Score | Change % | YTD Change% |
| TWN | Taiwan Fund |   | Financials | 39.99 | 83 | 0.69% | 15.62% |
| ZTO | ZTO Express | | Transports | 24.59 | 100 | 4.28% | 15.55% |
| BZUN | Baozun | | Services & Goods | 3.15 | 95 | 1.94% | 14.96% |
| YJ | Yunji | | Services & Goods | 0.82 | 88 | 6.10% | 14.92% |
| INTR | Inter & Co | | Financials | 6.42 | 100 | 1.90% | 14.54% |
| BABA | Alibaba | | Services & Goods | 88.54 | 100 | 2.12% | 14.23% |
| IBN | ICICI Bank | | Financials | 27.21 | 93 | 0.41% | 14.14% |
| EH | EHang | | Industrials | 19.15 | 100 | 0.90% | 13.99% |
| GFI | Gold Fields | | Materials | 16.32 | 46 | 3.36% | 12.86% |
| NTES | NetEase | | Technology | 104.97 | 74 | 0.73% | 12.68% |
| CIG | Companhia Energetica | | Utilities | 2.61 | 100 | 1.56% | 12.50% |
| EDU | New Oriental | | Services & Goods | 82.17 | 7 | -1.87% | 12.13% |
| ASX | ASE | | Technology | 10.52 | 61 | 0.19% | 11.80% |
| JG | Aurora Mobile | | Technology | 3.18 | 90 | -0.63% | 11.50% |
| HCM | Hutchison China | | Health Care | 20.17 | 63 | -3.77% | 11.37% |
| API | Agora | | Technology | 2.92 | 90 | -1.02% | 10.61% |
| PAC | Grupo Aeroportuario | | Transports | 193.63 | 95 | -0.06% | 10.51% |
| HIMX | Himax | | Technology | 6.67 | 95 | 0.30% | 9.88% |
| NOAH | Noah | | Financials | 15.10 | 95 | 0.53% | 9.34% |
| NIU | Niu | | Consumer Staples | 2.39 | 58 | -3.24% | 9.13% |
| XYF | X Financial | | Financials | 3.97 | 57 | 1.79% | 8.47% |
| XNET | Xunlei | | Technology | 1.75 | 85 | 3.24% | 8.02% |
| IQ | iQIYI | | Technology | 5.26 | 83 | -9.15% | 7.79% |
| AMX | America Movil | | Technology | 19.75 | 83 | 0.10% | 6.64% |
| ATAT | Atour Lifestyle | | Services & Goods | 18.58 | 60 | 0.27% | 6.05% |
| For chart view version of above stock list: Chart View ➞ 0 - 25 , 25 - 50 , 50 - 75 , 75 - 100 , 100 - 125 , 125 - 150 , 150 - 175 , 175 - 200 | ||
 | Click To Change The Sort Order: By Market Cap or Company Size Performance: Year-to-date, Week and Day |  |
|
Get the most comprehensive stock market coverage daily at 12Stocks.com ➞ Best Stocks Today ➞ Best Stocks Weekly ➞ Best Stocks Year-to-Date ➞ Best Stocks Trends ➞  Best Stocks Today 12Stocks.com Best Nasdaq Stocks ➞ Best S&P 500 Stocks ➞ Best Tech Stocks ➞ Best Biotech Stocks ➞ |
| Detailed Overview of Emerging Markets Stocks |
| Emerging Markets Technical Overview, Leaders & Laggards, Top Emerging Markets ETF Funds & Detailed Emerging Markets Stocks List, Charts, Trends & More |
| Emerging Markets: Technical Analysis, Trends & YTD Performance | |
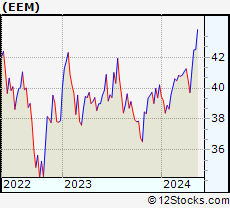
 EEM Weekly Chart |
|
| Long Term Trend: Very Good | |
| Medium Term Trend: Very Good | |
 EEM Daily Chart |
|
| Short Term Trend: Very Good | |
| Overall Trend Score: 95 | |
| YTD Performance: 8.9% | |
| **Trend Scores & Views Are Only For Educational Purposes And Not For Investing | |
| 12Stocks.com: Investing in Emerging Markets Index using Exchange Traded Funds | |
|
The following table shows list of key exchange traded funds (ETF) that
help investors play Emerging Markets stock market. For detailed view, check out our ETF Funds section of our website. Quick View: Move mouse or cursor over ETF symbol (ticker) to view short-term technical chart and over ETF name to view long term chart. Click on ticker or stock name for detailed view. Click on to add stock symbol to your watchlist and to view watchlist. |
12Stocks.com List of ETFs that track Emerging Markets Index
| Ticker | ETF Name | Watchlist | Recent Price | Smart Investing & Trading Score | Change % | Week % | Year-to-date % |
| EEM | Emerging Markets | | 43.79 | 95 | 0.44 | 3.04 | 8.9% |
| VWO | Emerging Markets | | 44.89 | 100 | 0.72 | 3.29 | 9.22% |
| SCHE | Emerging Markets Equity | | 27.20 | 100 | 0.63 | 3.34 | 9.72% |
| EWX | Emerging Markets Small | | 59.01 | 100 | 1.03 | 2.93 | 4.52% |
| EET | Emerging Markets | | 57.71 | 95 | 0.84 | 6.11 | 13.47% |
| EDC | Emrg Mkts Bull | | 35.76 | 95 | 1.19 | 8.96 | 17.52% |
| EEV | Short Emerging | | 16.89 | 0 | -2.09 | -6.05 | -14.37% |
| EUM | Short Emerging | | 13.19 | 10 | -0.49 | -2.84 | -6.78% |
| EDIV | Emerging Markets Dividend | | 36.11 | 100 | 0.92 | 2.73 | 11.04% |
| EMIF | Emerging Markets Infrastructure | | 23.47 | 95 | 0.38 | 2.98 | 9.67% |
| CEW | Emerging Currency Strat | | 18.13 | 100 | 0.28 | 1.46 | 0.7% |
| EBND | Em Mkts Lcl | | 20.46 | 50 | -0.05 | 1.29 | -3.67% |
| EMCB | Emerging Markets Corp | | 64.58 | 64 | -0.17 | 0 | 1.06% |
| VWOB | Emerging Mkts Govt | | 63.65 | 71 | -0.22 | 0.82 | -0.16% |
| EEMA | Emerging Markets Asia | | 73.44 | 95 | 0.25 | 3.54 | 11.09% |
| EELV | Em Mkts Low | | 24.47 | 95 | 0.23 | 1.75 | 1.79% |
| DVYE | Emerging Markets Dividend | | 29.45 | 100 | 0.89 | 3.66 | 11.17% |
| SDEM | SuperDividend Em Mkts | | 27.29 | 100 | 1.30 | 2.98 | 10.05% |
| DBEM | Em Mkts Hdgd | | 25.20 | 95 | 0.34 | 2.48 | 9.23% |
| PCY | Emerging Markets Sov | | 20.45 | 71 | -0.66 | 1.19 | -0.82% |
| QEMM | Emerging Mkts StratcFacts | | 60.71 | 100 | 0.58 | 2.57 | 6.22% |
| 12Stocks.com: Charts, Trends, Fundamental Data and Performances of Emerging Markets Stocks | |
|
We now take in-depth look at all Emerging Markets stocks including charts, multi-period performances and overall trends (as measured by Smart Investing & Trading Score ). One can sort Emerging Markets stocks (click link to choose) by Daily, Weekly and by Year-to-Date performances. Also, one can sort by size of the company or by market capitalization. |
| Select Your Default Chart Type: | |||||
| |||||
| Click on stock symbol or name for detailed view. Click on to add stock symbol to your watchlist and to view watchlist. Quick View: Move mouse or cursor over "Daily" to quickly view daily technical stock chart and over "Weekly" to view weekly technical stock chart. | |||||

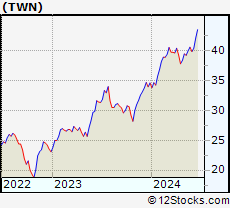 | TWN The Taiwan Fund, Inc. |
| Sector: Financials | |
| SubSector: Closed-End Fund - Foreign | |
| MarketCap: 110.547 Millions | |
| Recent Price: 39.99 Smart Investing & Trading Score : 83 | |
| Day Percent Change: 0.69% Day Change: 0.27 | |
| Week Change: 1.96% Year-to-date Change: 15.6% | |
| TWN Links: Profile News Message Board | |
| Charts:- Daily , Weekly | |
| Add TWN to Watchlist: View: Get Complete TWN Trend Analysis ➞ | |
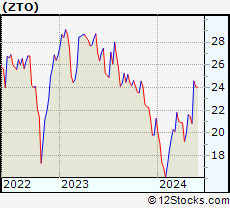 | ZTO ZTO Express (Cayman) Inc. |
| Sector: Transports | |
| SubSector: Air Delivery & Freight Services | |
| MarketCap: 20507 Millions | |
| Recent Price: 24.59 Smart Investing & Trading Score : 100 | |
| Day Percent Change: 4.28% Day Change: 1.01 | |
| Week Change: 17.94% Year-to-date Change: 15.6% | |
| ZTO Links: Profile News Message Board | |
| Charts:- Daily , Weekly | |
| Add ZTO to Watchlist: View: Get Complete ZTO Trend Analysis ➞ | |
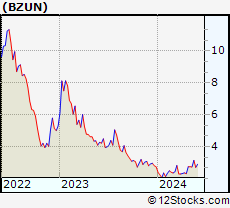 | BZUN Baozun Inc. |
| Sector: Services & Goods | |
| SubSector: Catalog & Mail Order Houses | |
| MarketCap: 1668.92 Millions | |
| Recent Price: 3.15 Smart Investing & Trading Score : 95 | |
| Day Percent Change: 1.94% Day Change: 0.06 | |
| Week Change: 14.96% Year-to-date Change: 15.0% | |
| BZUN Links: Profile News Message Board | |
| Charts:- Daily , Weekly | |
| Add BZUN to Watchlist: View: Get Complete BZUN Trend Analysis ➞ | |
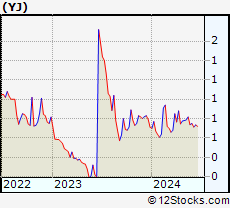 | YJ Yunji Inc. |
| Sector: Services & Goods | |
| SubSector: Specialty Retail, Other | |
| MarketCap: 770.644 Millions | |
| Recent Price: 0.82 Smart Investing & Trading Score : 88 | |
| Day Percent Change: 6.10% Day Change: 0.05 | |
| Week Change: 3.93% Year-to-date Change: 14.9% | |
| YJ Links: Profile News Message Board | |
| Charts:- Daily , Weekly | |
| Add YJ to Watchlist: View: Get Complete YJ Trend Analysis ➞ | |
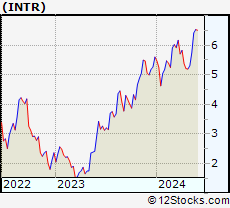 | INTR Inter & Co, Inc. |
| Sector: Financials | |
| SubSector: Banks - Regional | |
| MarketCap: 1250 Millions | |
| Recent Price: 6.42 Smart Investing & Trading Score : 100 | |
| Day Percent Change: 1.90% Day Change: 0.12 | |
| Week Change: 11.65% Year-to-date Change: 14.5% | |
| INTR Links: Profile News Message Board | |
| Charts:- Daily , Weekly | |
| Add INTR to Watchlist: View: Get Complete INTR Trend Analysis ➞ | |
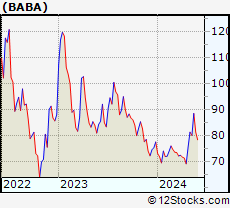 | BABA Alibaba Group Holding Limited |
| Sector: Services & Goods | |
| SubSector: Specialty Retail, Other | |
| MarketCap: 522666 Millions | |
| Recent Price: 88.54 Smart Investing & Trading Score : 100 | |
| Day Percent Change: 2.12% Day Change: 1.84 | |
| Week Change: 10.62% Year-to-date Change: 14.2% | |
| BABA Links: Profile News Message Board | |
| Charts:- Daily , Weekly | |
| Add BABA to Watchlist: View: Get Complete BABA Trend Analysis ➞ | |
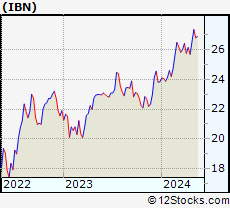 | IBN ICICI Bank Limited |
| Sector: Financials | |
| SubSector: Money Center Banks | |
| MarketCap: 31194.1 Millions | |
| Recent Price: 27.21 Smart Investing & Trading Score : 93 | |
| Day Percent Change: 0.41% Day Change: 0.11 | |
| Week Change: 1.57% Year-to-date Change: 14.1% | |
| IBN Links: Profile News Message Board | |
| Charts:- Daily , Weekly | |
| Add IBN to Watchlist: View: Get Complete IBN Trend Analysis ➞ | |
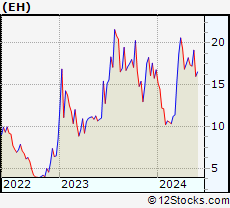 | EH EHang Holdings Limited |
| Sector: Industrials | |
| SubSector: Aerospace/Defense Products & Services | |
| MarketCap: 513.401 Millions | |
| Recent Price: 19.15 Smart Investing & Trading Score : 100 | |
| Day Percent Change: 0.90% Day Change: 0.17 | |
| Week Change: 11.01% Year-to-date Change: 14.0% | |
| EH Links: Profile News Message Board | |
| Charts:- Daily , Weekly | |
| Add EH to Watchlist: View: Get Complete EH Trend Analysis ➞ | |
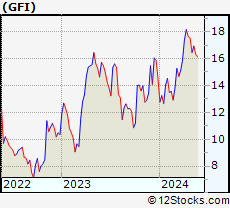 | GFI Gold Fields Limited |
| Sector: Materials | |
| SubSector: Gold | |
| MarketCap: 4908.39 Millions | |
| Recent Price: 16.32 Smart Investing & Trading Score : 46 | |
| Day Percent Change: 3.36% Day Change: 0.53 | |
| Week Change: -3.66% Year-to-date Change: 12.9% | |
| GFI Links: Profile News Message Board | |
| Charts:- Daily , Weekly | |
| Add GFI to Watchlist: View: Get Complete GFI Trend Analysis ➞ | |
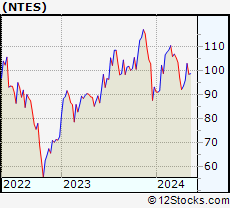 | NTES NetEase, Inc. |
| Sector: Technology | |
| SubSector: Internet Software & Services | |
| MarketCap: 40105.1 Millions | |
| Recent Price: 104.97 Smart Investing & Trading Score : 74 | |
| Day Percent Change: 0.73% Day Change: 0.76 | |
| Week Change: 6.54% Year-to-date Change: 12.7% | |
| NTES Links: Profile News Message Board | |
| Charts:- Daily , Weekly | |
| Add NTES to Watchlist: View: Get Complete NTES Trend Analysis ➞ | |
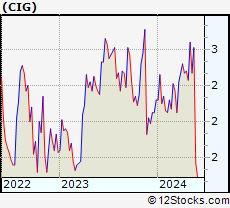 | CIG Companhia Energetica de Minas Gerais |
| Sector: Utilities | |
| SubSector: Electric Utilities | |
| MarketCap: 3203.54 Millions | |
| Recent Price: 2.61 Smart Investing & Trading Score : 100 | |
| Day Percent Change: 1.56% Day Change: 0.04 | |
| Week Change: 5.67% Year-to-date Change: 12.5% | |
| CIG Links: Profile News Message Board | |
| Charts:- Daily , Weekly | |
| Add CIG to Watchlist: View: Get Complete CIG Trend Analysis ➞ | |
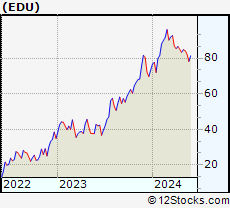 | EDU New Oriental Education & Technology Group Inc. |
| Sector: Services & Goods | |
| SubSector: Education & Training Services | |
| MarketCap: 18673.7 Millions | |
| Recent Price: 82.17 Smart Investing & Trading Score : 7 | |
| Day Percent Change: -1.87% Day Change: -1.57 | |
| Week Change: -2.38% Year-to-date Change: 12.1% | |
| EDU Links: Profile News Message Board | |
| Charts:- Daily , Weekly | |
| Add EDU to Watchlist: View: Get Complete EDU Trend Analysis ➞ | |
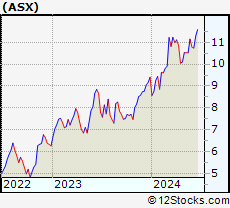 | ASX ASE Technology Holding Co., Ltd. |
| Sector: Technology | |
| SubSector: Semiconductor Equipment & Materials | |
| MarketCap: 8513.18 Millions | |
| Recent Price: 10.52 Smart Investing & Trading Score : 61 | |
| Day Percent Change: 0.19% Day Change: 0.02 | |
| Week Change: 0% Year-to-date Change: 11.8% | |
| ASX Links: Profile News Message Board | |
| Charts:- Daily , Weekly | |
| Add ASX to Watchlist: View: Get Complete ASX Trend Analysis ➞ | |
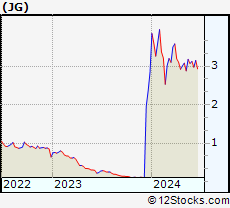 | JG Aurora Mobile Limited |
| Sector: Technology | |
| SubSector: Application Software | |
| MarketCap: 268.762 Millions | |
| Recent Price: 3.18 Smart Investing & Trading Score : 90 | |
| Day Percent Change: -0.63% Day Change: -0.02 | |
| Week Change: 10.49% Year-to-date Change: 11.5% | |
| JG Links: Profile News Message Board | |
| Charts:- Daily , Weekly | |
| Add JG to Watchlist: View: Get Complete JG Trend Analysis ➞ | |
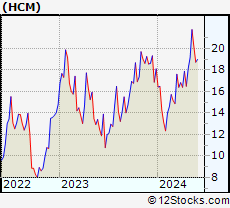 | HCM Hutchison China MediTech Limited |
| Sector: Health Care | |
| SubSector: Drug Manufacturers - Major | |
| MarketCap: 2324.43 Millions | |
| Recent Price: 20.17 Smart Investing & Trading Score : 63 | |
| Day Percent Change: -3.77% Day Change: -0.79 | |
| Week Change: -7.29% Year-to-date Change: 11.4% | |
| HCM Links: Profile News Message Board | |
| Charts:- Daily , Weekly | |
| Add HCM to Watchlist: View: Get Complete HCM Trend Analysis ➞ | |
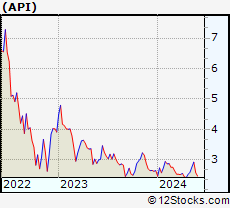 | API Agora, Inc. |
| Sector: Technology | |
| SubSector: Software Application | |
| MarketCap: 42787 Millions | |
| Recent Price: 2.92 Smart Investing & Trading Score : 90 | |
| Day Percent Change: -1.02% Day Change: -0.03 | |
| Week Change: 5.8% Year-to-date Change: 10.6% | |
| API Links: Profile News Message Board | |
| Charts:- Daily , Weekly | |
| Add API to Watchlist: View: Get Complete API Trend Analysis ➞ | |
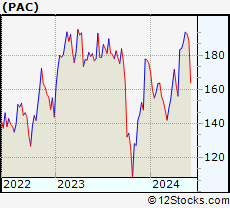 | PAC Grupo Aeroportuario del Pacifico, S.A.B. de C.V. |
| Sector: Transports | |
| SubSector: Air Services, Other | |
| MarketCap: 3204.18 Millions | |
| Recent Price: 193.63 Smart Investing & Trading Score : 95 | |
| Day Percent Change: -0.06% Day Change: -0.12 | |
| Week Change: 3.27% Year-to-date Change: 10.5% | |
| PAC Links: Profile News Message Board | |
| Charts:- Daily , Weekly | |
| Add PAC to Watchlist: View: Get Complete PAC Trend Analysis ➞ | |
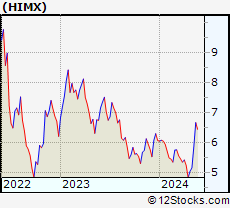 | HIMX Himax Technologies, Inc. |
| Sector: Technology | |
| SubSector: Semiconductor - Specialized | |
| MarketCap: 496.16 Millions | |
| Recent Price: 6.67 Smart Investing & Trading Score : 95 | |
| Day Percent Change: 0.30% Day Change: 0.02 | |
| Week Change: 13.92% Year-to-date Change: 9.9% | |
| HIMX Links: Profile News Message Board | |
| Charts:- Daily , Weekly | |
| Add HIMX to Watchlist: View: Get Complete HIMX Trend Analysis ➞ | |
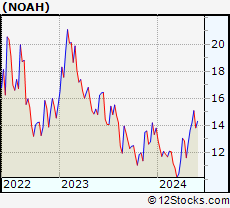 | NOAH Noah Holdings Limited |
| Sector: Financials | |
| SubSector: Asset Management | |
| MarketCap: 1495.33 Millions | |
| Recent Price: 15.10 Smart Investing & Trading Score : 95 | |
| Day Percent Change: 0.53% Day Change: 0.08 | |
| Week Change: 6.26% Year-to-date Change: 9.3% | |
| NOAH Links: Profile News Message Board | |
| Charts:- Daily , Weekly | |
| Add NOAH to Watchlist: View: Get Complete NOAH Trend Analysis ➞ | |
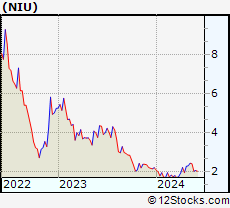 | NIU Niu Technologies |
| Sector: Consumer Staples | |
| SubSector: Auto Manufacturers - Major | |
| MarketCap: 543.271 Millions | |
| Recent Price: 2.39 Smart Investing & Trading Score : 58 | |
| Day Percent Change: -3.24% Day Change: -0.08 | |
| Week Change: -1.24% Year-to-date Change: 9.1% | |
| NIU Links: Profile News Message Board | |
| Charts:- Daily , Weekly | |
| Add NIU to Watchlist: View: Get Complete NIU Trend Analysis ➞ | |
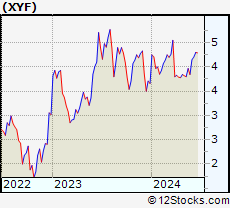 | XYF X Financial |
| Sector: Financials | |
| SubSector: Credit Services | |
| MarketCap: 168.008 Millions | |
| Recent Price: 3.97 Smart Investing & Trading Score : 57 | |
| Day Percent Change: 1.79% Day Change: 0.07 | |
| Week Change: 4.47% Year-to-date Change: 8.5% | |
| XYF Links: Profile News Message Board | |
| Charts:- Daily , Weekly | |
| Add XYF to Watchlist: View: Get Complete XYF Trend Analysis ➞ | |
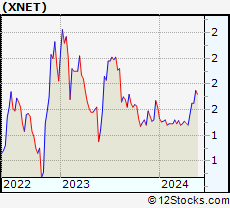 | XNET Xunlei Limited |
| Sector: Technology | |
| SubSector: Application Software | |
| MarketCap: 203.662 Millions | |
| Recent Price: 1.75 Smart Investing & Trading Score : 85 | |
| Day Percent Change: 3.24% Day Change: 0.05 | |
| Week Change: 6.06% Year-to-date Change: 8.0% | |
| XNET Links: Profile News Message Board | |
| Charts:- Daily , Weekly | |
| Add XNET to Watchlist: View: Get Complete XNET Trend Analysis ➞ | |
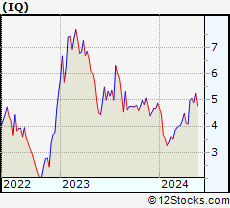 | IQ iQIYI, Inc. |
| Sector: Technology | |
| SubSector: Internet Information Providers | |
| MarketCap: 13591.5 Millions | |
| Recent Price: 5.26 Smart Investing & Trading Score : 83 | |
| Day Percent Change: -9.15% Day Change: -0.53 | |
| Week Change: 7.35% Year-to-date Change: 7.8% | |
| IQ Links: Profile News Message Board | |
| Charts:- Daily , Weekly | |
| Add IQ to Watchlist: View: Get Complete IQ Trend Analysis ➞ | |
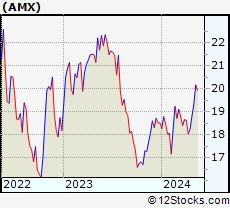 | AMX America Movil, S.A.B. de C.V. |
| Sector: Technology | |
| SubSector: Wireless Communications | |
| MarketCap: 44726.6 Millions | |
| Recent Price: 19.75 Smart Investing & Trading Score : 83 | |
| Day Percent Change: 0.10% Day Change: 0.02 | |
| Week Change: -2.08% Year-to-date Change: 6.6% | |
| AMX Links: Profile News Message Board | |
| Charts:- Daily , Weekly | |
| Add AMX to Watchlist: View: Get Complete AMX Trend Analysis ➞ | |
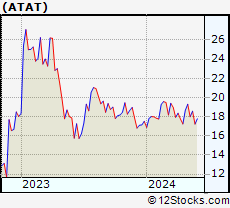 | ATAT Atour Lifestyle Holdings Limited |
| Sector: Services & Goods | |
| SubSector: Lodging | |
| MarketCap: 2120 Millions | |
| Recent Price: 18.58 Smart Investing & Trading Score : 60 | |
| Day Percent Change: 0.27% Day Change: 0.05 | |
| Week Change: 3.28% Year-to-date Change: 6.1% | |
| ATAT Links: Profile News Message Board | |
| Charts:- Daily , Weekly | |
| Add ATAT to Watchlist: View: Get Complete ATAT Trend Analysis ➞ | |
| For tabular summary view of above stock list: Summary View ➞ 0 - 25 , 25 - 50 , 50 - 75 , 75 - 100 , 100 - 125 , 125 - 150 , 150 - 175 , 175 - 200 | ||
| Click To Change The Sort Order: By Market Cap or Company Size Performance: Year-to-date, Week and Day | |
| Select Chart Type: | ||
|
Best Stocks Today 12Stocks.com |
© 2024 12Stocks.com Terms & Conditions Privacy Contact Us
All Information Provided Only For Education And Not To Be Used For Investing or Trading. See Terms & Conditions


One More Thing ... Get Best Stocks Delivered Daily!
Never Ever Miss A Move With Our Top Ten Stocks Lists
Find Best Stocks In Any Market - Bull or Bear Market
Take A Peek At Our Top Ten Stocks Lists: Daily, Weekly, Year-to-Date & Top Trends
Find Best Stocks In Any Market - Bull or Bear Market
Take A Peek At Our Top Ten Stocks Lists: Daily, Weekly, Year-to-Date & Top Trends
Emerging Markets Stocks With Best Up Trends [0-bearish to 100-bullish]: Fangdd Network[100], 36Kr [100], Cheetah Mobile[100], Boqii Holding[100], DRDGOLD [100], ZTO Express[100], Full Truck[100], Sibanye Stillwater[100], Embraer S.A[100], GDS [100], JD.com [100]
Best Emerging Markets Stocks Year-to-Date:
U Power[3454.69%], DouYu [1040%], Burning Rock[760.19%], China Liberal[576.73%], Yatsen Holding[515.09%], MicroCloud Hologram[495.68%], Uxin [355.06%], Zhihu [349.45%], Zhongchao [313.59%], Fangdd Network[149.63%], Smart Share[121.36%] Best Emerging Markets Stocks This Week:
Burning Rock[946.66%], Fangdd Network[360.27%], HUYA [36.36%], Viomi [27.4%], Uxin [27.09%], MOGU [24.34%], Huize Holding[21.83%], MicroCloud Hologram[21.76%], U Power[20.64%], Bilibili [19.47%], Embraer S.A[19.33%] Best Emerging Markets Stocks Daily:
Fangdd Network[321.26%], Golden Heaven[16.00%], 17 Education[12.89%], China Liberal[11.01%], 36Kr [10.41%], Cheetah Mobile[10.34%], Zhihu [8.42%], MicroCloud Hologram[8.38%], Hywin [8.28%], iHuman [7.89%], AMTD Digital[7.37%]