
 Login Sign Up


| |||||
 |  | ||||

| 12Stocks.com Market Intelligence |
Best Emerging Markets Stocks
| In a hurry? Emerging Markets Stocks Lists: Trends Table, Stock Charts
Sort Emerging Markets stocks: Daily, Weekly, Year-to-Date, Market Cap & Trends. Filter Emerging Markets stocks list by sector: Show all, Tech, Finance, Energy, Staples, Retail, Industrial, Materials, Utilities and HealthCare Filter Emerging Markets stocks list by size:All Large Medium Small |
| 12Stocks.com Emerging Markets Stocks Performances & Trends Daily | |||||||||
|
|  The overall Smart Investing & Trading Score is 95 (0-bearish to 100-bullish) which puts Emerging Markets index in short term bullish trend. The Smart Investing & Trading Score from previous trading session is 100 and a deterioration of trend continues.
| ||||||||
Here are the Smart Investing & Trading Scores of the most requested Emerging Markets stocks at 12Stocks.com (click stock name for detailed review):
|


| 12Stocks.com: Top Performing Emerging Markets Index Stocks | ||||||||||||||||||||||||||||||||||||||||||||||||
 The top performing Emerging Markets Index stocks year to date are
Now, more recently, over last week, the top performing Emerging Markets Index stocks on the move are


|
||||||||||||||||||||||||||||||||||||||||||||||||
| 12Stocks.com: Investing in Emerging Markets Index with Stocks | |
|
The following table helps investors and traders sort through current performance and trends (as measured by Smart Investing & Trading Score ) of various
stocks in the Emerging Markets Index. Quick View: Move mouse or cursor over stock symbol (ticker) to view short-term technical chart and over stock name to view long term chart. Click on  to add stock symbol to your watchlist and to add stock symbol to your watchlist and  to view watchlist. Click on any ticker or stock name for detailed market intelligence report for that stock. to view watchlist. Click on any ticker or stock name for detailed market intelligence report for that stock. |
12Stocks.com Performance of Stocks in Emerging Markets Index
| Ticker | Stock Name | Watchlist | Category | Recent Price | Smart Investing & Trading Score | Change % | Weekly Change% |
| DQ | Daqo New |   | Technology | 18.71 | 27 | -1.21% | 4.35% |
| CLEU | China Liberal | | Consumer Staples | 1.21 | 57 | 11.01% | 4.31% |
| LX | LexinFintech | | Financials | 1.94 | 90 | -1.02% | 4.31% |
| ABEV | Ambev S.A | | Consumer Staples | 2.42 | 67 | 1.26% | 4.31% |
| CANG | Cango | | Technology | 1.64 | 71 | 0.00% | 4.26% |
| NIO | NIO | | Consumer Staples | 5.28 | 42 | 0.38% | 4.24% |
| RC | Ready Capital | | Financials | 8.71 | 39 | 0.58% | 4.06% |
| YJ | Yunji | | Services & Goods | 0.82 | 88 | 6.10% | 3.93% |
| HSAI | Hesai | | Services & Goods | 5.15 | 68 | 0.10% | 3.83% |
| VIV | Telefonica Brasil | | Technology | 9.08 | 42 | 0.11% | 3.77% |
| LU | Lufax Holding | | Financials | 4.72 | 83 | 3.74% | 3.74% |
| IMOS | ChipMOS | | Technology | 26.70 | 32 | 0.26% | 3.73% |
| ASAI | Sendas Distribuidora | | Consumer Staples | 13.39 | 67 | 1.75% | 3.64% |
| YUMC | Yum China | | Services & Goods | 39.20 | 40 | 0.15% | 3.59% |
| RLX | RLX | | Consumer Staples | 2.04 | 63 | -5.12% | 3.55% |
| HTHT | Huazhu | | Services & Goods | 41.33 | 71 | -1.69% | 3.45% |
| SID | Companhia Siderurgica | | Materials | 2.77 | 42 | 1.47% | 3.36% |
| QFIN | 360 Finance | | Financials | 21.30 | 90 | -0.79% | 3.35% |
| ATAT | Atour Lifestyle | | Services & Goods | 18.58 | 60 | 0.27% | 3.28% |
| SIFY | Sify | | Technology | 1.26 | 74 | 3.28% | 3.28% |
| PAC | Grupo Aeroportuario | | Transports | 193.63 | 95 | -0.06% | 3.27% |
| WIMI | WiMi Hologram | | Technology | 0.96 | 22 | 0.22% | 3.24% |
| UGP | Ultrapar Participacoes | | Energy | 4.85 | 35 | -1.22% | 3.19% |
| JKS | JinkoSolar Holding | | Technology | 24.47 | 42 | -1.29% | 3.12% |
| SFWL | Shengfeng Development | | Industrials | 1.99 | 76 | 0.51% | 3.11% |
| For chart view version of above stock list: Chart View ➞ 0 - 25 , 25 - 50 , 50 - 75 , 75 - 100 , 100 - 125 , 125 - 150 , 150 - 175 , 175 - 200 | ||
 | Click To Change The Sort Order: By Market Cap or Company Size Performance: Year-to-date, Week and Day |  |
|
Get the most comprehensive stock market coverage daily at 12Stocks.com ➞ Best Stocks Today ➞ Best Stocks Weekly ➞ Best Stocks Year-to-Date ➞ Best Stocks Trends ➞  Best Stocks Today 12Stocks.com Best Nasdaq Stocks ➞ Best S&P 500 Stocks ➞ Best Tech Stocks ➞ Best Biotech Stocks ➞ |
| Detailed Overview of Emerging Markets Stocks |
| Emerging Markets Technical Overview, Leaders & Laggards, Top Emerging Markets ETF Funds & Detailed Emerging Markets Stocks List, Charts, Trends & More |
| Emerging Markets: Technical Analysis, Trends & YTD Performance | |
 EEM Weekly Chart |
|
| Long Term Trend: Very Good | |
| Medium Term Trend: Very Good | |
 EEM Daily Chart |
|
| Short Term Trend: Very Good | |
| Overall Trend Score: 95 | |
| YTD Performance: 8.9% | |
| **Trend Scores & Views Are Only For Educational Purposes And Not For Investing | |
| 12Stocks.com: Investing in Emerging Markets Index using Exchange Traded Funds | |
|
The following table shows list of key exchange traded funds (ETF) that
help investors play Emerging Markets stock market. For detailed view, check out our ETF Funds section of our website. Quick View: Move mouse or cursor over ETF symbol (ticker) to view short-term technical chart and over ETF name to view long term chart. Click on ticker or stock name for detailed view. Click on to add stock symbol to your watchlist and to view watchlist. |
12Stocks.com List of ETFs that track Emerging Markets Index
| Ticker | ETF Name | Watchlist | Recent Price | Smart Investing & Trading Score | Change % | Week % | Year-to-date % |
| EEM | Emerging Markets | | 43.79 | 95 | 0.44 | 3.04 | 8.9% |
| VWO | Emerging Markets | | 44.89 | 100 | 0.72 | 3.29 | 9.22% |
| SCHE | Emerging Markets Equity | | 27.20 | 100 | 0.63 | 3.34 | 9.72% |
| EWX | Emerging Markets Small | | 59.01 | 100 | 1.03 | 2.93 | 4.52% |
| EET | Emerging Markets | | 57.71 | 95 | 0.84 | 6.11 | 13.47% |
| EDC | Emrg Mkts Bull | | 35.76 | 95 | 1.19 | 8.96 | 17.52% |
| EEV | Short Emerging | | 16.89 | 0 | -2.09 | -6.05 | -14.37% |
| EUM | Short Emerging | | 13.19 | 10 | -0.49 | -2.84 | -6.78% |
| EDIV | Emerging Markets Dividend | | 36.11 | 100 | 0.92 | 2.73 | 11.04% |
| EMIF | Emerging Markets Infrastructure | | 23.47 | 95 | 0.38 | 2.98 | 9.67% |
| CEW | Emerging Currency Strat | | 18.13 | 100 | 0.28 | 1.46 | 0.7% |
| EBND | Em Mkts Lcl | | 20.46 | 50 | -0.05 | 1.29 | -3.67% |
| EMCB | Emerging Markets Corp | | 64.58 | 64 | -0.17 | 0 | 1.06% |
| VWOB | Emerging Mkts Govt | | 63.65 | 71 | -0.22 | 0.82 | -0.16% |
| EEMA | Emerging Markets Asia | | 73.44 | 95 | 0.25 | 3.54 | 11.09% |
| EELV | Em Mkts Low | | 24.47 | 95 | 0.23 | 1.75 | 1.79% |
| DVYE | Emerging Markets Dividend | | 29.45 | 100 | 0.89 | 3.66 | 11.17% |
| SDEM | SuperDividend Em Mkts | | 27.29 | 100 | 1.30 | 2.98 | 10.05% |
| DBEM | Em Mkts Hdgd | | 25.20 | 95 | 0.34 | 2.48 | 9.23% |
| PCY | Emerging Markets Sov | | 20.45 | 71 | -0.66 | 1.19 | -0.82% |
| QEMM | Emerging Mkts StratcFacts | | 60.71 | 100 | 0.58 | 2.57 | 6.22% |
| 12Stocks.com: Charts, Trends, Fundamental Data and Performances of Emerging Markets Stocks | |
|
We now take in-depth look at all Emerging Markets stocks including charts, multi-period performances and overall trends (as measured by Smart Investing & Trading Score ). One can sort Emerging Markets stocks (click link to choose) by Daily, Weekly and by Year-to-Date performances. Also, one can sort by size of the company or by market capitalization. |
| Select Your Default Chart Type: | |||||
| |||||
| Click on stock symbol or name for detailed view. Click on to add stock symbol to your watchlist and to view watchlist. Quick View: Move mouse or cursor over "Daily" to quickly view daily technical stock chart and over "Weekly" to view weekly technical stock chart. | |||||

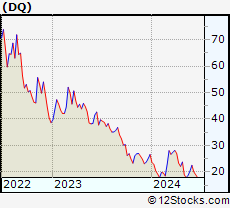 | DQ Daqo New Energy Corp. |
| Sector: Technology | |
| SubSector: Semiconductor Equipment & Materials | |
| MarketCap: 660.918 Millions | |
| Recent Price: 18.71 Smart Investing & Trading Score : 27 | |
| Day Percent Change: -1.21% Day Change: -0.23 | |
| Week Change: 4.35% Year-to-date Change: -29.7% | |
| DQ Links: Profile News Message Board | |
| Charts:- Daily , Weekly | |
| Add DQ to Watchlist: View: Get Complete DQ Trend Analysis ➞ | |
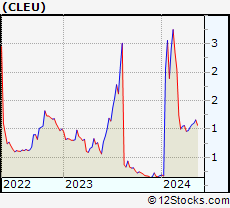 | CLEU China Liberal Education Holdings Limited |
| Sector: Consumer Staples | |
| SubSector: Education & Training Services | |
| MarketCap: 32347 Millions | |
| Recent Price: 1.21 Smart Investing & Trading Score : 57 | |
| Day Percent Change: 11.01% Day Change: 0.12 | |
| Week Change: 4.31% Year-to-date Change: 576.7% | |
| CLEU Links: Profile News Message Board | |
| Charts:- Daily , Weekly | |
| Add CLEU to Watchlist: View: Get Complete CLEU Trend Analysis ➞ | |
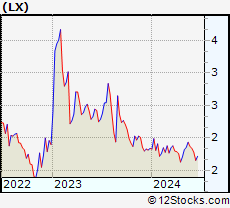 | LX LexinFintech Holdings Ltd. |
| Sector: Financials | |
| SubSector: Credit Services | |
| MarketCap: 1674.18 Millions | |
| Recent Price: 1.94 Smart Investing & Trading Score : 90 | |
| Day Percent Change: -1.02% Day Change: -0.02 | |
| Week Change: 4.31% Year-to-date Change: 5.2% | |
| LX Links: Profile News Message Board | |
| Charts:- Daily , Weekly | |
| Add LX to Watchlist: View: Get Complete LX Trend Analysis ➞ | |
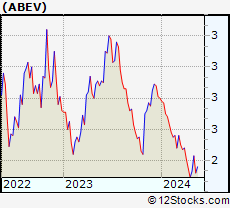 | ABEV Ambev S.A. |
| Sector: Consumer Staples | |
| SubSector: Beverages - Brewers | |
| MarketCap: 37753.5 Millions | |
| Recent Price: 2.42 Smart Investing & Trading Score : 67 | |
| Day Percent Change: 1.26% Day Change: 0.03 | |
| Week Change: 4.31% Year-to-date Change: -13.6% | |
| ABEV Links: Profile News Message Board | |
| Charts:- Daily , Weekly | |
| Add ABEV to Watchlist: View: Get Complete ABEV Trend Analysis ➞ | |
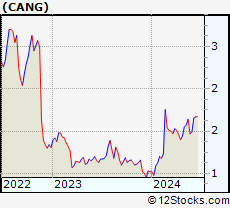 | CANG Cango Inc. |
| Sector: Technology | |
| SubSector: Internet Information Providers | |
| MarketCap: 947.48 Millions | |
| Recent Price: 1.64 Smart Investing & Trading Score : 71 | |
| Day Percent Change: 0.00% Day Change: 0.00 | |
| Week Change: 4.26% Year-to-date Change: 60.8% | |
| CANG Links: Profile News Message Board | |
| Charts:- Daily , Weekly | |
| Add CANG to Watchlist: View: Get Complete CANG Trend Analysis ➞ | |
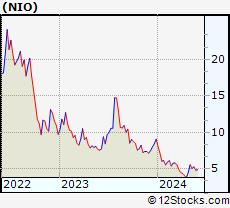 | NIO NIO Limited |
| Sector: Consumer Staples | |
| SubSector: Auto Manufacturers - Major | |
| MarketCap: 2679.71 Millions | |
| Recent Price: 5.28 Smart Investing & Trading Score : 42 | |
| Day Percent Change: 0.38% Day Change: 0.02 | |
| Week Change: 4.24% Year-to-date Change: -41.8% | |
| NIO Links: Profile News Message Board | |
| Charts:- Daily , Weekly | |
| Add NIO to Watchlist: View: Get Complete NIO Trend Analysis ➞ | |
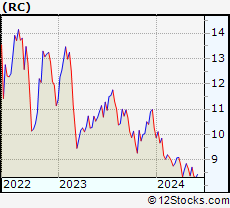 | RC Ready Capital Corporation |
| Sector: Financials | |
| SubSector: Mortgage Investment | |
| MarketCap: 358.039 Millions | |
| Recent Price: 8.71 Smart Investing & Trading Score : 39 | |
| Day Percent Change: 0.58% Day Change: 0.05 | |
| Week Change: 4.06% Year-to-date Change: -15.0% | |
| RC Links: Profile News Message Board | |
| Charts:- Daily , Weekly | |
| Add RC to Watchlist: View: Get Complete RC Trend Analysis ➞ | |
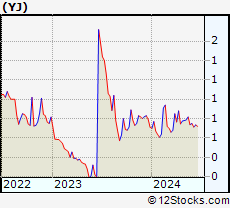 | YJ Yunji Inc. |
| Sector: Services & Goods | |
| SubSector: Specialty Retail, Other | |
| MarketCap: 770.644 Millions | |
| Recent Price: 0.82 Smart Investing & Trading Score : 88 | |
| Day Percent Change: 6.10% Day Change: 0.05 | |
| Week Change: 3.93% Year-to-date Change: 14.9% | |
| YJ Links: Profile News Message Board | |
| Charts:- Daily , Weekly | |
| Add YJ to Watchlist: View: Get Complete YJ Trend Analysis ➞ | |
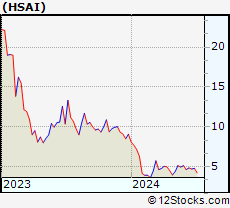 | HSAI Hesai Group |
| Sector: Services & Goods | |
| SubSector: Auto Parts | |
| MarketCap: 1330 Millions | |
| Recent Price: 5.15 Smart Investing & Trading Score : 68 | |
| Day Percent Change: 0.10% Day Change: 0.01 | |
| Week Change: 3.83% Year-to-date Change: -43.3% | |
| HSAI Links: Profile News Message Board | |
| Charts:- Daily , Weekly | |
| Add HSAI to Watchlist: View: Get Complete HSAI Trend Analysis ➞ | |
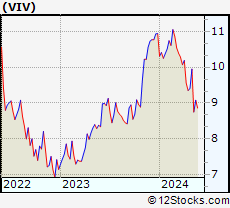 | VIV Telefonica Brasil S.A. |
| Sector: Technology | |
| SubSector: Wireless Communications | |
| MarketCap: 19611.1 Millions | |
| Recent Price: 9.08 Smart Investing & Trading Score : 42 | |
| Day Percent Change: 0.11% Day Change: 0.01 | |
| Week Change: 3.77% Year-to-date Change: -17.0% | |
| VIV Links: Profile News Message Board | |
| Charts:- Daily , Weekly | |
| Add VIV to Watchlist: View: Get Complete VIV Trend Analysis ➞ | |
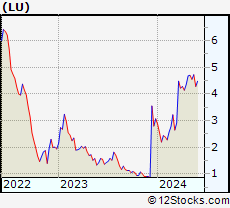 | LU Lufax Holding Ltd |
| Sector: Financials | |
| SubSector: Credit Services | |
| MarketCap: 33457 Millions | |
| Recent Price: 4.72 Smart Investing & Trading Score : 83 | |
| Day Percent Change: 3.74% Day Change: 0.17 | |
| Week Change: 3.74% Year-to-date Change: 53.8% | |
| LU Links: Profile News Message Board | |
| Charts:- Daily , Weekly | |
| Add LU to Watchlist: View: Get Complete LU Trend Analysis ➞ | |
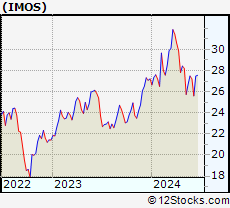 | IMOS ChipMOS TECHNOLOGIES INC. |
| Sector: Technology | |
| SubSector: Semiconductor Equipment & Materials | |
| MarketCap: 658.918 Millions | |
| Recent Price: 26.70 Smart Investing & Trading Score : 32 | |
| Day Percent Change: 0.26% Day Change: 0.07 | |
| Week Change: 3.73% Year-to-date Change: -1.9% | |
| IMOS Links: Profile News Message Board | |
| Charts:- Daily , Weekly | |
| Add IMOS to Watchlist: View: Get Complete IMOS Trend Analysis ➞ | |
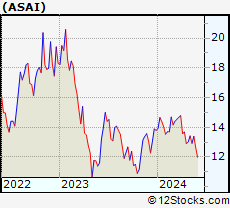 | ASAI Sendas Distribuidora S.A. |
| Sector: Consumer Staples | |
| SubSector: Grocery Stores | |
| MarketCap: 3790 Millions | |
| Recent Price: 13.39 Smart Investing & Trading Score : 67 | |
| Day Percent Change: 1.75% Day Change: 0.23 | |
| Week Change: 3.64% Year-to-date Change: -2.9% | |
| ASAI Links: Profile News Message Board | |
| Charts:- Daily , Weekly | |
| Add ASAI to Watchlist: View: Get Complete ASAI Trend Analysis ➞ | |
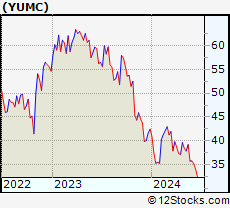 | YUMC Yum China Holdings, Inc. |
| Sector: Services & Goods | |
| SubSector: Restaurants | |
| MarketCap: 16284.5 Millions | |
| Recent Price: 39.20 Smart Investing & Trading Score : 40 | |
| Day Percent Change: 0.15% Day Change: 0.06 | |
| Week Change: 3.59% Year-to-date Change: -7.6% | |
| YUMC Links: Profile News Message Board | |
| Charts:- Daily , Weekly | |
| Add YUMC to Watchlist: View: Get Complete YUMC Trend Analysis ➞ | |
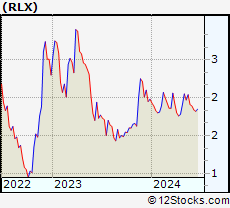 | RLX RLX Technology Inc. |
| Sector: Consumer Staples | |
| SubSector: Tobacco | |
| MarketCap: 2800 Millions | |
| Recent Price: 2.04 Smart Investing & Trading Score : 63 | |
| Day Percent Change: -5.12% Day Change: -0.11 | |
| Week Change: 3.55% Year-to-date Change: 3.0% | |
| RLX Links: Profile News Message Board | |
| Charts:- Daily , Weekly | |
| Add RLX to Watchlist: View: Get Complete RLX Trend Analysis ➞ | |
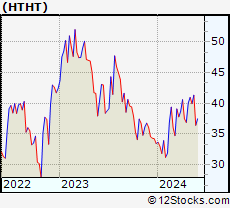 | HTHT Huazhu Group Limited |
| Sector: Services & Goods | |
| SubSector: Lodging | |
| MarketCap: 9164.46 Millions | |
| Recent Price: 41.33 Smart Investing & Trading Score : 71 | |
| Day Percent Change: -1.69% Day Change: -0.71 | |
| Week Change: 3.45% Year-to-date Change: 23.6% | |
| HTHT Links: Profile News Message Board | |
| Charts:- Daily , Weekly | |
| Add HTHT to Watchlist: View: Get Complete HTHT Trend Analysis ➞ | |
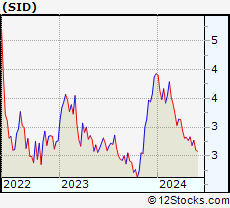 | SID Companhia Siderurgica Nacional |
| Sector: Materials | |
| SubSector: Steel & Iron | |
| MarketCap: 2087.58 Millions | |
| Recent Price: 2.77 Smart Investing & Trading Score : 42 | |
| Day Percent Change: 1.47% Day Change: 0.04 | |
| Week Change: 3.36% Year-to-date Change: -29.5% | |
| SID Links: Profile News Message Board | |
| Charts:- Daily , Weekly | |
| Add SID to Watchlist: View: Get Complete SID Trend Analysis ➞ | |
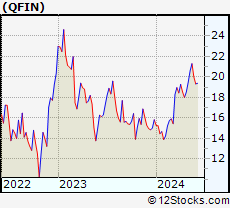 | QFIN 360 Finance, Inc. |
| Sector: Financials | |
| SubSector: Credit Services | |
| MarketCap: 956.208 Millions | |
| Recent Price: 21.30 Smart Investing & Trading Score : 90 | |
| Day Percent Change: -0.79% Day Change: -0.17 | |
| Week Change: 3.35% Year-to-date Change: 34.6% | |
| QFIN Links: Profile News Message Board | |
| Charts:- Daily , Weekly | |
| Add QFIN to Watchlist: View: Get Complete QFIN Trend Analysis ➞ | |
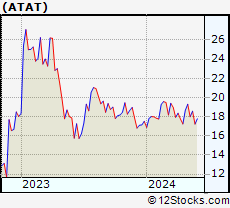 | ATAT Atour Lifestyle Holdings Limited |
| Sector: Services & Goods | |
| SubSector: Lodging | |
| MarketCap: 2120 Millions | |
| Recent Price: 18.58 Smart Investing & Trading Score : 60 | |
| Day Percent Change: 0.27% Day Change: 0.05 | |
| Week Change: 3.28% Year-to-date Change: 6.1% | |
| ATAT Links: Profile News Message Board | |
| Charts:- Daily , Weekly | |
| Add ATAT to Watchlist: View: Get Complete ATAT Trend Analysis ➞ | |
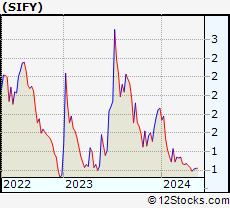 | SIFY Sify Technologies Limited |
| Sector: Technology | |
| SubSector: Internet Service Providers | |
| MarketCap: 159.38 Millions | |
| Recent Price: 1.26 Smart Investing & Trading Score : 74 | |
| Day Percent Change: 3.28% Day Change: 0.04 | |
| Week Change: 3.28% Year-to-date Change: -32.4% | |
| SIFY Links: Profile News Message Board | |
| Charts:- Daily , Weekly | |
| Add SIFY to Watchlist: View: Get Complete SIFY Trend Analysis ➞ | |
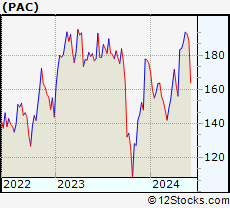 | PAC Grupo Aeroportuario del Pacifico, S.A.B. de C.V. |
| Sector: Transports | |
| SubSector: Air Services, Other | |
| MarketCap: 3204.18 Millions | |
| Recent Price: 193.63 Smart Investing & Trading Score : 95 | |
| Day Percent Change: -0.06% Day Change: -0.12 | |
| Week Change: 3.27% Year-to-date Change: 10.5% | |
| PAC Links: Profile News Message Board | |
| Charts:- Daily , Weekly | |
| Add PAC to Watchlist: View: Get Complete PAC Trend Analysis ➞ | |
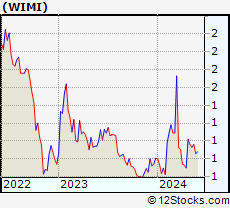 | WIMI WiMi Hologram Cloud Inc. |
| Sector: Technology | |
| SubSector: Advertising Agencies | |
| MarketCap: 41837 Millions | |
| Recent Price: 0.96 Smart Investing & Trading Score : 22 | |
| Day Percent Change: 0.22% Day Change: 0.00 | |
| Week Change: 3.24% Year-to-date Change: 19.3% | |
| WIMI Links: Profile News Message Board | |
| Charts:- Daily , Weekly | |
| Add WIMI to Watchlist: View: Get Complete WIMI Trend Analysis ➞ | |
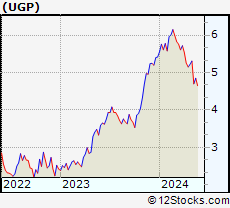 | UGP Ultrapar Participacoes S.A. |
| Sector: Energy | |
| SubSector: Oil & Gas Refining & Marketing | |
| MarketCap: 3473.54 Millions | |
| Recent Price: 4.85 Smart Investing & Trading Score : 35 | |
| Day Percent Change: -1.22% Day Change: -0.06 | |
| Week Change: 3.19% Year-to-date Change: -10.5% | |
| UGP Links: Profile News Message Board | |
| Charts:- Daily , Weekly | |
| Add UGP to Watchlist: View: Get Complete UGP Trend Analysis ➞ | |
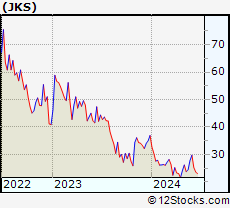 | JKS JinkoSolar Holding Co., Ltd. |
| Sector: Technology | |
| SubSector: Semiconductor - Specialized | |
| MarketCap: 629.36 Millions | |
| Recent Price: 24.47 Smart Investing & Trading Score : 42 | |
| Day Percent Change: -1.29% Day Change: -0.32 | |
| Week Change: 3.12% Year-to-date Change: -33.8% | |
| JKS Links: Profile News Message Board | |
| Charts:- Daily , Weekly | |
| Add JKS to Watchlist: View: Get Complete JKS Trend Analysis ➞ | |
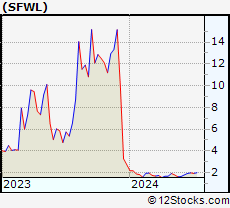 | SFWL Shengfeng Development Limited |
| Sector: Industrials | |
| SubSector: Integrated Freight & Logistics | |
| MarketCap: 747 Millions | |
| Recent Price: 1.99 Smart Investing & Trading Score : 76 | |
| Day Percent Change: 0.51% Day Change: 0.01 | |
| Week Change: 3.11% Year-to-date Change: -27.6% | |
| SFWL Links: Profile News Message Board | |
| Charts:- Daily , Weekly | |
| Add SFWL to Watchlist: View: Get Complete SFWL Trend Analysis ➞ | |
| For tabular summary view of above stock list: Summary View ➞ 0 - 25 , 25 - 50 , 50 - 75 , 75 - 100 , 100 - 125 , 125 - 150 , 150 - 175 , 175 - 200 | ||
| Click To Change The Sort Order: By Market Cap or Company Size Performance: Year-to-date, Week and Day | |
| Select Chart Type: | ||
|
Best Stocks Today 12Stocks.com |
© 2024 12Stocks.com Terms & Conditions Privacy Contact Us
All Information Provided Only For Education And Not To Be Used For Investing or Trading. See Terms & Conditions


One More Thing ... Get Best Stocks Delivered Daily!
Never Ever Miss A Move With Our Top Ten Stocks Lists
Find Best Stocks In Any Market - Bull or Bear Market
Take A Peek At Our Top Ten Stocks Lists: Daily, Weekly, Year-to-Date & Top Trends
Find Best Stocks In Any Market - Bull or Bear Market
Take A Peek At Our Top Ten Stocks Lists: Daily, Weekly, Year-to-Date & Top Trends
Emerging Markets Stocks With Best Up Trends [0-bearish to 100-bullish]: Fangdd Network[100], 36Kr [100], Cheetah Mobile[100], Boqii Holding[100], DRDGOLD [100], ZTO Express[100], Full Truck[100], Sibanye Stillwater[100], Embraer S.A[100], GDS [100], JD.com [100]
Best Emerging Markets Stocks Year-to-Date:
U Power[3454.69%], DouYu [1040%], Burning Rock[760.19%], China Liberal[576.73%], Yatsen Holding[515.09%], MicroCloud Hologram[495.68%], Uxin [355.06%], Zhihu [349.45%], Zhongchao [313.59%], Fangdd Network[149.63%], Smart Share[121.36%] Best Emerging Markets Stocks This Week:
Burning Rock[946.66%], Fangdd Network[360.27%], HUYA [36.36%], Viomi [27.4%], Uxin [27.09%], MOGU [24.34%], Huize Holding[21.83%], MicroCloud Hologram[21.76%], U Power[20.64%], Bilibili [19.47%], Embraer S.A[19.33%] Best Emerging Markets Stocks Daily:
Fangdd Network[321.26%], Golden Heaven[16.00%], 17 Education[12.89%], China Liberal[11.01%], 36Kr [10.41%], Cheetah Mobile[10.34%], Zhihu [8.42%], MicroCloud Hologram[8.38%], Hywin [8.28%], iHuman [7.89%], AMTD Digital[7.37%]