
 Login Sign Up


| |||||
 |  | ||||

| 12Stocks.com Market Intelligence |
Best Emerging Markets Stocks
| In a hurry? Emerging Markets Stocks Lists: Trends Table, Stock Charts
Sort Emerging Markets stocks: Daily, Weekly, Year-to-Date, Market Cap & Trends. Filter Emerging Markets stocks list by sector: Show all, Tech, Finance, Energy, Staples, Retail, Industrial, Materials, Utilities and HealthCare Filter Emerging Markets stocks list by size:All Large Medium Small |
| 12Stocks.com Emerging Markets Stocks Performances & Trends Daily | |||||||||
|
|  The overall Smart Investing & Trading Score is 95 (0-bearish to 100-bullish) which puts Emerging Markets index in short term bullish trend. The Smart Investing & Trading Score from previous trading session is 100 and a deterioration of trend continues.
| ||||||||
Here are the Smart Investing & Trading Scores of the most requested Emerging Markets stocks at 12Stocks.com (click stock name for detailed review):
|


| 12Stocks.com: Top Performing Emerging Markets Index Stocks | ||||||||||||||||||||||||||||||||||||||||||||||||
 The top performing Emerging Markets Index stocks year to date are
Now, more recently, over last week, the top performing Emerging Markets Index stocks on the move are


|
||||||||||||||||||||||||||||||||||||||||||||||||
| 12Stocks.com: Investing in Emerging Markets Index with Stocks | |
|
The following table helps investors and traders sort through current performance and trends (as measured by Smart Investing & Trading Score ) of various
stocks in the Emerging Markets Index. Quick View: Move mouse or cursor over stock symbol (ticker) to view short-term technical chart and over stock name to view long term chart. Click on  to add stock symbol to your watchlist and to add stock symbol to your watchlist and  to view watchlist. Click on any ticker or stock name for detailed market intelligence report for that stock. to view watchlist. Click on any ticker or stock name for detailed market intelligence report for that stock. |
12Stocks.com Performance of Stocks in Emerging Markets Index
| Ticker | Stock Name | Watchlist | Category | Recent Price | Smart Investing & Trading Score | Change % | YTD Change% |
| JFIN | Jiayin |   | Technology | 6.84 | 75 | 2.09% | 32.05% |
| SIFY | Sify | | Technology | 1.26 | 74 | 3.28% | -32.44% |
| VALE | Vale S.A | | Materials | 12.99 | 74 | 2.61% | -18.10% |
| SSL | Sasol | | Energy | 7.51 | 74 | 1.62% | -24.45% |
| WDH | Waterdrop | | Financials | 1.26 | 74 | 0.80% | 20.34% |
| NTES | NetEase | | Technology | 104.97 | 74 | 0.73% | 12.68% |
| UCL | uCloudlink | | Technology | 1.56 | 73 | 6.54% | -15.92% |
| VINP | Vi Partners | | Financials | 11.00 | 73 | 1.85% | 0.09% |
| CANG | Cango | | Technology | 1.64 | 71 | 0.00% | 60.78% |
| HTHT | Huazhu | | Services & Goods | 41.33 | 71 | -1.69% | 23.59% |
| YY | JOYY | | Technology | 33.96 | 71 | -0.44% | -14.46% |
| ASR | Grupo Aeroportuario | | Transports | 353.33 | 70 | -0.29% | 20.07% |
| VIPS | Vipshop | | Services & Goods | 17.32 | 69 | 0.93% | -2.48% |
| HDB | HDFC Bank | | Financials | 56.78 | 68 | 1.32% | -15.39% |
| EDTK | Skillful Craftsman | | Consumer Staples | 0.92 | 68 | 0.11% | -26.98% |
| HSAI | Hesai | | Services & Goods | 5.15 | 68 | 0.10% | -43.28% |
| UXIN | Uxin | | Technology | 3.19 | 68 | -9.63% | 355.06% |
| MSC | Studio City | | Services & Goods | 7.82 | 68 | -2.25% | 20.68% |
| LND | BrasilAgro - | | Financials | 4.94 | 68 | -0.20% | -6.44% |
| OCFT | OneConnect Financial | | Technology | 2.33 | 67 | 7.20% | -26.15% |
| GHG | GreenTree Hospitality | | Services & Goods | 3.24 | 67 | 4.52% | -13.83% |
| ASAI | Sendas Distribuidora | | Consumer Staples | 13.39 | 67 | 1.75% | -2.94% |
| ABEV | Ambev S.A | | Consumer Staples | 2.42 | 67 | 1.26% | -13.57% |
| AIH | Aesthetic Medical | | Health Care | 0.50 | 67 | 0.24% | -27.64% |
| SOHU | Sohu.com | | Technology | 11.93 | 65 | -1.40% | 20.14% |
| For chart view version of above stock list: Chart View ➞ 0 - 25 , 25 - 50 , 50 - 75 , 75 - 100 , 100 - 125 , 125 - 150 , 150 - 175 , 175 - 200 | ||
 | Click To Change The Sort Order: By Market Cap or Company Size Performance: Year-to-date, Week and Day |  |
|
Get the most comprehensive stock market coverage daily at 12Stocks.com ➞ Best Stocks Today ➞ Best Stocks Weekly ➞ Best Stocks Year-to-Date ➞ Best Stocks Trends ➞  Best Stocks Today 12Stocks.com Best Nasdaq Stocks ➞ Best S&P 500 Stocks ➞ Best Tech Stocks ➞ Best Biotech Stocks ➞ |
| Detailed Overview of Emerging Markets Stocks |
| Emerging Markets Technical Overview, Leaders & Laggards, Top Emerging Markets ETF Funds & Detailed Emerging Markets Stocks List, Charts, Trends & More |
| Emerging Markets: Technical Analysis, Trends & YTD Performance | |
 EEM Weekly Chart |
|
| Long Term Trend: Very Good | |
| Medium Term Trend: Very Good | |
 EEM Daily Chart |
|
| Short Term Trend: Very Good | |
| Overall Trend Score: 95 | |
| YTD Performance: 8.9% | |
| **Trend Scores & Views Are Only For Educational Purposes And Not For Investing | |
| 12Stocks.com: Investing in Emerging Markets Index using Exchange Traded Funds | |
|
The following table shows list of key exchange traded funds (ETF) that
help investors play Emerging Markets stock market. For detailed view, check out our ETF Funds section of our website. Quick View: Move mouse or cursor over ETF symbol (ticker) to view short-term technical chart and over ETF name to view long term chart. Click on ticker or stock name for detailed view. Click on to add stock symbol to your watchlist and to view watchlist. |
12Stocks.com List of ETFs that track Emerging Markets Index
| Ticker | ETF Name | Watchlist | Recent Price | Smart Investing & Trading Score | Change % | Week % | Year-to-date % |
| EEM | Emerging Markets | | 43.79 | 95 | 0.44 | 3.04 | 8.9% |
| VWO | Emerging Markets | | 44.89 | 100 | 0.72 | 3.29 | 9.22% |
| SCHE | Emerging Markets Equity | | 27.20 | 100 | 0.63 | 3.34 | 9.72% |
| EWX | Emerging Markets Small | | 59.01 | 100 | 1.03 | 2.93 | 4.52% |
| EET | Emerging Markets | | 57.71 | 95 | 0.84 | 6.11 | 13.47% |
| EDC | Emrg Mkts Bull | | 35.76 | 95 | 1.19 | 8.96 | 17.52% |
| EEV | Short Emerging | | 16.89 | 0 | -2.09 | -6.05 | -14.37% |
| EUM | Short Emerging | | 13.19 | 10 | -0.49 | -2.84 | -6.78% |
| EDIV | Emerging Markets Dividend | | 36.11 | 100 | 0.92 | 2.73 | 11.04% |
| EMIF | Emerging Markets Infrastructure | | 23.47 | 95 | 0.38 | 2.98 | 9.67% |
| CEW | Emerging Currency Strat | | 18.13 | 100 | 0.28 | 1.46 | 0.7% |
| EBND | Em Mkts Lcl | | 20.46 | 50 | -0.05 | 1.29 | -3.67% |
| EMCB | Emerging Markets Corp | | 64.58 | 64 | -0.17 | 0 | 1.06% |
| VWOB | Emerging Mkts Govt | | 63.65 | 71 | -0.22 | 0.82 | -0.16% |
| EEMA | Emerging Markets Asia | | 73.44 | 95 | 0.25 | 3.54 | 11.09% |
| EELV | Em Mkts Low | | 24.47 | 95 | 0.23 | 1.75 | 1.79% |
| DVYE | Emerging Markets Dividend | | 29.45 | 100 | 0.89 | 3.66 | 11.17% |
| SDEM | SuperDividend Em Mkts | | 27.29 | 100 | 1.30 | 2.98 | 10.05% |
| DBEM | Em Mkts Hdgd | | 25.20 | 95 | 0.34 | 2.48 | 9.23% |
| PCY | Emerging Markets Sov | | 20.45 | 71 | -0.66 | 1.19 | -0.82% |
| QEMM | Emerging Mkts StratcFacts | | 60.71 | 100 | 0.58 | 2.57 | 6.22% |
| 12Stocks.com: Charts, Trends, Fundamental Data and Performances of Emerging Markets Stocks | |
|
We now take in-depth look at all Emerging Markets stocks including charts, multi-period performances and overall trends (as measured by Smart Investing & Trading Score ). One can sort Emerging Markets stocks (click link to choose) by Daily, Weekly and by Year-to-Date performances. Also, one can sort by size of the company or by market capitalization. |
| Select Your Default Chart Type: | |||||
| |||||
| Click on stock symbol or name for detailed view. Click on to add stock symbol to your watchlist and to view watchlist. Quick View: Move mouse or cursor over "Daily" to quickly view daily technical stock chart and over "Weekly" to view weekly technical stock chart. | |||||

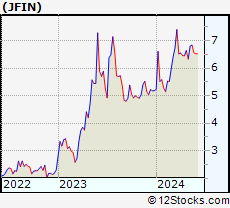 | JFIN Jiayin Group Inc. |
| Sector: Technology | |
| SubSector: Internet Information Providers | |
| MarketCap: 131.48 Millions | |
| Recent Price: 6.84 Smart Investing & Trading Score : 75 | |
| Day Percent Change: 2.09% Day Change: 0.14 | |
| Week Change: 0.59% Year-to-date Change: 32.1% | |
| JFIN Links: Profile News Message Board | |
| Charts:- Daily , Weekly | |
| Add JFIN to Watchlist: View: Get Complete JFIN Trend Analysis ➞ | |
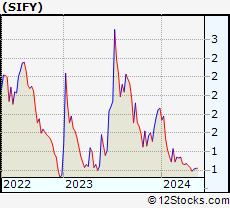 | SIFY Sify Technologies Limited |
| Sector: Technology | |
| SubSector: Internet Service Providers | |
| MarketCap: 159.38 Millions | |
| Recent Price: 1.26 Smart Investing & Trading Score : 74 | |
| Day Percent Change: 3.28% Day Change: 0.04 | |
| Week Change: 3.28% Year-to-date Change: -32.4% | |
| SIFY Links: Profile News Message Board | |
| Charts:- Daily , Weekly | |
| Add SIFY to Watchlist: View: Get Complete SIFY Trend Analysis ➞ | |
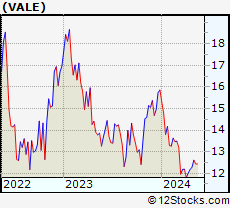 | VALE Vale S.A. |
| Sector: Materials | |
| SubSector: Industrial Metals & Minerals | |
| MarketCap: 43601 Millions | |
| Recent Price: 12.99 Smart Investing & Trading Score : 74 | |
| Day Percent Change: 2.61% Day Change: 0.33 | |
| Week Change: 4.42% Year-to-date Change: -18.1% | |
| VALE Links: Profile News Message Board | |
| Charts:- Daily , Weekly | |
| Add VALE to Watchlist: View: Get Complete VALE Trend Analysis ➞ | |
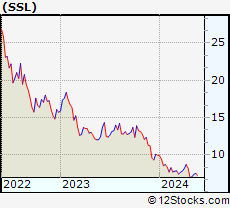 | SSL Sasol Limited |
| Sector: Energy | |
| SubSector: Major Integrated Oil & Gas | |
| MarketCap: 1233.85 Millions | |
| Recent Price: 7.51 Smart Investing & Trading Score : 74 | |
| Day Percent Change: 1.62% Day Change: 0.12 | |
| Week Change: 1.9% Year-to-date Change: -24.5% | |
| SSL Links: Profile News Message Board | |
| Charts:- Daily , Weekly | |
| Add SSL to Watchlist: View: Get Complete SSL Trend Analysis ➞ | |
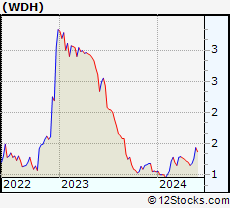 | WDH Waterdrop Inc. |
| Sector: Financials | |
| SubSector: Insurance - Diversified | |
| MarketCap: 874 Millions | |
| Recent Price: 1.26 Smart Investing & Trading Score : 74 | |
| Day Percent Change: 0.80% Day Change: 0.01 | |
| Week Change: 6.78% Year-to-date Change: 20.3% | |
| WDH Links: Profile News Message Board | |
| Charts:- Daily , Weekly | |
| Add WDH to Watchlist: View: Get Complete WDH Trend Analysis ➞ | |
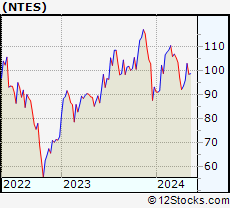 | NTES NetEase, Inc. |
| Sector: Technology | |
| SubSector: Internet Software & Services | |
| MarketCap: 40105.1 Millions | |
| Recent Price: 104.97 Smart Investing & Trading Score : 74 | |
| Day Percent Change: 0.73% Day Change: 0.76 | |
| Week Change: 6.54% Year-to-date Change: 12.7% | |
| NTES Links: Profile News Message Board | |
| Charts:- Daily , Weekly | |
| Add NTES to Watchlist: View: Get Complete NTES Trend Analysis ➞ | |
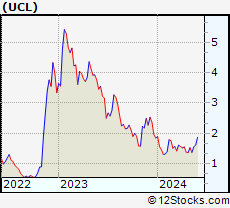 | UCL uCloudlink Group Inc. |
| Sector: Technology | |
| SubSector: Telecom Services | |
| MarketCap: 35837 Millions | |
| Recent Price: 1.56 Smart Investing & Trading Score : 73 | |
| Day Percent Change: 6.54% Day Change: 0.10 | |
| Week Change: 13.54% Year-to-date Change: -15.9% | |
| UCL Links: Profile News Message Board | |
| Charts:- Daily , Weekly | |
| Add UCL to Watchlist: View: Get Complete UCL Trend Analysis ➞ | |
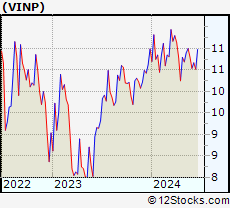 | VINP Vinci Partners Investments Ltd. |
| Sector: Financials | |
| SubSector: Asset Management | |
| MarketCap: 537 Millions | |
| Recent Price: 11.00 Smart Investing & Trading Score : 73 | |
| Day Percent Change: 1.85% Day Change: 0.20 | |
| Week Change: 0.92% Year-to-date Change: 0.1% | |
| VINP Links: Profile News Message Board | |
| Charts:- Daily , Weekly | |
| Add VINP to Watchlist: View: Get Complete VINP Trend Analysis ➞ | |
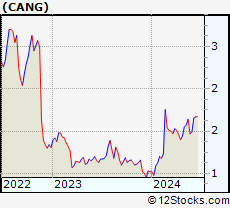 | CANG Cango Inc. |
| Sector: Technology | |
| SubSector: Internet Information Providers | |
| MarketCap: 947.48 Millions | |
| Recent Price: 1.64 Smart Investing & Trading Score : 71 | |
| Day Percent Change: 0.00% Day Change: 0.00 | |
| Week Change: 4.26% Year-to-date Change: 60.8% | |
| CANG Links: Profile News Message Board | |
| Charts:- Daily , Weekly | |
| Add CANG to Watchlist: View: Get Complete CANG Trend Analysis ➞ | |
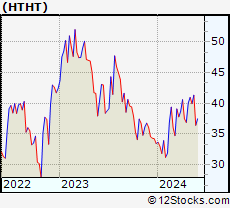 | HTHT Huazhu Group Limited |
| Sector: Services & Goods | |
| SubSector: Lodging | |
| MarketCap: 9164.46 Millions | |
| Recent Price: 41.33 Smart Investing & Trading Score : 71 | |
| Day Percent Change: -1.69% Day Change: -0.71 | |
| Week Change: 3.45% Year-to-date Change: 23.6% | |
| HTHT Links: Profile News Message Board | |
| Charts:- Daily , Weekly | |
| Add HTHT to Watchlist: View: Get Complete HTHT Trend Analysis ➞ | |
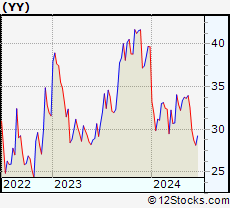 | YY JOYY Inc. |
| Sector: Technology | |
| SubSector: Internet Information Providers | |
| MarketCap: 3527.6 Millions | |
| Recent Price: 33.96 Smart Investing & Trading Score : 71 | |
| Day Percent Change: -0.44% Day Change: -0.15 | |
| Week Change: 0.92% Year-to-date Change: -14.5% | |
| YY Links: Profile News Message Board | |
| Charts:- Daily , Weekly | |
| Add YY to Watchlist: View: Get Complete YY Trend Analysis ➞ | |
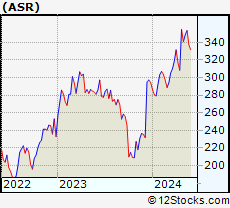 | ASR Grupo Aeroportuario del Sureste, S. A. B. de C. V. |
| Sector: Transports | |
| SubSector: Air Services, Other | |
| MarketCap: 2739.98 Millions | |
| Recent Price: 353.33 Smart Investing & Trading Score : 70 | |
| Day Percent Change: -0.29% Day Change: -1.01 | |
| Week Change: 1.36% Year-to-date Change: 20.1% | |
| ASR Links: Profile News Message Board | |
| Charts:- Daily , Weekly | |
| Add ASR to Watchlist: View: Get Complete ASR Trend Analysis ➞ | |
 | VIPS Vipshop Holdings Limited |
| Sector: Services & Goods | |
| SubSector: Catalog & Mail Order Houses | |
| MarketCap: 10496.2 Millions | |
| Recent Price: 17.32 Smart Investing & Trading Score : 69 | |
| Day Percent Change: 0.93% Day Change: 0.16 | |
| Week Change: 8.93% Year-to-date Change: -2.5% | |
| VIPS Links: Profile News Message Board | |
| Charts:- Daily , Weekly | |
| Add VIPS to Watchlist: View: Get Complete VIPS Trend Analysis ➞ | |
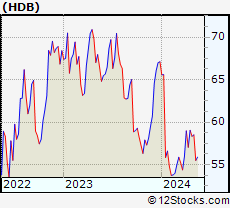 | HDB HDFC Bank Limited |
| Sector: Financials | |
| SubSector: Foreign Regional Banks | |
| MarketCap: 29894.1 Millions | |
| Recent Price: 56.78 Smart Investing & Trading Score : 68 | |
| Day Percent Change: 1.32% Day Change: 0.74 | |
| Week Change: 2.31% Year-to-date Change: -15.4% | |
| HDB Links: Profile News Message Board | |
| Charts:- Daily , Weekly | |
| Add HDB to Watchlist: View: Get Complete HDB Trend Analysis ➞ | |
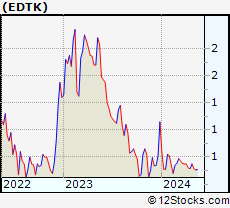 | EDTK Skillful Craftsman Education Technology Limited |
| Sector: Consumer Staples | |
| SubSector: Education & Training Services | |
| MarketCap: 32347 Millions | |
| Recent Price: 0.92 Smart Investing & Trading Score : 68 | |
| Day Percent Change: 0.11% Day Change: 0.00 | |
| Week Change: 1.65% Year-to-date Change: -27.0% | |
| EDTK Links: Profile News Message Board | |
| Charts:- Daily , Weekly | |
| Add EDTK to Watchlist: View: Get Complete EDTK Trend Analysis ➞ | |
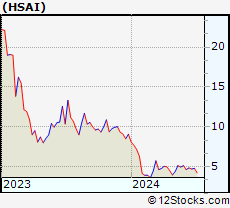 | HSAI Hesai Group |
| Sector: Services & Goods | |
| SubSector: Auto Parts | |
| MarketCap: 1330 Millions | |
| Recent Price: 5.15 Smart Investing & Trading Score : 68 | |
| Day Percent Change: 0.10% Day Change: 0.01 | |
| Week Change: 3.83% Year-to-date Change: -43.3% | |
| HSAI Links: Profile News Message Board | |
| Charts:- Daily , Weekly | |
| Add HSAI to Watchlist: View: Get Complete HSAI Trend Analysis ➞ | |
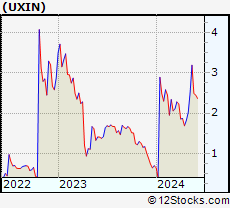 | UXIN Uxin Limited |
| Sector: Technology | |
| SubSector: Internet Information Providers | |
| MarketCap: 414.58 Millions | |
| Recent Price: 3.19 Smart Investing & Trading Score : 68 | |
| Day Percent Change: -9.63% Day Change: -0.34 | |
| Week Change: 27.09% Year-to-date Change: 355.1% | |
| UXIN Links: Profile News Message Board | |
| Charts:- Daily , Weekly | |
| Add UXIN to Watchlist: View: Get Complete UXIN Trend Analysis ➞ | |
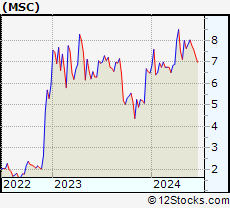 | MSC Studio City International Holdings Limited |
| Sector: Services & Goods | |
| SubSector: Resorts & Casinos | |
| MarketCap: 1420.54 Millions | |
| Recent Price: 7.82 Smart Investing & Trading Score : 68 | |
| Day Percent Change: -2.25% Day Change: -0.18 | |
| Week Change: 2.6% Year-to-date Change: 20.7% | |
| MSC Links: Profile News Message Board | |
| Charts:- Daily , Weekly | |
| Add MSC to Watchlist: View: Get Complete MSC Trend Analysis ➞ | |
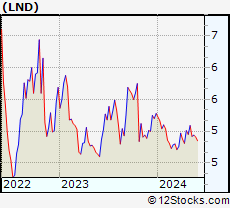 | LND BrasilAgro - Companhia Brasileira de Propriedades Agricolas |
| Sector: Financials | |
| SubSector: Property Management | |
| MarketCap: 157.842 Millions | |
| Recent Price: 4.94 Smart Investing & Trading Score : 68 | |
| Day Percent Change: -0.20% Day Change: -0.01 | |
| Week Change: 0.41% Year-to-date Change: -6.4% | |
| LND Links: Profile News Message Board | |
| Charts:- Daily , Weekly | |
| Add LND to Watchlist: View: Get Complete LND Trend Analysis ➞ | |
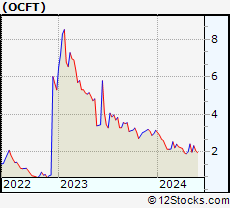 | OCFT OneConnect Financial Technology Co., Ltd. |
| Sector: Technology | |
| SubSector: Software Application | |
| MarketCap: 80387 Millions | |
| Recent Price: 2.33 Smart Investing & Trading Score : 67 | |
| Day Percent Change: 7.20% Day Change: 0.16 | |
| Week Change: 17.48% Year-to-date Change: -26.2% | |
| OCFT Links: Profile News Message Board | |
| Charts:- Daily , Weekly | |
| Add OCFT to Watchlist: View: Get Complete OCFT Trend Analysis ➞ | |
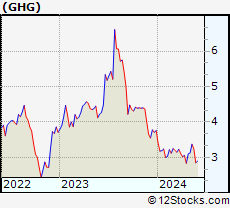 | GHG GreenTree Hospitality Group Ltd. |
| Sector: Services & Goods | |
| SubSector: Lodging | |
| MarketCap: 1195.36 Millions | |
| Recent Price: 3.24 Smart Investing & Trading Score : 67 | |
| Day Percent Change: 4.52% Day Change: 0.14 | |
| Week Change: -4.03% Year-to-date Change: -13.8% | |
| GHG Links: Profile News Message Board | |
| Charts:- Daily , Weekly | |
| Add GHG to Watchlist: View: Get Complete GHG Trend Analysis ➞ | |
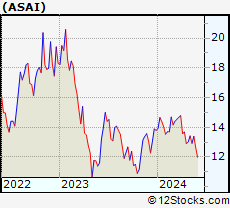 | ASAI Sendas Distribuidora S.A. |
| Sector: Consumer Staples | |
| SubSector: Grocery Stores | |
| MarketCap: 3790 Millions | |
| Recent Price: 13.39 Smart Investing & Trading Score : 67 | |
| Day Percent Change: 1.75% Day Change: 0.23 | |
| Week Change: 3.64% Year-to-date Change: -2.9% | |
| ASAI Links: Profile News Message Board | |
| Charts:- Daily , Weekly | |
| Add ASAI to Watchlist: View: Get Complete ASAI Trend Analysis ➞ | |
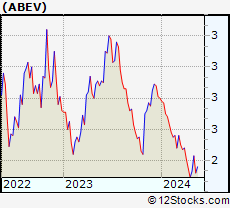 | ABEV Ambev S.A. |
| Sector: Consumer Staples | |
| SubSector: Beverages - Brewers | |
| MarketCap: 37753.5 Millions | |
| Recent Price: 2.42 Smart Investing & Trading Score : 67 | |
| Day Percent Change: 1.26% Day Change: 0.03 | |
| Week Change: 4.31% Year-to-date Change: -13.6% | |
| ABEV Links: Profile News Message Board | |
| Charts:- Daily , Weekly | |
| Add ABEV to Watchlist: View: Get Complete ABEV Trend Analysis ➞ | |
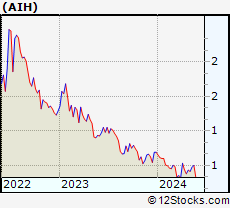 | AIH Aesthetic Medical International Holdings Group Limited |
| Sector: Health Care | |
| SubSector: Specialized Health Services | |
| MarketCap: 205.356 Millions | |
| Recent Price: 0.50 Smart Investing & Trading Score : 67 | |
| Day Percent Change: 0.24% Day Change: 0.00 | |
| Week Change: 5.47% Year-to-date Change: -27.6% | |
| AIH Links: Profile News Message Board | |
| Charts:- Daily , Weekly | |
| Add AIH to Watchlist: View: Get Complete AIH Trend Analysis ➞ | |
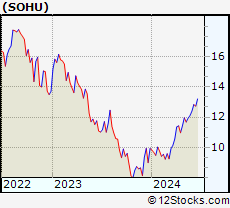 | SOHU Sohu.com Limited |
| Sector: Technology | |
| SubSector: Internet Information Providers | |
| MarketCap: 243.48 Millions | |
| Recent Price: 11.93 Smart Investing & Trading Score : 65 | |
| Day Percent Change: -1.40% Day Change: -0.17 | |
| Week Change: 2.14% Year-to-date Change: 20.1% | |
| SOHU Links: Profile News Message Board | |
| Charts:- Daily , Weekly | |
| Add SOHU to Watchlist: View: Get Complete SOHU Trend Analysis ➞ | |
| For tabular summary view of above stock list: Summary View ➞ 0 - 25 , 25 - 50 , 50 - 75 , 75 - 100 , 100 - 125 , 125 - 150 , 150 - 175 , 175 - 200 | ||
| Click To Change The Sort Order: By Market Cap or Company Size Performance: Year-to-date, Week and Day | |
| Select Chart Type: | ||
|
Best Stocks Today 12Stocks.com |
© 2024 12Stocks.com Terms & Conditions Privacy Contact Us
All Information Provided Only For Education And Not To Be Used For Investing or Trading. See Terms & Conditions


One More Thing ... Get Best Stocks Delivered Daily!
Never Ever Miss A Move With Our Top Ten Stocks Lists
Find Best Stocks In Any Market - Bull or Bear Market
Take A Peek At Our Top Ten Stocks Lists: Daily, Weekly, Year-to-Date & Top Trends
Find Best Stocks In Any Market - Bull or Bear Market
Take A Peek At Our Top Ten Stocks Lists: Daily, Weekly, Year-to-Date & Top Trends
Emerging Markets Stocks With Best Up Trends [0-bearish to 100-bullish]: Fangdd Network[100], 36Kr [100], Cheetah Mobile[100], Boqii Holding[100], DRDGOLD [100], ZTO Express[100], Full Truck[100], Sibanye Stillwater[100], Embraer S.A[100], GDS [100], JD.com [100]
Best Emerging Markets Stocks Year-to-Date:
U Power[3454.69%], DouYu [1040%], Burning Rock[760.19%], China Liberal[576.73%], Yatsen Holding[515.09%], MicroCloud Hologram[495.68%], Uxin [355.06%], Zhihu [349.45%], Zhongchao [313.59%], Fangdd Network[149.63%], Smart Share[121.36%] Best Emerging Markets Stocks This Week:
Burning Rock[946.66%], Fangdd Network[360.27%], HUYA [36.36%], Viomi [27.4%], Uxin [27.09%], MOGU [24.34%], Huize Holding[21.83%], MicroCloud Hologram[21.76%], U Power[20.64%], Bilibili [19.47%], Embraer S.A[19.33%] Best Emerging Markets Stocks Daily:
Fangdd Network[321.26%], Golden Heaven[16.00%], 17 Education[12.89%], China Liberal[11.01%], 36Kr [10.41%], Cheetah Mobile[10.34%], Zhihu [8.42%], MicroCloud Hologram[8.38%], Hywin [8.28%], iHuman [7.89%], AMTD Digital[7.37%]