
 Login Sign Up


| |||||
 |  | ||||

| 12Stocks.com Market Intelligence |
Best Consumer Services Stocks
| In a hurry? Services & Goods Stocks: Performance Trends Table, Stock Charts
Sort Consumer Services: Daily, Weekly, Year-to-Date, Market Cap & Trends. Filter Services & Goods stocks list by size: All Large Mid-Range Small |
| 12Stocks.com Consumer Services Stocks Performances & Trends Daily | |||||||||
|
|  The overall Smart Investing & Trading Score is 40 (0-bearish to 100-bullish) which puts Consumer Services sector in short term bearish to neutral trend. The Smart Investing & Trading Score from previous trading session is 64 and hence a deterioration of trend.
| ||||||||
Here are the Smart Investing & Trading Scores of the most requested Consumer Services stocks at 12Stocks.com (click stock name for detailed review):
|


| Consider signing up for our daily 12Stocks.com "Best Stocks Newsletter". You will never ever miss a big stock move again! |
| 12Stocks.com: Investing in Consumer Services sector with Stocks | |
|
The following table helps investors and traders sort through current performance and trends (as measured by Smart Investing & Trading Score) of various
stocks in the Consumer Services sector. Quick View: Move mouse or cursor over stock symbol (ticker) to view short-term Technical chart and over stock name to view long term chart. Click on  to add stock symbol to your watchlist and to add stock symbol to your watchlist and  to view watchlist. Click on any ticker or stock name for detailed market intelligence report for that stock. to view watchlist. Click on any ticker or stock name for detailed market intelligence report for that stock. |
12Stocks.com Performance of Stocks in Consumer Services Sector
| Ticker | Stock Name | Watchlist | Category | Recent Price | Smart Investing & Trading Score | Change % | YTD Change% |
| VRRM | Verra Mobility |   | Security | 25.58 | 34 | -1.12% | 11.07% |
| ROL | Rollins | | Services | 48.50 | 100 | 1.34% | 11.06% |
| DIS | Walt Disney | | Entertainment | 99.97 | 0 | -0.12% | 10.72% |
| VRSK | Verisk Analytics | | Services | 264.37 | 83 | 0.81% | 10.68% |
| UTI | Universal Technical | | Education | 13.84 | 0 | -2.33% | 10.54% |
| NWSA | News | | Broadcasting | 27.08 | 56 | -0.40% | 10.31% |
| BFAM | Bright Horizons | | Services | 103.94 | 0 | -0.61% | 10.29% |
| KR | Kroger Co | | Grocery | 50.38 | 10 | -0.28% | 10.22% |
| MG | Mistras | | Security | 8.05 | 0 | -3.48% | 9.97% |
| KAR | KAR Auction | | Retail | 16.28 | 0 | -2.69% | 9.93% |
| AZO | AutoZone | | Auto Parts | 2835.82 | 64 | 0.80% | 9.68% |
| ABM | ABM Industries | | Services | 49.17 | 63 | -2.61% | 9.68% |
| GWW | W.W. Grainger | | Equipment | 906.79 | 28 | -1.55% | 9.42% |
| WOOF | Petco Health | | Specialty Retail | 3.45 | 41 | -3.63% | 9.18% |
| AN | AutoNation | | Automobile | 163.97 | 0 | -2.49% | 9.18% |
| BH | Biglari | | Restaurants | 180.02 | 0 | -6.83% | 9.15% |
| BKNG | Booking | | Services | 3859.10 | 88 | 0.08% | 8.79% |
| HEPS | D-Market Elektronik | | Internet Retail | 1.93 | 51 | -1.53% | 8.73% |
| CPRT | Copart | | Automobile | 53.21 | 15 | 0.28% | 8.59% |
| DIBS | 1stdibs.Com | | Internet Retail | 5.09 | 0 | -3.87% | 8.53% |
| EXPO | Exponent | | Services | 95.15 | 68 | -0.79% | 8.08% |
| DJCO | Daily Journal | | Publishing | 367.60 | 49 | -0.85% | 7.86% |
| ATGE | Adtalem Global | | Education | 63.03 | 36 | -1.68% | 6.92% |
| ADT | ADT | | Security | 7.29 | 63 | -0.95% | 6.89% |
| OSW | OneSpaWorld | | Casinos | 15.05 | 51 | -2.02% | 6.74% |
| For chart view version of above stock list: Chart View ➞ 0 - 25 , 25 - 50 , 50 - 75 , 75 - 100 , 100 - 125 , 125 - 150 , 150 - 175 , 175 - 200 , 200 - 225 , 225 - 250 , 250 - 275 , 275 - 300 , 300 - 325 , 325 - 350 , 350 - 375 , 375 - 400 , 400 - 425 , 425 - 450 , 450 - 475 | ||
 | Click To Change The Sort Order: By Market Cap or Company Size Performance: Year-to-date, Week and Day |  |
|
Get the most comprehensive stock market coverage daily at 12Stocks.com ➞ Best Stocks Today ➞ Best Stocks Weekly ➞ Best Stocks Year-to-Date ➞ Best Stocks Trends ➞  Best Stocks Today 12Stocks.com Best Nasdaq Stocks ➞ Best S&P 500 Stocks ➞ Best Tech Stocks ➞ Best Biotech Stocks ➞ |
| Detailed Overview of Consumer Services Stocks |
| Consumer Services Technical Overview, Leaders & Laggards, Top Consumer Services ETF Funds & Detailed Consumer Services Stocks List, Charts, Trends & More |
| Consumer Services Sector: Technical Analysis, Trends & YTD Performance | |
| Consumer Services sector is composed of stocks
from retail, entertainment, media/publishing, consumer goods
and services subsectors. Consumer Services sector, as represented by XLY, an exchange-traded fund [ETF] that holds basket of Consumer Services stocks (e.g, Walmart, Alibaba) is down by -0.27% and is currently underperforming the overall market by -12.69% year-to-date. Below is a quick view of Technical charts and trends: |
|
 XLY Weekly Chart |
|
| Long Term Trend: Not Good | |
| Medium Term Trend: Very Good | |
 XLY Daily Chart |
|
| Short Term Trend: Good | |
| Overall Trend Score: 40 | |
| YTD Performance: -0.27% | |
| **Trend Scores & Views Are Only For Educational Purposes And Not For Investing | |
| 12Stocks.com: Top Performing Consumer Services Sector Stocks | ||||||||||||||||||||||||||||||||||||||||||||||||
 The top performing Consumer Services sector stocks year to date are
Now, more recently, over last week, the top performing Consumer Services sector stocks on the move are


|
||||||||||||||||||||||||||||||||||||||||||||||||
| 12Stocks.com: Investing in Consumer Services Sector using Exchange Traded Funds | |
|
The following table shows list of key exchange traded funds (ETF) that
help investors track Consumer Services Index. For detailed view, check out our ETF Funds section of our website. Quick View: Move mouse or cursor over ETF symbol (ticker) to view short-term Technical chart and over ETF name to view long term chart. Click on ticker or stock name for detailed view. Click on to add stock symbol to your watchlist and to view watchlist. |
12Stocks.com List of ETFs that track Consumer Services Index
| Ticker | ETF Name | Watchlist | Recent Price | Smart Investing & Trading Score | Change % | Week % | Year-to-date % |
| XLY | Consumer Discret Sel | | 178.33 | 40 | -0.79 | 0.38 | -0.27% |
| RTH | Retail | | 203.89 | 40 | -0.17 | 0.42 | 8.32% |
| IYC | Consumer Services | | 79.69 | 40 | -0.76 | -0.24 | 5.17% |
| XRT | Retail | | 74.79 | 8 | -1.40 | -1.66 | 3.42% |
| IYK | Consumer Goods | | 65.58 | 10 | -0.12 | -2.34 | 2.62% |
| UCC | Consumer Services | | 34.36 | 54 | -1.77 | 0.42 | -4.31% |
| RETL | Retail Bull 3X | | 9.07 | 5 | -4.63 | -5.22 | -0.55% |
| RXI | Globl Consumer Discretionary | | 157.70 | 0 | -1.56 | -2.43 | -0.86% |
| SCC | Short Consumer Services | | 15.57 | 61 | 2.21 | 0.01 | 1.61% |
| UGE | Consumer Goods | | 17.49 | 38 | -0.07 | -2.45 | 11.12% |
| 12Stocks.com: Charts, Trends, Fundamental Data and Performances of Consumer Services Stocks | |
|
We now take in-depth look at all Consumer Services stocks including charts, multi-period performances and overall trends (as measured by Smart Investing & Trading Score). One can sort Consumer Services stocks (click link to choose) by Daily, Weekly and by Year-to-Date performances. Also, one can sort by size of the company or by market capitalization. |
| Select Your Default Chart Type: | |||||
| |||||
| Click on stock symbol or name for detailed view. Click on to add stock symbol to your watchlist and to view watchlist. Quick View: Move mouse or cursor over "Daily" to quickly view daily Technical stock chart and over "Weekly" to view weekly Technical stock chart. | |||||

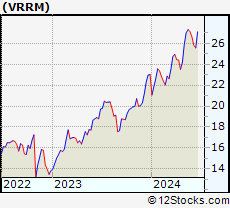 | VRRM Verra Mobility Corporation |
| Sector: Services & Goods | |
| SubSector: Security & Protection Services | |
| MarketCap: 1265.03 Millions | |
| Recent Price: 25.58 Smart Investing & Trading Score: 34 | |
| Day Percent Change: -1.12% Day Change: -0.29 | |
| Week Change: -0.93% Year-to-date Change: 11.1% | |
| VRRM Links: Profile News Message Board | |
| Charts:- Daily , Weekly | |
| Add VRRM to Watchlist: View: Get Complete VRRM Trend Analysis ➞ | |
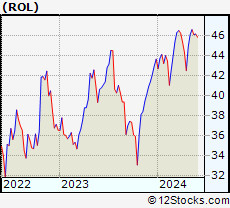 | ROL Rollins, Inc. |
| Sector: Services & Goods | |
| SubSector: Business Services | |
| MarketCap: 12827.4 Millions | |
| Recent Price: 48.50 Smart Investing & Trading Score: 100 | |
| Day Percent Change: 1.34% Day Change: 0.64 | |
| Week Change: 4.14% Year-to-date Change: 11.1% | |
| ROL Links: Profile News Message Board | |
| Charts:- Daily , Weekly | |
| Add ROL to Watchlist: View: Get Complete ROL Trend Analysis ➞ | |
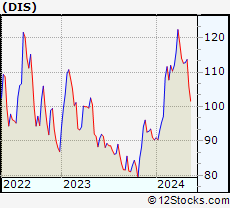 | DIS The Walt Disney Company |
| Sector: Services & Goods | |
| SubSector: Entertainment - Diversified | |
| MarketCap: 178396 Millions | |
| Recent Price: 99.97 Smart Investing & Trading Score: 0 | |
| Day Percent Change: -0.12% Day Change: -0.12 | |
| Week Change: -1.55% Year-to-date Change: 10.7% | |
| DIS Links: Profile News Message Board | |
| Charts:- Daily , Weekly | |
| Add DIS to Watchlist: View: Get Complete DIS Trend Analysis ➞ | |
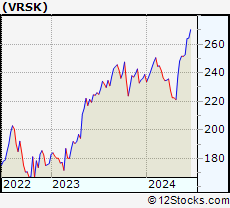 | VRSK Verisk Analytics, Inc. |
| Sector: Services & Goods | |
| SubSector: Business Services | |
| MarketCap: 22033.2 Millions | |
| Recent Price: 264.37 Smart Investing & Trading Score: 83 | |
| Day Percent Change: 0.81% Day Change: 2.13 | |
| Week Change: 0.14% Year-to-date Change: 10.7% | |
| VRSK Links: Profile News Message Board | |
| Charts:- Daily , Weekly | |
| Add VRSK to Watchlist: View: Get Complete VRSK Trend Analysis ➞ | |
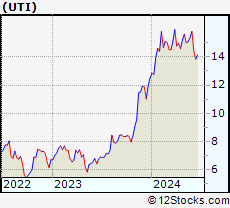 | UTI Universal Technical Institute, Inc. |
| Sector: Services & Goods | |
| SubSector: Education & Training Services | |
| MarketCap: 163.506 Millions | |
| Recent Price: 13.84 Smart Investing & Trading Score: 0 | |
| Day Percent Change: -2.33% Day Change: -0.33 | |
| Week Change: -3.96% Year-to-date Change: 10.5% | |
| UTI Links: Profile News Message Board | |
| Charts:- Daily , Weekly | |
| Add UTI to Watchlist: View: Get Complete UTI Trend Analysis ➞ | |
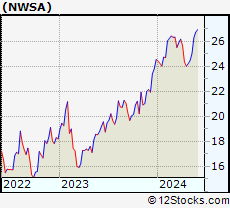 | NWSA News Corporation |
| Sector: Services & Goods | |
| SubSector: Broadcasting - TV | |
| MarketCap: 5857.53 Millions | |
| Recent Price: 27.08 Smart Investing & Trading Score: 56 | |
| Day Percent Change: -0.40% Day Change: -0.11 | |
| Week Change: -0.4% Year-to-date Change: 10.3% | |
| NWSA Links: Profile News Message Board | |
| Charts:- Daily , Weekly | |
| Add NWSA to Watchlist: View: Get Complete NWSA Trend Analysis ➞ | |
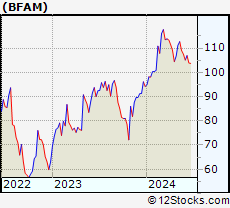 | BFAM Bright Horizons Family Solutions Inc. |
| Sector: Services & Goods | |
| SubSector: Personal Services | |
| MarketCap: 5487.65 Millions | |
| Recent Price: 103.94 Smart Investing & Trading Score: 0 | |
| Day Percent Change: -0.61% Day Change: -0.64 | |
| Week Change: -2.83% Year-to-date Change: 10.3% | |
| BFAM Links: Profile News Message Board | |
| Charts:- Daily , Weekly | |
| Add BFAM to Watchlist: View: Get Complete BFAM Trend Analysis ➞ | |
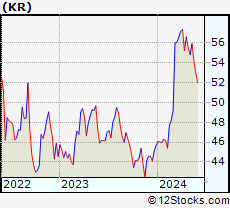 | KR The Kroger Co. |
| Sector: Services & Goods | |
| SubSector: Grocery Stores | |
| MarketCap: 26718.5 Millions | |
| Recent Price: 50.38 Smart Investing & Trading Score: 10 | |
| Day Percent Change: -0.28% Day Change: -0.14 | |
| Week Change: -3.08% Year-to-date Change: 10.2% | |
| KR Links: Profile News Message Board | |
| Charts:- Daily , Weekly | |
| Add KR to Watchlist: View: Get Complete KR Trend Analysis ➞ | |
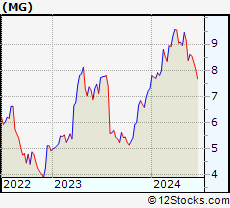 | MG Mistras Group, Inc. |
| Sector: Services & Goods | |
| SubSector: Security & Protection Services | |
| MarketCap: 136.903 Millions | |
| Recent Price: 8.05 Smart Investing & Trading Score: 0 | |
| Day Percent Change: -3.48% Day Change: -0.29 | |
| Week Change: -3.13% Year-to-date Change: 10.0% | |
| MG Links: Profile News Message Board | |
| Charts:- Daily , Weekly | |
| Add MG to Watchlist: View: Get Complete MG Trend Analysis ➞ | |
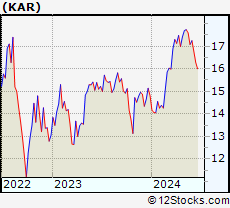 | KAR KAR Auction Services, Inc. |
| Sector: Services & Goods | |
| SubSector: Specialty Retail, Other | |
| MarketCap: 1709.54 Millions | |
| Recent Price: 16.28 Smart Investing & Trading Score: 0 | |
| Day Percent Change: -2.69% Day Change: -0.45 | |
| Week Change: -2.98% Year-to-date Change: 9.9% | |
| KAR Links: Profile News Message Board | |
| Charts:- Daily , Weekly | |
| Add KAR to Watchlist: View: Get Complete KAR Trend Analysis ➞ | |
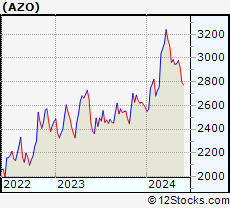 | AZO AutoZone, Inc. |
| Sector: Services & Goods | |
| SubSector: Auto Parts Stores | |
| MarketCap: 19128 Millions | |
| Recent Price: 2835.82 Smart Investing & Trading Score: 64 | |
| Day Percent Change: 0.80% Day Change: 22.42 | |
| Week Change: 1.25% Year-to-date Change: 9.7% | |
| AZO Links: Profile News Message Board | |
| Charts:- Daily , Weekly | |
| Add AZO to Watchlist: View: Get Complete AZO Trend Analysis ➞ | |
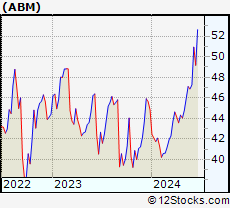 | ABM ABM Industries Incorporated |
| Sector: Services & Goods | |
| SubSector: Business Services | |
| MarketCap: 1706.72 Millions | |
| Recent Price: 49.17 Smart Investing & Trading Score: 63 | |
| Day Percent Change: -2.61% Day Change: -1.32 | |
| Week Change: -3.47% Year-to-date Change: 9.7% | |
| ABM Links: Profile News Message Board | |
| Charts:- Daily , Weekly | |
| Add ABM to Watchlist: View: Get Complete ABM Trend Analysis ➞ | |
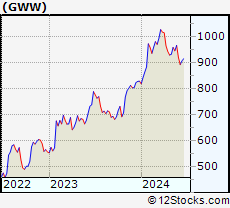 | GWW W.W. Grainger, Inc. |
| Sector: Services & Goods | |
| SubSector: Industrial Equipment Wholesale | |
| MarketCap: 12794.8 Millions | |
| Recent Price: 906.79 Smart Investing & Trading Score: 28 | |
| Day Percent Change: -1.55% Day Change: -14.28 | |
| Week Change: 1.63% Year-to-date Change: 9.4% | |
| GWW Links: Profile News Message Board | |
| Charts:- Daily , Weekly | |
| Add GWW to Watchlist: View: Get Complete GWW Trend Analysis ➞ | |
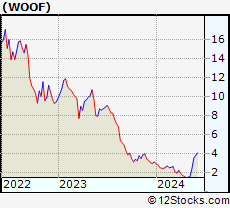 | WOOF Petco Health and Wellness Company, Inc. |
| Sector: Services & Goods | |
| SubSector: Specialty Retail | |
| MarketCap: 2030 Millions | |
| Recent Price: 3.45 Smart Investing & Trading Score: 41 | |
| Day Percent Change: -3.63% Day Change: -0.13 | |
| Week Change: -5.48% Year-to-date Change: 9.2% | |
| WOOF Links: Profile News Message Board | |
| Charts:- Daily , Weekly | |
| Add WOOF to Watchlist: View: Get Complete WOOF Trend Analysis ➞ | |
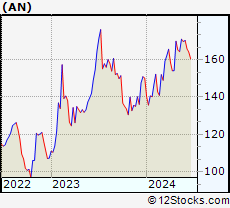 | AN AutoNation, Inc. |
| Sector: Services & Goods | |
| SubSector: Auto Dealerships | |
| MarketCap: 2732.61 Millions | |
| Recent Price: 163.97 Smart Investing & Trading Score: 0 | |
| Day Percent Change: -2.49% Day Change: -4.18 | |
| Week Change: -1.12% Year-to-date Change: 9.2% | |
| AN Links: Profile News Message Board | |
| Charts:- Daily , Weekly | |
| Add AN to Watchlist: View: Get Complete AN Trend Analysis ➞ | |
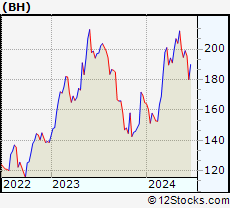 | BH Biglari Holdings Inc. |
| Sector: Services & Goods | |
| SubSector: Restaurants | |
| MarketCap: 149.07 Millions | |
| Recent Price: 180.02 Smart Investing & Trading Score: 0 | |
| Day Percent Change: -6.83% Day Change: -13.19 | |
| Week Change: -7.97% Year-to-date Change: 9.2% | |
| BH Links: Profile News Message Board | |
| Charts:- Daily , Weekly | |
| Add BH to Watchlist: View: Get Complete BH Trend Analysis ➞ | |
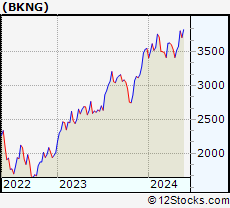 | BKNG Booking Holdings Inc. |
| Sector: Services & Goods | |
| SubSector: Business Services | |
| MarketCap: 54467.9 Millions | |
| Recent Price: 3859.10 Smart Investing & Trading Score: 88 | |
| Day Percent Change: 0.08% Day Change: 2.96 | |
| Week Change: 1.21% Year-to-date Change: 8.8% | |
| BKNG Links: Profile News Message Board | |
| Charts:- Daily , Weekly | |
| Add BKNG to Watchlist: View: Get Complete BKNG Trend Analysis ➞ | |
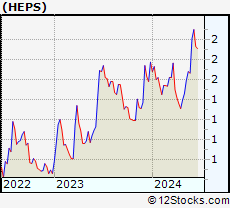 | HEPS D-Market Elektronik Hizmetler ve Ticaret A.S. |
| Sector: Services & Goods | |
| SubSector: Internet Retail | |
| MarketCap: 561 Millions | |
| Recent Price: 1.93 Smart Investing & Trading Score: 51 | |
| Day Percent Change: -1.53% Day Change: -0.03 | |
| Week Change: -8.1% Year-to-date Change: 8.7% | |
| HEPS Links: Profile News Message Board | |
| Charts:- Daily , Weekly | |
| Add HEPS to Watchlist: View: Get Complete HEPS Trend Analysis ➞ | |
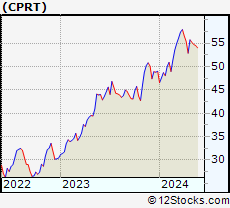 | CPRT Copart, Inc. |
| Sector: Services & Goods | |
| SubSector: Auto Dealerships | |
| MarketCap: 15462.1 Millions | |
| Recent Price: 53.21 Smart Investing & Trading Score: 15 | |
| Day Percent Change: 0.28% Day Change: 0.15 | |
| Week Change: -1.02% Year-to-date Change: 8.6% | |
| CPRT Links: Profile News Message Board | |
| Charts:- Daily , Weekly | |
| Add CPRT to Watchlist: View: Get Complete CPRT Trend Analysis ➞ | |
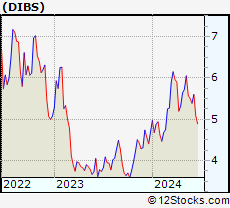 | DIBS 1stdibs.Com, Inc. |
| Sector: Services & Goods | |
| SubSector: Internet Retail | |
| MarketCap: 149 Millions | |
| Recent Price: 5.09 Smart Investing & Trading Score: 0 | |
| Day Percent Change: -3.87% Day Change: -0.21 | |
| Week Change: -9.11% Year-to-date Change: 8.5% | |
| DIBS Links: Profile News Message Board | |
| Charts:- Daily , Weekly | |
| Add DIBS to Watchlist: View: Get Complete DIBS Trend Analysis ➞ | |
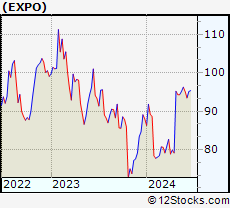 | EXPO Exponent, Inc. |
| Sector: Services & Goods | |
| SubSector: Management Services | |
| MarketCap: 3605.95 Millions | |
| Recent Price: 95.15 Smart Investing & Trading Score: 68 | |
| Day Percent Change: -0.79% Day Change: -0.76 | |
| Week Change: 1.79% Year-to-date Change: 8.1% | |
| EXPO Links: Profile News Message Board | |
| Charts:- Daily , Weekly | |
| Add EXPO to Watchlist: View: Get Complete EXPO Trend Analysis ➞ | |
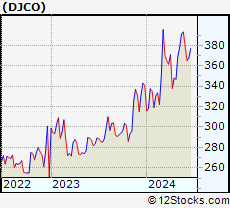 | DJCO Daily Journal Corporation |
| Sector: Services & Goods | |
| SubSector: Publishing - Newspapers | |
| MarketCap: 306.822 Millions | |
| Recent Price: 367.60 Smart Investing & Trading Score: 49 | |
| Day Percent Change: -0.85% Day Change: -3.14 | |
| Week Change: 0.65% Year-to-date Change: 7.9% | |
| DJCO Links: Profile News Message Board | |
| Charts:- Daily , Weekly | |
| Add DJCO to Watchlist: View: Get Complete DJCO Trend Analysis ➞ | |
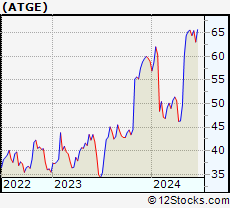 | ATGE Adtalem Global Education Inc. |
| Sector: Services & Goods | |
| SubSector: Education & Training Services | |
| MarketCap: 1273.86 Millions | |
| Recent Price: 63.03 Smart Investing & Trading Score: 36 | |
| Day Percent Change: -1.68% Day Change: -1.08 | |
| Week Change: -3.67% Year-to-date Change: 6.9% | |
| ATGE Links: Profile News Message Board | |
| Charts:- Daily , Weekly | |
| Add ATGE to Watchlist: View: Get Complete ATGE Trend Analysis ➞ | |
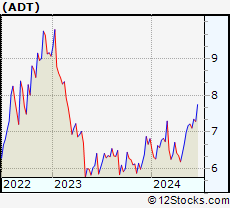 | ADT ADT Inc. |
| Sector: Services & Goods | |
| SubSector: Security & Protection Services | |
| MarketCap: 2892.03 Millions | |
| Recent Price: 7.29 Smart Investing & Trading Score: 63 | |
| Day Percent Change: -0.95% Day Change: -0.07 | |
| Week Change: -0.82% Year-to-date Change: 6.9% | |
| ADT Links: Profile News Message Board | |
| Charts:- Daily , Weekly | |
| Add ADT to Watchlist: View: Get Complete ADT Trend Analysis ➞ | |
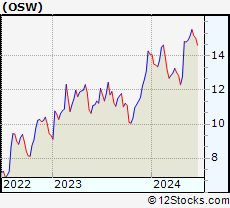 | OSW OneSpaWorld Holdings Limited |
| Sector: Services & Goods | |
| SubSector: Resorts & Casinos | |
| MarketCap: 228.394 Millions | |
| Recent Price: 15.05 Smart Investing & Trading Score: 51 | |
| Day Percent Change: -2.02% Day Change: -0.31 | |
| Week Change: -0.92% Year-to-date Change: 6.7% | |
| OSW Links: Profile News Message Board | |
| Charts:- Daily , Weekly | |
| Add OSW to Watchlist: View: Get Complete OSW Trend Analysis ➞ | |
| For tabular summary view of above stock list: Summary View ➞ 0 - 25 , 25 - 50 , 50 - 75 , 75 - 100 , 100 - 125 , 125 - 150 , 150 - 175 , 175 - 200 , 200 - 225 , 225 - 250 , 250 - 275 , 275 - 300 , 300 - 325 , 325 - 350 , 350 - 375 , 375 - 400 , 400 - 425 , 425 - 450 , 450 - 475 | ||
| Click To Change The Sort Order: By Market Cap or Company Size Performance: Year-to-date, Week and Day | |
| Select Chart Type: | ||
|
Best Stocks Today 12Stocks.com |
© 2024 12Stocks.com Terms & Conditions Privacy Contact Us
All Information Provided Only For Education And Not To Be Used For Investing or Trading. See Terms & Conditions


One More Thing ... Get Best Stocks Delivered Daily!
Never Ever Miss A Move With Our Top Ten Stocks Lists
Find Best Stocks In Any Market - Bull or Bear Market
Take A Peek At Our Top Ten Stocks Lists: Daily, Weekly, Year-to-Date & Top Trends
Find Best Stocks In Any Market - Bull or Bear Market
Take A Peek At Our Top Ten Stocks Lists: Daily, Weekly, Year-to-Date & Top Trends
Consumer Services Stocks With Best Up Trends [0-bearish to 100-bullish]: MOGU [100], Cinemark [100], Ollie s[100], Boqii Holding[100], Rollins [100], Cedar Fair[100], United Homes[100], Cintas [95], Lanvin [95], Nextdoor [93], GDEV [93]
Best Consumer Services Stocks Year-to-Date:
U Power[3477.01%], Vroom [1519.43%], Fluent [411.19%], Yatsen Holding[355.17%], Zhihu [217.26%], Sweetgreen [179.12%], Jumia Technologies[163.17%], Codere Online[139.73%], Faraday Future[123.23%], Abercrombie & Fitch Co[110.9%], CAVA [106.83%] Best Consumer Services Stocks This Week:
Boqii Holding[48.89%], MOGU [25.01%], Jumia Technologies[23.87%], United Homes[21.31%], Lanvin [20.51%], BARK [15.79%], Nextdoor [14.48%], Emerald Holding[14.29%], U Power[13.69%], GDEV [13.64%], Casey s[13.2%] Best Consumer Services Stocks Daily:
MOGU [28.15%], ECARX [9.26%], Haverty Furniture[7.48%], Solo Brands[7.18%], Sunlands Technology[7.09%], Afya [5.91%], China Online[4.05%], U Power[3.72%], Research[3.06%], Global-e Online[2.96%], Mondee [2.93%]