
 Login Sign Up


| |||||
 |  | ||||

| 12Stocks.com Market Intelligence |
Best Tech Stocks
| In a hurry? Tech Stocks Lists: Performance & Trends, Stock Charts, FANG Stocks
Sort Tech stocks: Daily, Weekly, Year-to-Date, Market Cap & Trends. Filter Tech stocks list by size:All Tech Large Mid-Range Small and MicroCap |
| 12Stocks.com Tech Stocks Performances & Trends Daily | |||||||||
|
|  The overall Smart Investing & Trading Score is 56 (0-bearish to 100-bullish) which puts Technology sector in short term neutral trend. The Smart Investing & Trading Score from previous trading session is 76 and a deterioration of trend continues.
| ||||||||
Here are the Smart Investing & Trading Scores of the most requested Technology stocks at 12Stocks.com (click stock name for detailed review):
|


| 12Stocks.com: Investing in Technology sector with Stocks | |
|
The following table helps investors and traders sort through current performance and trends (as measured by Smart Investing & Trading Score) of various
stocks in the Tech sector. Quick View: Move mouse or cursor over stock symbol (ticker) to view short-term technical chart and over stock name to view long term chart. Click on  to add stock symbol to your watchlist and to add stock symbol to your watchlist and  to view watchlist. Click on any ticker or stock name for detailed market intelligence report for that stock. to view watchlist. Click on any ticker or stock name for detailed market intelligence report for that stock. |
12Stocks.com Performance of Stocks in Tech Sector
| Ticker | Stock Name | Watchlist | Category | Recent Price | Smart Investing & Trading Score | Change % | YTD Change% |
| MRVL | Marvell |   | Semiconductor | 68.81 | 25 | -10.46% | 14.09% |
| BBAI | BigBear.ai | | IT | 1.50 | 25 | -1.96% | -29.58% |
| SMRT | SmartRent | | Software - | 2.36 | 25 | -1.67% | -26.02% |
| KRKR | 36Kr | | Internet | 0.39 | 25 | -1.28% | -31.25% |
| SWI | SolarWinds | | Software | 11.58 | 25 | -0.94% | -7.29% |
| CCCS | CCC Intelligent | | Software - Infrastructure | 11.18 | 25 | -0.89% | -1.45% |
| INFY | Infosys | | IT | 16.75 | 25 | -0.71% | -8.87% |
| CRWD | CrowdStrike | | Security Software | 313.67 | 25 | -0.71% | 22.85% |
| SNPS | Synopsys | | Semiconductor | 560.80 | 25 | -0.70% | 8.91% |
| CDNS | Cadence Design | | Software | 286.31 | 25 | -0.67% | 5.12% |
| BILL | Bill.com | | Software | 52.05 | 25 | 1.50% | -36.21% |
| PLUS | ePlus | | Software | 74.84 | 25 | 1.19% | -6.26% |
| FTV | Fortive | | Instruments | 74.44 | 25 | 1.17% | 1.10% |
| YEXT | Yext | | Internet | 5.05 | 25 | 1.00% | -14.26% |
| DOX | Amdocs | | Software | 79.00 | 25 | 0.92% | -10.11% |
| CSCO | Cisco Systems | | Communication | 46.50 | 25 | 0.82% | -7.96% |
| IIIV | i3 Verticals | | Software | 19.48 | 25 | 0.46% | -7.98% |
| TIXT | TELUS | | Software - Infrastructure | 5.73 | 25 | 0.17% | -32.98% |
| HURC | Hurco | | Instruments | 17.84 | 22 | -0.89% | -17.14% |
| AUDC | AudioCodes | | Communication | 9.99 | 22 | -0.10% | -17.23% |
| CMBM | Cambium Networks | | Communication | 3.21 | 20 | 5.25% | -46.50% |
| DBX | Dropbox | | Software | 22.53 | 20 | 0.85% | -23.58% |
| EB | Eventbrite | | Software | 4.98 | 20 | 0.81% | -40.43% |
| VHC | VirnetX Holding | | Internet | 4.12 | 20 | 0.49% | -41.14% |
| GLOB | Globant S.A | | IT | 161.12 | 20 | 0.46% | -32.30% |
| For chart view version of above stock list: Chart View ➞ 0 - 25 , 25 - 50 , 50 - 75 , 75 - 100 , 100 - 125 , 125 - 150 , 150 - 175 , 175 - 200 , 200 - 225 , 225 - 250 , 250 - 275 , 275 - 300 , 300 - 325 , 325 - 350 , 350 - 375 , 375 - 400 , 400 - 425 , 425 - 450 , 450 - 475 , 475 - 500 , 500 - 525 , 525 - 550 , 550 - 575 , 575 - 600 , 600 - 625 , 625 - 650 | ||
 | Click To Change The Sort Order: By Market Cap or Company Size Performance: Year-to-date, Week and Day |  |
|
Get the most comprehensive stock market coverage daily at 12Stocks.com ➞ Best Stocks Today ➞ Best Stocks Weekly ➞ Best Stocks Year-to-Date ➞ Best Stocks Trends ➞  Best Stocks Today 12Stocks.com Best Nasdaq Stocks ➞ Best S&P 500 Stocks ➞ Best Tech Stocks ➞ Best Biotech Stocks ➞ |
| Detailed Overview of Tech Stocks |
| Tech Technical Overview, Leaders & Laggards, Top Tech ETF Funds & Detailed Tech Stocks List, Charts, Trends & More |
| Tech Sector: Technical Analysis, Trends & YTD Performance | |
| Technology sector is composed of stocks
from semiconductors, software, web, social media
and services subsectors. Technology sector, as represented by XLK, an exchange-traded fund [ETF] that holds basket of tech stocks (e.g, Intel, Google) is up by 9.19% and is currently underperforming the overall market by -0.6% year-to-date. Below is a quick view of technical charts and trends: |
|
 XLK Weekly Chart |
|
| Long Term Trend: Good | |
| Medium Term Trend: Very Good | |
 XLK Daily Chart |
|
| Short Term Trend: Not Good | |
| Overall Trend Score: 56 | |
| YTD Performance: 9.19% | |
| **Trend Scores & Views Are Only For Educational Purposes And Not For Investing | |
| 12Stocks.com: Top Performing Technology Sector Stocks | ||||||||||||||||||||||||||||||||||||||||||||||||
 The top performing Technology sector stocks year to date are
Now, more recently, over last week, the top performing Technology sector stocks on the move are


|
||||||||||||||||||||||||||||||||||||||||||||||||
| 12Stocks.com: Investing in Tech Sector using Exchange Traded Funds | |
|
The following table shows list of key exchange traded funds (ETF) that
help investors track Tech Index. For detailed view, check out our ETF Funds section of our website. Quick View: Move mouse or cursor over ETF symbol (ticker) to view short-term technical chart and over ETF name to view long term chart. Click on ticker or stock name for detailed view. Click on to add stock symbol to your watchlist and to view watchlist. |
12Stocks.com List of ETFs that track Tech Index
| Ticker | ETF Name | Watchlist | Recent Price | Smart Investing & Trading Score | Change % | Week % | Year-to-date % |
| XLK | Technology | | 210.16 | 56 | 0.16 | -2.34 | 9.19% |
| QQQ | QQQ | | 451.60 | 63 | 0.03 | -1.39 | 10.28% |
| IYW | Technology | | 136.53 | 56 | -1.56 | -3.54 | 11.23% |
| VGT | Information Technology | | 534.61 | 56 | -0.09 | -1.95 | 10.46% |
| IXN | Global Tech | | 75.45 | 56 | -1.76 | -3.13 | 10.66% |
| IGV | Tech-Software | | 78.04 | 0 | 0.88 | -5.86 | -3.81% |
| XSD | Semiconductor | | 242.35 | 68 | -1.05 | -1.43 | 7.81% |
| TQQQ | QQQ | | 62.53 | 56 | -0.11 | -4.32 | 23.33% |
| SQQQ | Short QQQ | | 10.02 | 39 | 0.00 | 4.38 | -25.5% |
| SOXL | Semicondct Bull 3X | | 48.59 | 68 | -2.82 | -5.54 | 54.75% |
| SOXS | Semicondct Bear 3X | | 27.54 | 58 | 2.91 | 5.92 | 373.2% |
| SOXX | PHLX Semiconductor | | 234.05 | 68 | -0.83 | -1.89 | 21.88% |
| QTEC | First -100-Tech | | 183.10 | 25 | -2.04 | -5.22 | 4.35% |
| SMH | Semiconductor | | 240.48 | 68 | -0.74 | -1.55 | 37.52% |
| 12Stocks.com: Charts, Trends, Fundamental Data and Performances of Tech Stocks | |
|
We now take in-depth look at all Tech stocks including charts, multi-period performances and overall trends (as measured by Smart Investing & Trading Score). One can sort Tech stocks (click link to choose) by Daily, Weekly and by Year-to-Date performances. Also, one can sort by size of the company or by market capitalization. |
| Select Your Default Chart Type: | |||||
| |||||
| Click on stock symbol or name for detailed view. Click on to add stock symbol to your watchlist and to view watchlist. Quick View: Move mouse or cursor over "Daily" to quickly view daily technical stock chart and over "Weekly" to view weekly technical stock chart. | |||||


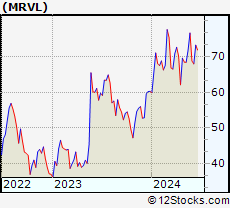 | MRVL Marvell Technology Group Ltd. |
| Sector: Technology | |
| SubSector: Semiconductor - Integrated Circuits | |
| MarketCap: 14090.4 Millions | |
| Recent Price: 68.81 Smart Investing & Trading Score: 25 | |
| Day Percent Change: -10.46% Day Change: -8.04 | |
| Week Change: -10.26% Year-to-date Change: 14.1% | |
| MRVL Links: Profile News Message Board | |
| Charts:- Daily , Weekly | |
| Add MRVL to Watchlist: View: Get Complete MRVL Trend Analysis ➞ | |
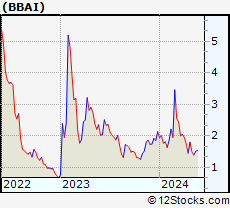 | BBAI BigBear.ai Holdings, Inc. |
| Sector: Technology | |
| SubSector: Information Technology Services | |
| MarketCap: 339 Millions | |
| Recent Price: 1.50 Smart Investing & Trading Score: 25 | |
| Day Percent Change: -1.96% Day Change: -0.03 | |
| Week Change: -2.91% Year-to-date Change: -29.6% | |
| BBAI Links: Profile News Message Board | |
| Charts:- Daily , Weekly | |
| Add BBAI to Watchlist: View: Get Complete BBAI Trend Analysis ➞ | |
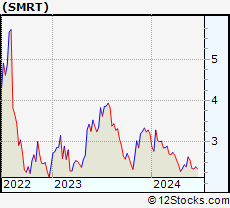 | SMRT SmartRent, Inc. |
| Sector: Technology | |
| SubSector: Software - Application | |
| MarketCap: 733 Millions | |
| Recent Price: 2.36 Smart Investing & Trading Score: 25 | |
| Day Percent Change: -1.67% Day Change: -0.04 | |
| Week Change: -7.81% Year-to-date Change: -26.0% | |
| SMRT Links: Profile News Message Board | |
| Charts:- Daily , Weekly | |
| Add SMRT to Watchlist: View: Get Complete SMRT Trend Analysis ➞ | |
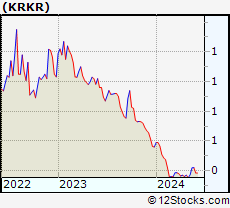 | KRKR 36Kr Holdings Inc. |
| Sector: Technology | |
| SubSector: Internet Information Providers | |
| MarketCap: 173.18 Millions | |
| Recent Price: 0.39 Smart Investing & Trading Score: 25 | |
| Day Percent Change: -1.28% Day Change: -0.01 | |
| Week Change: -8.64% Year-to-date Change: -31.3% | |
| KRKR Links: Profile News Message Board | |
| Charts:- Daily , Weekly | |
| Add KRKR to Watchlist: View: Get Complete KRKR Trend Analysis ➞ | |
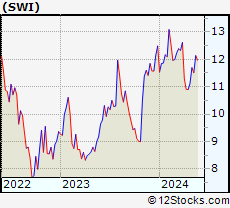 | SWI SolarWinds Corporation |
| Sector: Technology | |
| SubSector: Application Software | |
| MarketCap: 4524.62 Millions | |
| Recent Price: 11.58 Smart Investing & Trading Score: 25 | |
| Day Percent Change: -0.94% Day Change: -0.11 | |
| Week Change: -3.26% Year-to-date Change: -7.3% | |
| SWI Links: Profile News Message Board | |
| Charts:- Daily , Weekly | |
| Add SWI to Watchlist: View: Get Complete SWI Trend Analysis ➞ | |
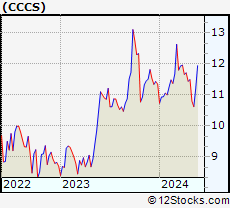 | CCCS CCC Intelligent Solutions Holdings Inc. |
| Sector: Technology | |
| SubSector: Software - Infrastructure | |
| MarketCap: 6990 Millions | |
| Recent Price: 11.18 Smart Investing & Trading Score: 25 | |
| Day Percent Change: -0.89% Day Change: -0.10 | |
| Week Change: -6.68% Year-to-date Change: -1.5% | |
| CCCS Links: Profile News Message Board | |
| Charts:- Daily , Weekly | |
| Add CCCS to Watchlist: View: Get Complete CCCS Trend Analysis ➞ | |
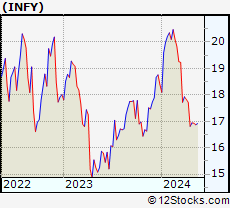 | INFY Infosys Limited |
| Sector: Technology | |
| SubSector: Information Technology Services | |
| MarketCap: 33819.1 Millions | |
| Recent Price: 16.75 Smart Investing & Trading Score: 25 | |
| Day Percent Change: -0.71% Day Change: -0.12 | |
| Week Change: -3.51% Year-to-date Change: -8.9% | |
| INFY Links: Profile News Message Board | |
| Charts:- Daily , Weekly | |
| Add INFY to Watchlist: View: Get Complete INFY Trend Analysis ➞ | |
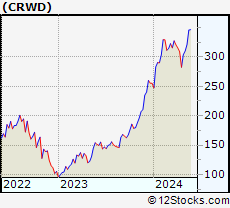 | CRWD CrowdStrike Holdings, Inc. |
| Sector: Technology | |
| SubSector: Security Software & Services | |
| MarketCap: 11803.6 Millions | |
| Recent Price: 313.67 Smart Investing & Trading Score: 25 | |
| Day Percent Change: -0.71% Day Change: -2.25 | |
| Week Change: -10.75% Year-to-date Change: 22.9% | |
| CRWD Links: Profile News Message Board | |
| Charts:- Daily , Weekly | |
| Add CRWD to Watchlist: View: Get Complete CRWD Trend Analysis ➞ | |
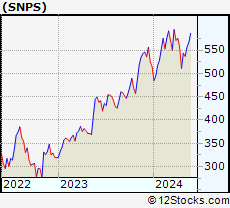 | SNPS Synopsys, Inc. |
| Sector: Technology | |
| SubSector: Semiconductor Equipment & Materials | |
| MarketCap: 18273.8 Millions | |
| Recent Price: 560.80 Smart Investing & Trading Score: 25 | |
| Day Percent Change: -0.70% Day Change: -3.93 | |
| Week Change: -4.53% Year-to-date Change: 8.9% | |
| SNPS Links: Profile News Message Board | |
| Charts:- Daily , Weekly | |
| Add SNPS to Watchlist: View: Get Complete SNPS Trend Analysis ➞ | |
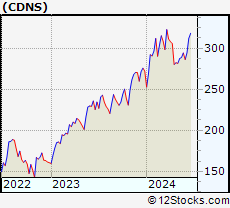 | CDNS Cadence Design Systems, Inc. |
| Sector: Technology | |
| SubSector: Application Software | |
| MarketCap: 16865.8 Millions | |
| Recent Price: 286.31 Smart Investing & Trading Score: 25 | |
| Day Percent Change: -0.67% Day Change: -1.94 | |
| Week Change: -2.71% Year-to-date Change: 5.1% | |
| CDNS Links: Profile News Message Board | |
| Charts:- Daily , Weekly | |
| Add CDNS to Watchlist: View: Get Complete CDNS Trend Analysis ➞ | |
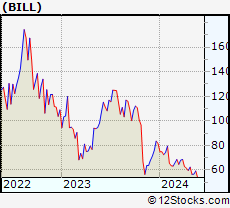 | BILL Bill.com Holdings, Inc. |
| Sector: Technology | |
| SubSector: Application Software | |
| MarketCap: 3068.42 Millions | |
| Recent Price: 52.05 Smart Investing & Trading Score: 25 | |
| Day Percent Change: 1.50% Day Change: 0.77 | |
| Week Change: -0.21% Year-to-date Change: -36.2% | |
| BILL Links: Profile News Message Board | |
| Charts:- Daily , Weekly | |
| Add BILL to Watchlist: View: Get Complete BILL Trend Analysis ➞ | |
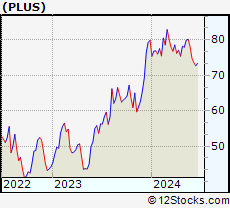 | PLUS ePlus inc. |
| Sector: Technology | |
| SubSector: Application Software | |
| MarketCap: 728.262 Millions | |
| Recent Price: 74.84 Smart Investing & Trading Score: 25 | |
| Day Percent Change: 1.19% Day Change: 0.88 | |
| Week Change: -4.27% Year-to-date Change: -6.3% | |
| PLUS Links: Profile News Message Board | |
| Charts:- Daily , Weekly | |
| Add PLUS to Watchlist: View: Get Complete PLUS Trend Analysis ➞ | |
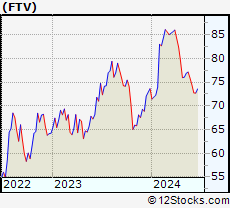 | FTV Fortive Corporation |
| Sector: Technology | |
| SubSector: Scientific & Technical Instruments | |
| MarketCap: 16351.9 Millions | |
| Recent Price: 74.44 Smart Investing & Trading Score: 25 | |
| Day Percent Change: 1.17% Day Change: 0.86 | |
| Week Change: -1.91% Year-to-date Change: 1.1% | |
| FTV Links: Profile News Message Board | |
| Charts:- Daily , Weekly | |
| Add FTV to Watchlist: View: Get Complete FTV Trend Analysis ➞ | |
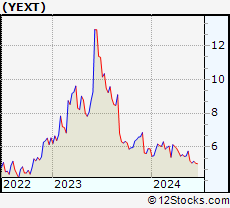 | YEXT Yext, Inc. |
| Sector: Technology | |
| SubSector: Internet Software & Services | |
| MarketCap: 1414.91 Millions | |
| Recent Price: 5.05 Smart Investing & Trading Score: 25 | |
| Day Percent Change: 1.00% Day Change: 0.05 | |
| Week Change: -2.13% Year-to-date Change: -14.3% | |
| YEXT Links: Profile News Message Board | |
| Charts:- Daily , Weekly | |
| Add YEXT to Watchlist: View: Get Complete YEXT Trend Analysis ➞ | |
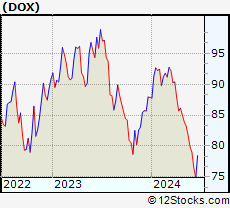 | DOX Amdocs Limited |
| Sector: Technology | |
| SubSector: Business Software & Services | |
| MarketCap: 6895.48 Millions | |
| Recent Price: 79.00 Smart Investing & Trading Score: 25 | |
| Day Percent Change: 0.92% Day Change: 0.72 | |
| Week Change: -1.14% Year-to-date Change: -10.1% | |
| DOX Links: Profile News Message Board | |
| Charts:- Daily , Weekly | |
| Add DOX to Watchlist: View: Get Complete DOX Trend Analysis ➞ | |
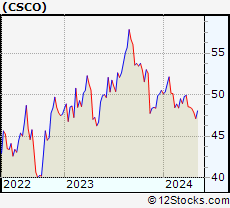 | CSCO Cisco Systems, Inc. |
| Sector: Technology | |
| SubSector: Communication Equipment | |
| MarketCap: 168483 Millions | |
| Recent Price: 46.50 Smart Investing & Trading Score: 25 | |
| Day Percent Change: 0.82% Day Change: 0.38 | |
| Week Change: 0.17% Year-to-date Change: -8.0% | |
| CSCO Links: Profile News Message Board | |
| Charts:- Daily , Weekly | |
| Add CSCO to Watchlist: View: Get Complete CSCO Trend Analysis ➞ | |
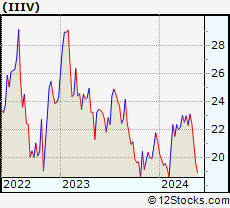 | IIIV i3 Verticals, Inc. |
| Sector: Technology | |
| SubSector: Business Software & Services | |
| MarketCap: 448.458 Millions | |
| Recent Price: 19.48 Smart Investing & Trading Score: 25 | |
| Day Percent Change: 0.46% Day Change: 0.09 | |
| Week Change: 2.69% Year-to-date Change: -8.0% | |
| IIIV Links: Profile News Message Board | |
| Charts:- Daily , Weekly | |
| Add IIIV to Watchlist: View: Get Complete IIIV Trend Analysis ➞ | |
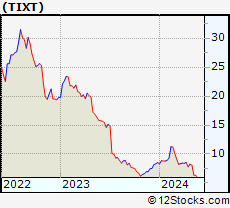 | TIXT TELUS International (Cda) Inc. |
| Sector: Technology | |
| SubSector: Software - Infrastructure | |
| MarketCap: 1470 Millions | |
| Recent Price: 5.73 Smart Investing & Trading Score: 25 | |
| Day Percent Change: 0.17% Day Change: 0.01 | |
| Week Change: -3.05% Year-to-date Change: -33.0% | |
| TIXT Links: Profile News Message Board | |
| Charts:- Daily , Weekly | |
| Add TIXT to Watchlist: View: Get Complete TIXT Trend Analysis ➞ | |
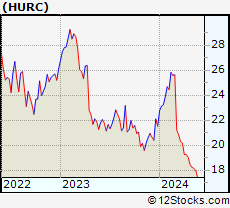 | HURC Hurco Companies, Inc. |
| Sector: Technology | |
| SubSector: Scientific & Technical Instruments | |
| MarketCap: 169.253 Millions | |
| Recent Price: 17.84 Smart Investing & Trading Score: 22 | |
| Day Percent Change: -0.89% Day Change: -0.16 | |
| Week Change: 2.65% Year-to-date Change: -17.1% | |
| HURC Links: Profile News Message Board | |
| Charts:- Daily , Weekly | |
| Add HURC to Watchlist: View: Get Complete HURC Trend Analysis ➞ | |
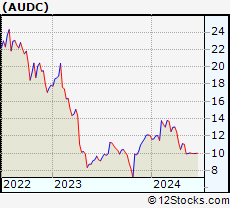 | AUDC AudioCodes Ltd. |
| Sector: Technology | |
| SubSector: Communication Equipment | |
| MarketCap: 642.239 Millions | |
| Recent Price: 9.99 Smart Investing & Trading Score: 22 | |
| Day Percent Change: -0.10% Day Change: -0.01 | |
| Week Change: -0.5% Year-to-date Change: -17.2% | |
| AUDC Links: Profile News Message Board | |
| Charts:- Daily , Weekly | |
| Add AUDC to Watchlist: View: Get Complete AUDC Trend Analysis ➞ | |
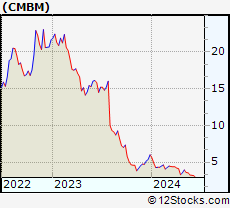 | CMBM Cambium Networks Corporation |
| Sector: Technology | |
| SubSector: Communication Equipment | |
| MarketCap: 143.739 Millions | |
| Recent Price: 3.21 Smart Investing & Trading Score: 20 | |
| Day Percent Change: 5.25% Day Change: 0.16 | |
| Week Change: -0.93% Year-to-date Change: -46.5% | |
| CMBM Links: Profile News Message Board | |
| Charts:- Daily , Weekly | |
| Add CMBM to Watchlist: View: Get Complete CMBM Trend Analysis ➞ | |
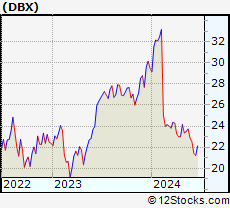 | DBX Dropbox, Inc. |
| Sector: Technology | |
| SubSector: Application Software | |
| MarketCap: 7588.32 Millions | |
| Recent Price: 22.53 Smart Investing & Trading Score: 20 | |
| Day Percent Change: 0.85% Day Change: 0.19 | |
| Week Change: -1.57% Year-to-date Change: -23.6% | |
| DBX Links: Profile News Message Board | |
| Charts:- Daily , Weekly | |
| Add DBX to Watchlist: View: Get Complete DBX Trend Analysis ➞ | |
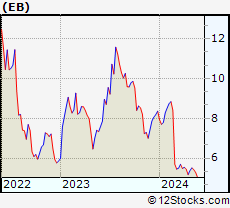 | EB Eventbrite, Inc. |
| Sector: Technology | |
| SubSector: Application Software | |
| MarketCap: 805.262 Millions | |
| Recent Price: 4.98 Smart Investing & Trading Score: 20 | |
| Day Percent Change: 0.81% Day Change: 0.04 | |
| Week Change: -0.2% Year-to-date Change: -40.4% | |
| EB Links: Profile News Message Board | |
| Charts:- Daily , Weekly | |
| Add EB to Watchlist: View: Get Complete EB Trend Analysis ➞ | |
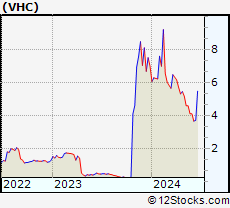 | VHC VirnetX Holding Corp |
| Sector: Technology | |
| SubSector: Internet Software & Services | |
| MarketCap: 352.791 Millions | |
| Recent Price: 4.12 Smart Investing & Trading Score: 20 | |
| Day Percent Change: 0.49% Day Change: 0.02 | |
| Week Change: -0.24% Year-to-date Change: -41.1% | |
| VHC Links: Profile News Message Board | |
| Charts:- Daily , Weekly | |
| Add VHC to Watchlist: View: Get Complete VHC Trend Analysis ➞ | |
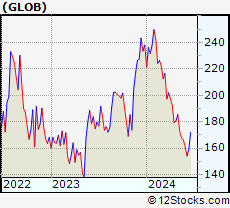 | GLOB Globant S.A. |
| Sector: Technology | |
| SubSector: Information Technology Services | |
| MarketCap: 2976.88 Millions | |
| Recent Price: 161.12 Smart Investing & Trading Score: 20 | |
| Day Percent Change: 0.46% Day Change: 0.74 | |
| Week Change: -3.23% Year-to-date Change: -32.3% | |
| GLOB Links: Profile News Message Board | |
| Charts:- Daily , Weekly | |
| Add GLOB to Watchlist: View: Get Complete GLOB Trend Analysis ➞ | |
| For tabular summary view of above stock list: Summary View ➞ 0 - 25 , 25 - 50 , 50 - 75 , 75 - 100 , 100 - 125 , 125 - 150 , 150 - 175 , 175 - 200 , 200 - 225 , 225 - 250 , 250 - 275 , 275 - 300 , 300 - 325 , 325 - 350 , 350 - 375 , 375 - 400 , 400 - 425 , 425 - 450 , 450 - 475 , 475 - 500 , 500 - 525 , 525 - 550 , 550 - 575 , 575 - 600 , 600 - 625 , 625 - 650 | ||
| Click To Change The Sort Order: By Market Cap or Company Size Performance: Year-to-date, Week and Day | |
| Select Chart Type: | ||
|
Best Stocks Today 12Stocks.com |
© 2024 12Stocks.com Terms & Conditions Privacy Contact Us
All Information Provided Only For Education And Not To Be Used For Investing or Trading. See Terms & Conditions


One More Thing ... Get Best Stocks Delivered Daily!
Never Ever Miss A Move With Our Top Ten Stocks Lists
Find Best Stocks In Any Market - Bull or Bear Market
Take A Peek At Our Top Ten Stocks Lists: Daily, Weekly, Year-to-Date & Top Trends
Find Best Stocks In Any Market - Bull or Bear Market
Take A Peek At Our Top Ten Stocks Lists: Daily, Weekly, Year-to-Date & Top Trends
Technology Stocks With Best Up Trends [0-bearish to 100-bullish]: Ambarella [100], Phoenix New[100], United States[100], Arbe Robotics[100], Turkcell Iletisim[100], Infinera [100], EchoStar [100], AT&T [100], Tigo Energy[100], NetApp [100], Shenandoah Tele[100]
Best Technology Stocks Year-to-Date:
MicroCloud Hologram[317.27%], Uxin [249.49%], Super Micro[175.98%], Cheetah Mobile[163.6%], Smith Micro[162.11%], MediaCo Holding[151.17%], MicroStrategy [141.36%], SoundHound AI[135.98%], NVIDIA [121.38%], Phoenix New[110.29%], AppLovin [104.75%] Best Technology Stocks This Week:
Phoenix New[55.43%], Credo [30.55%], United States[29.04%], CommScope Holding[24.14%], Ambarella [16.24%], uCloudlink [15.43%], D-Wave Quantum[15.38%], Sequans [14.87%], Arlo [14.69%], Arbe Robotics[14.61%], Telos [14.54%] Best Technology Stocks Daily:
Ambarella [20.60%], Phoenix New[14.40%], Akoustis [12.04%], Elastic N.V[11.67%], Cogint [9.88%], United States[9.35%], Telephone and[8.69%], Zscaler [8.50%], AMTD Digital[7.77%], salesforce.com [7.54%], FTC Solar[6.96%]