
 Login Sign Up


| |||||
 |  | ||||

| 12Stocks.com Market Intelligence |
Best S&P 500 Stocks
|
On this page, you will find the most comprehensive analysis of S&P 500 stocks and ETFs - from latest trends to performances to charts ➞. First, here are the year-to-date (YTD) performances of the most requested S&P 500 stocks at 12Stocks.com (click stock for review):
| NVIDIA 121% | ||
| Walmart 25% | ||
| Google 23% | ||
| JPMorgan Chase 19% | ||
| Goldman Sachs 18% | ||
| Amazon.com 16% | ||
| Merck 15% | ||
| Caterpillar 14% | ||
| Microsoft 10% | ||
| Chevron 9% | ||
| Apple -0% | ||
| Johnson & Johnson -6% | ||
| McDonald s -13% | ||
| Starbucks -16% | ||
| Gilead -21% | ||
| Boeing -32% | ||
| Intel -39% | ||
| Quick: S&P 500 Stocks Lists: Performances & Trends, S&P 500 Stock Charts
Sort S&P 500 stocks: Daily, Weekly, Year-to-Date, Market Cap & Trends. Filter S&P 500 stocks list by sector: Show all, Tech, Finance, Energy, Staples, Retail, Industrial, Materials, Utilities and HealthCare |
| 12Stocks.com S&P 500 Stocks Performances & Trends Daily Report | |||||||||
|
| 
The overall Smart Investing & Trading Score is 76 (0-bearish to 100-bullish) which puts S&P 500 index in short term neutral to bullish trend. The Smart Investing & Trading Score from previous trading session is 56 and hence an improvement of trend. | ||||||||
Here are the Smart Investing & Trading Scores of the most requested S&P 500 stocks at 12Stocks.com (click stock name for detailed review):
|


| 12Stocks.com: Top Performing S&P 500 Index Stocks | ||||||||||||||||||||||||||||||||||||||||||||||||
 The top performing S&P 500 Index stocks year to date are
Now, more recently, over last week, the top performing S&P 500 Index stocks on the move are


|
||||||||||||||||||||||||||||||||||||||||||||||||
| 12Stocks.com: Investing in S&P 500 Index with Stocks | |
|
The following table helps investors and traders sort through current performance and trends (as measured by Smart Investing & Trading Score) of various
stocks in the S&P 500 Index. Quick View: Move mouse or cursor over stock symbol (ticker) to view short-term technical chart and over stock name to view long term chart. Click on  to add stock symbol to your watchlist and to add stock symbol to your watchlist and  to view watchlist. Click on any ticker or stock name for detailed market intelligence report for that stock. to view watchlist. Click on any ticker or stock name for detailed market intelligence report for that stock. |
12Stocks.com Performance of Stocks in S&P 500 Index
| Ticker | Stock Name | Watchlist | Category | Recent Price | Smart Investing & Trading Score | Change % | YTD Change% |
| AVGO | Broadcom |   | Technology | 1328.55 | 41 | -2.60% | 19.02% |
| IFF | Flavors | | Materials | 96.18 | 83 | 0.67% | 18.78% |
| BAC | Bank of America | | Financials | 39.99 | 100 | 3.52% | 18.77% |
| NXPI | NXP Semiconductors | | Technology | 272.10 | 68 | 0.25% | 18.47% |
| GS | Goldman Sachs | | Financials | 456.52 | 76 | 1.40% | 18.34% |
| HUBB | Hubbell | | Technology | 388.89 | 41 | -0.46% | 18.23% |
| TPR | Tapestry | | Consumer Staples | 43.49 | 74 | 2.69% | 18.15% |
| ADI | Analog Devices | | Technology | 234.49 | 83 | 1.95% | 18.10% |
| MHK | Mohawk Industries | | Consumer Staples | 121.93 | 85 | 2.80% | 17.81% |
| WM | Waste Management | | Industrials | 210.73 | 78 | 2.17% | 17.66% |
| CMI | Cummins | | Industrials | 281.73 | 63 | 0.94% | 17.60% |
| XOM | Exxon Mobil | | Energy | 117.26 | 68 | 2.87% | 17.28% |
| HAS | Hasbro | | Consumer Staples | 59.78 | 43 | -0.86% | 17.08% |
| ECL | Ecolab | | Materials | 232.20 | 78 | 1.53% | 17.07% |
| URI | United Rentals | | Transports | 669.41 | 25 | 1.54% | 16.74% |
| CTVA | Corteva | | Materials | 55.94 | 68 | 1.27% | 16.74% |
| CL | Colgate-Palmolive | | Consumer Staples | 92.96 | 68 | 2.23% | 16.62% |
| MPWR | Monolithic Power | | Technology | 735.63 | 61 | -1.11% | 16.62% |
| MSI | Motorola Solutions | | Technology | 364.91 | 83 | 1.45% | 16.55% |
| AIG | American | | Financials | 78.82 | 68 | 0.73% | 16.34% |
| AMZN | Amazon.com | | Services & Goods | 176.44 | 13 | -1.61% | 16.12% |
| PRU | Prudential Financial | | Financials | 120.35 | 100 | 1.53% | 16.04% |
| FOXA | Fox | | Services & Goods | 34.43 | 100 | 0.47% | 16.04% |
| MTD | Mettler-Toledo | | Health Care | 1404.09 | 51 | 1.48% | 15.76% |
| FOX | Twenty-First Century | | Services & Goods | 31.94 | 100 | 0.73% | 15.52% |
| For chart view version of above stock list: Chart View ➞ 0 - 25 , 25 - 50 , 50 - 75 , 75 - 100 , 100 - 125 , 125 - 150 , 150 - 175 , 175 - 200 , 200 - 225 , 225 - 250 , 250 - 275 , 275 - 300 , 300 - 325 , 325 - 350 , 350 - 375 , 375 - 400 , 400 - 425 , 425 - 450 , 450 - 475 , 475 - 500 | ||
 | Click To Change The Sort Order: By Market Cap or Company Size Performance: Year-to-date, Week and Day |  |
|
Get the most comprehensive stock market coverage daily at 12Stocks.com ➞ Best Stocks Today ➞ Best Stocks Weekly ➞ Best Stocks Year-to-Date ➞ Best Stocks Trends ➞  Best Stocks Today 12Stocks.com Best Nasdaq Stocks ➞ Best S&P 500 Stocks ➞ Best Tech Stocks ➞ Best Biotech Stocks ➞ |
| Detailed Overview of S&P 500 Stocks |
| S&P 500 Technical Overview, Leaders & Laggards, Top S&P 500 ETF Funds & Detailed S&P 500 Stocks List, Charts, Trends & More |
| S&P 500: Technical Analysis, Trends & YTD Performance | |
| S&P 500 index as represented by
SPY, an exchange-traded fund [ETF], holds basket of five hundred (mostly largecap) stocks from across all major sectors of the US stock market. The S&P 500 index (contains stocks like Apple and Exxon) is up by 10.95% and is currently outperforming the overall market by 1.16% year-to-date. Below is a quick view of technical charts and trends: | |
 SPY Weekly Chart |
|
| Long Term Trend: Very Good | |
| Medium Term Trend: Very Good | |
 SPY Daily Chart |
|
| Short Term Trend: Not Good | |
| Overall Trend Score: 76 | |
| YTD Performance: 10.95% | |
| **Trend Scores & Views Are Only For Educational Purposes And Not For Investing | |
| 12Stocks.com: Investing in S&P 500 Index using Exchange Traded Funds | |
|
The following table shows list of key exchange traded funds (ETF) that
help investors track S&P 500 index. The following list also includes leveraged ETF funds that track twice or thrice the daily returns of S&P 500 indices. Short or inverse ETF funds move in the opposite direction to the index they track and are useful during market pullbacks or during bear markets. Quick View: Move mouse or cursor over ETF symbol (ticker) to view short-term technical chart and over ETF name to view long term chart. Click on ticker or stock name for detailed view. Click on to add stock symbol to your watchlist and to view watchlist. |
12Stocks.com List of ETFs that track S&P 500 Index
| Ticker | ETF Name | Watchlist | Recent Price | Smart Investing & Trading Score | Change % | Week % | Year-to-date % |
| SPY | SPDR S&P 500 ETF | | 527.37 | 76 | 0.91 | -0.39 | 10.95% |
| IVV | iShares Core S&P 500 ETF | | 529.96 | 76 | 0.88 | -0.41 | 10.96% |
| VOO | Vanguard 500 ETF | | 484.00 | 76 | 0.74 | -0.56 | 10.81% |
| OEF | iShares S&P 100 | | 252.25 | 68 | 0.66 | -0.47 | 12.92% |
| SSO | ProShares Ultra S&P500 | | 77.67 | 63 | 1.76 | -0.97 | 19.36% |
| UPRO | ProShares UltraPro S&P500 | | 70.17 | 68 | 2.63 | -1.46 | 28.19% |
| SPXL | Direxion Daily S&P500 Bull 3X ETF | | 133.30 | 68 | 2.55 | -1.43 | 28.19% |
| SH | ProShares Short S&P500 | | 11.94 | 25 | -0.75 | 0.59 | -8.08% |
| SDS | ProShares UltraShort S&P500 | | 24.91 | 32 | -1.70 | 1.01 | -16.74% |
| SPXU | ProShares UltraPro Short S&P500 | | 32.21 | 32 | -2.54 | 1.51 | -25.09% |
| SPXS | Direxion Daily S&P 500 Bear 3X ETF | | 8.72 | 32 | -2.46 | 1.4 | -24.5% |
| 12Stocks.com: Charts, Trends, Fundamental Data and Performances of S&P 500 Stocks | |
|
We now take in-depth look at all S&P 500 stocks including charts, multi-period performances and overall trends (as measured by Smart Investing & Trading Score). One can sort S&P 500 stocks (click link to choose) by Daily, Weekly and by Year-to-Date performances. Also, one can sort by size of the company or by market capitalization. |
| Select Your Default Chart Type: | |||||
| |||||
| Click on stock symbol or name for detailed view. Click on to add stock symbol to your watchlist and to view watchlist. Quick View: Move mouse or cursor over "Daily" to quickly view daily technical stock chart and over "Weekly" to view weekly technical stock chart. | |||||

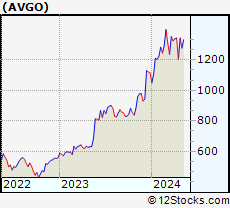 | AVGO Broadcom Inc. |
| Sector: Technology | |
| SubSector: Semiconductor - Broad Line | |
| MarketCap: 86329.1 Millions | |
| Recent Price: 1328.55 Smart Investing & Trading Score: 41 | |
| Day Percent Change: -2.60% Day Change: -35.53 | |
| Week Change: -5.63% Year-to-date Change: 19.0% | |
| AVGO Links: Profile News Message Board | |
| Charts:- Daily , Weekly | |
| Add AVGO to Watchlist: View: Get AVGO Trend Analysis ➞ | |
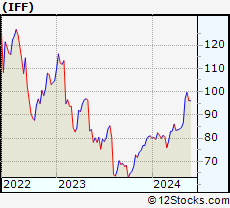 | IFF International Flavors & Fragrances Inc. |
| Sector: Materials | |
| SubSector: Specialty Chemicals | |
| MarketCap: 12178.7 Millions | |
| Recent Price: 96.18 Smart Investing & Trading Score: 83 | |
| Day Percent Change: 0.67% Day Change: 0.64 | |
| Week Change: 0.04% Year-to-date Change: 18.8% | |
| IFF Links: Profile News Message Board | |
| Charts:- Daily , Weekly | |
| Add IFF to Watchlist: View: Get IFF Trend Analysis ➞ | |
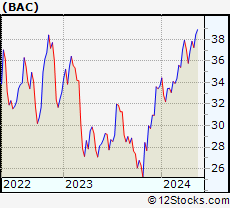 | BAC Bank of America Corporation |
| Sector: Financials | |
| SubSector: Money Center Banks | |
| MarketCap: 189690 Millions | |
| Recent Price: 39.99 Smart Investing & Trading Score: 100 | |
| Day Percent Change: 3.52% Day Change: 1.36 | |
| Week Change: 0.73% Year-to-date Change: 18.8% | |
| BAC Links: Profile News Message Board | |
| Charts:- Daily , Weekly | |
| Add BAC to Watchlist: View: Get BAC Trend Analysis ➞ | |
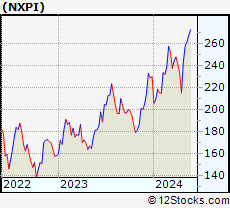 | NXPI NXP Semiconductors N.V. |
| Sector: Technology | |
| SubSector: Semiconductor - Broad Line | |
| MarketCap: 22497.9 Millions | |
| Recent Price: 272.10 Smart Investing & Trading Score: 68 | |
| Day Percent Change: 0.25% Day Change: 0.67 | |
| Week Change: -1.83% Year-to-date Change: 18.5% | |
| NXPI Links: Profile News Message Board | |
| Charts:- Daily , Weekly | |
| Add NXPI to Watchlist: View: Get NXPI Trend Analysis ➞ | |
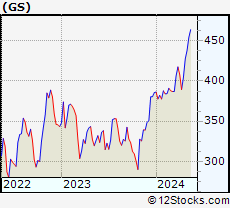 | GS The Goldman Sachs Group, Inc. |
| Sector: Financials | |
| SubSector: Investment Brokerage - National | |
| MarketCap: 54579.3 Millions | |
| Recent Price: 456.52 Smart Investing & Trading Score: 76 | |
| Day Percent Change: 1.40% Day Change: 6.29 | |
| Week Change: -1.01% Year-to-date Change: 18.3% | |
| GS Links: Profile News Message Board | |
| Charts:- Daily , Weekly | |
| Add GS to Watchlist: View: Get GS Trend Analysis ➞ | |
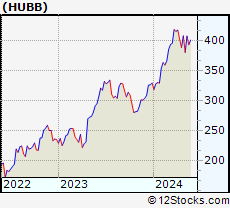 | HUBB Hubbell Incorporated |
| Sector: Technology | |
| SubSector: Diversified Electronics | |
| MarketCap: 6002.46 Millions | |
| Recent Price: 388.89 Smart Investing & Trading Score: 41 | |
| Day Percent Change: -0.46% Day Change: -1.79 | |
| Week Change: -5.84% Year-to-date Change: 18.2% | |
| HUBB Links: Profile News Message Board | |
| Charts:- Daily , Weekly | |
| Add HUBB to Watchlist: View: Get HUBB Trend Analysis ➞ | |
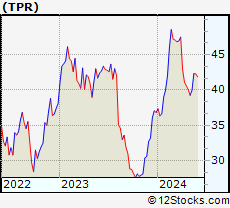 | TPR Tapestry, Inc. |
| Sector: Consumer Staples | |
| SubSector: Textile - Apparel Footwear & Accessories | |
| MarketCap: 3890.1 Millions | |
| Recent Price: 43.49 Smart Investing & Trading Score: 74 | |
| Day Percent Change: 2.69% Day Change: 1.14 | |
| Week Change: 2.81% Year-to-date Change: 18.2% | |
| TPR Links: Profile News Message Board | |
| Charts:- Daily , Weekly | |
| Add TPR to Watchlist: View: Get TPR Trend Analysis ➞ | |
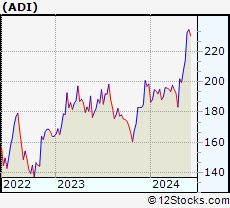 | ADI Analog Devices, Inc. |
| Sector: Technology | |
| SubSector: Semiconductor - Integrated Circuits | |
| MarketCap: 32859 Millions | |
| Recent Price: 234.49 Smart Investing & Trading Score: 83 | |
| Day Percent Change: 1.95% Day Change: 4.49 | |
| Week Change: 0.85% Year-to-date Change: 18.1% | |
| ADI Links: Profile News Message Board | |
| Charts:- Daily , Weekly | |
| Add ADI to Watchlist: View: Get ADI Trend Analysis ➞ | |
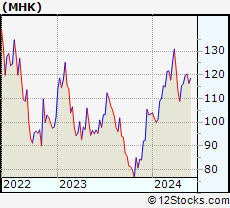 | MHK Mohawk Industries, Inc. |
| Sector: Consumer Staples | |
| SubSector: Home Furnishings & Fixtures | |
| MarketCap: 4682.25 Millions | |
| Recent Price: 121.93 Smart Investing & Trading Score: 85 | |
| Day Percent Change: 2.80% Day Change: 3.32 | |
| Week Change: 4.72% Year-to-date Change: 17.8% | |
| MHK Links: Profile News Message Board | |
| Charts:- Daily , Weekly | |
| Add MHK to Watchlist: View: Get MHK Trend Analysis ➞ | |
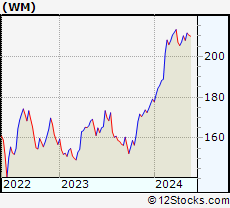 | WM Waste Management, Inc. |
| Sector: Industrials | |
| SubSector: Waste Management | |
| MarketCap: 46977.4 Millions | |
| Recent Price: 210.73 Smart Investing & Trading Score: 78 | |
| Day Percent Change: 2.17% Day Change: 4.48 | |
| Week Change: 0.92% Year-to-date Change: 17.7% | |
| WM Links: Profile News Message Board | |
| Charts:- Daily , Weekly | |
| Add WM to Watchlist: View: Get WM Trend Analysis ➞ | |
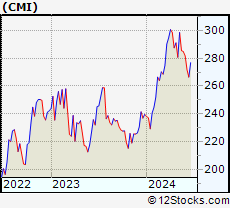 | CMI Cummins Inc. |
| Sector: Industrials | |
| SubSector: Diversified Machinery | |
| MarketCap: 19127.1 Millions | |
| Recent Price: 281.73 Smart Investing & Trading Score: 63 | |
| Day Percent Change: 0.94% Day Change: 2.61 | |
| Week Change: -1.12% Year-to-date Change: 17.6% | |
| CMI Links: Profile News Message Board | |
| Charts:- Daily , Weekly | |
| Add CMI to Watchlist: View: Get CMI Trend Analysis ➞ | |
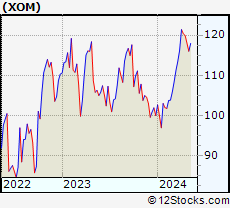 | XOM Exxon Mobil Corporation |
| Sector: Energy | |
| SubSector: Major Integrated Oil & Gas | |
| MarketCap: 156450 Millions | |
| Recent Price: 117.26 Smart Investing & Trading Score: 68 | |
| Day Percent Change: 2.87% Day Change: 3.27 | |
| Week Change: 3.39% Year-to-date Change: 17.3% | |
| XOM Links: Profile News Message Board | |
| Charts:- Daily , Weekly | |
| Add XOM to Watchlist: View: Get XOM Trend Analysis ➞ | |
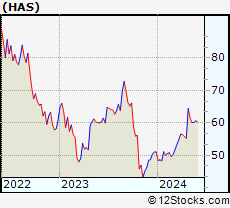 | HAS Hasbro, Inc. |
| Sector: Consumer Staples | |
| SubSector: Toys & Games | |
| MarketCap: 7389.5 Millions | |
| Recent Price: 59.78 Smart Investing & Trading Score: 43 | |
| Day Percent Change: -0.86% Day Change: -0.52 | |
| Week Change: -1.45% Year-to-date Change: 17.1% | |
| HAS Links: Profile News Message Board | |
| Charts:- Daily , Weekly | |
| Add HAS to Watchlist: View: Get HAS Trend Analysis ➞ | |
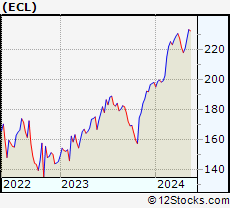 | ECL Ecolab Inc. |
| Sector: Materials | |
| SubSector: Specialty Chemicals | |
| MarketCap: 46215.9 Millions | |
| Recent Price: 232.20 Smart Investing & Trading Score: 78 | |
| Day Percent Change: 1.53% Day Change: 3.50 | |
| Week Change: -0.9% Year-to-date Change: 17.1% | |
| ECL Links: Profile News Message Board | |
| Charts:- Daily , Weekly | |
| Add ECL to Watchlist: View: Get ECL Trend Analysis ➞ | |
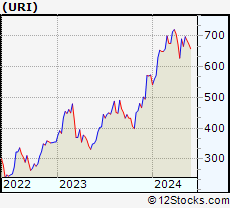 | URI United Rentals, Inc. |
| Sector: Transports | |
| SubSector: Rental & Leasing Services | |
| MarketCap: 6246.64 Millions | |
| Recent Price: 669.41 Smart Investing & Trading Score: 25 | |
| Day Percent Change: 1.54% Day Change: 10.18 | |
| Week Change: -0.61% Year-to-date Change: 16.7% | |
| URI Links: Profile News Message Board | |
| Charts:- Daily , Weekly | |
| Add URI to Watchlist: View: Get URI Trend Analysis ➞ | |
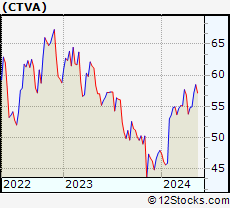 | CTVA Corteva, Inc. |
| Sector: Materials | |
| SubSector: Agricultural Chemicals | |
| MarketCap: 18894.3 Millions | |
| Recent Price: 55.94 Smart Investing & Trading Score: 68 | |
| Day Percent Change: 1.27% Day Change: 0.70 | |
| Week Change: 0.77% Year-to-date Change: 16.7% | |
| CTVA Links: Profile News Message Board | |
| Charts:- Daily , Weekly | |
| Add CTVA to Watchlist: View: Get CTVA Trend Analysis ➞ | |
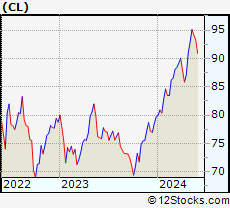 | CL Colgate-Palmolive Company |
| Sector: Consumer Staples | |
| SubSector: Personal Products | |
| MarketCap: 57242.7 Millions | |
| Recent Price: 92.96 Smart Investing & Trading Score: 68 | |
| Day Percent Change: 2.23% Day Change: 2.03 | |
| Week Change: -0.36% Year-to-date Change: 16.6% | |
| CL Links: Profile News Message Board | |
| Charts:- Daily , Weekly | |
| Add CL to Watchlist: View: Get CL Trend Analysis ➞ | |
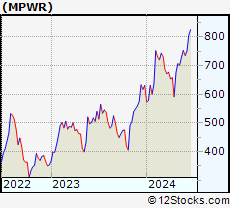 | MPWR Monolithic Power Systems, Inc. |
| Sector: Technology | |
| SubSector: Semiconductor - Specialized | |
| MarketCap: 6436.4 Millions | |
| Recent Price: 735.63 Smart Investing & Trading Score: 61 | |
| Day Percent Change: -1.11% Day Change: -8.27 | |
| Week Change: -2.36% Year-to-date Change: 16.6% | |
| MPWR Links: Profile News Message Board | |
| Charts:- Daily , Weekly | |
| Add MPWR to Watchlist: View: Get MPWR Trend Analysis ➞ | |
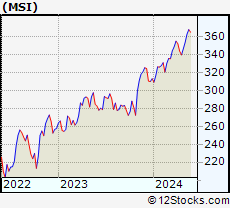 | MSI Motorola Solutions, Inc. |
| Sector: Technology | |
| SubSector: Communication Equipment | |
| MarketCap: 26573.3 Millions | |
| Recent Price: 364.91 Smart Investing & Trading Score: 83 | |
| Day Percent Change: 1.45% Day Change: 5.22 | |
| Week Change: 0.09% Year-to-date Change: 16.6% | |
| MSI Links: Profile News Message Board | |
| Charts:- Daily , Weekly | |
| Add MSI to Watchlist: View: Get MSI Trend Analysis ➞ | |
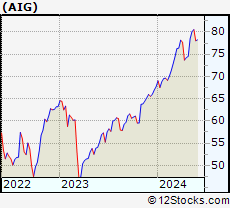 | AIG American International Group, Inc. |
| Sector: Financials | |
| SubSector: Property & Casualty Insurance | |
| MarketCap: 21219 Millions | |
| Recent Price: 78.82 Smart Investing & Trading Score: 68 | |
| Day Percent Change: 0.73% Day Change: 0.57 | |
| Week Change: 1.01% Year-to-date Change: 16.3% | |
| AIG Links: Profile News Message Board | |
| Charts:- Daily , Weekly | |
| Add AIG to Watchlist: View: Get AIG Trend Analysis ➞ | |
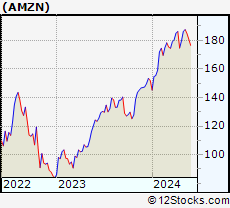 | AMZN Amazon.com, Inc. |
| Sector: Services & Goods | |
| SubSector: Catalog & Mail Order Houses | |
| MarketCap: 998070 Millions | |
| Recent Price: 176.44 Smart Investing & Trading Score: 13 | |
| Day Percent Change: -1.61% Day Change: -2.88 | |
| Week Change: -2.38% Year-to-date Change: 16.1% | |
| AMZN Links: Profile News Message Board | |
| Charts:- Daily , Weekly | |
| Add AMZN to Watchlist: View: Get AMZN Trend Analysis ➞ | |
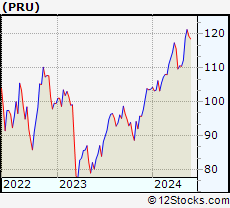 | PRU Prudential Financial, Inc. |
| Sector: Financials | |
| SubSector: Life Insurance | |
| MarketCap: 21001.6 Millions | |
| Recent Price: 120.35 Smart Investing & Trading Score: 100 | |
| Day Percent Change: 1.53% Day Change: 1.81 | |
| Week Change: 0.83% Year-to-date Change: 16.0% | |
| PRU Links: Profile News Message Board | |
| Charts:- Daily , Weekly | |
| Add PRU to Watchlist: View: Get PRU Trend Analysis ➞ | |
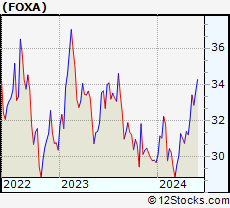 | FOXA Fox Corporation |
| Sector: Services & Goods | |
| SubSector: Entertainment - Diversified | |
| MarketCap: 13440.7 Millions | |
| Recent Price: 34.43 Smart Investing & Trading Score: 100 | |
| Day Percent Change: 0.47% Day Change: 0.16 | |
| Week Change: 2.44% Year-to-date Change: 16.0% | |
| FOXA Links: Profile News Message Board | |
| Charts:- Daily , Weekly | |
| Add FOXA to Watchlist: View: Get FOXA Trend Analysis ➞ | |
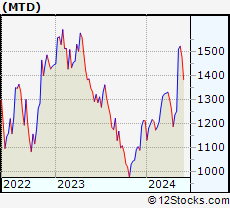 | MTD Mettler-Toledo International Inc. |
| Sector: Health Care | |
| SubSector: Medical Instruments & Supplies | |
| MarketCap: 15973.1 Millions | |
| Recent Price: 1404.09 Smart Investing & Trading Score: 51 | |
| Day Percent Change: 1.48% Day Change: 20.52 | |
| Week Change: -5.1% Year-to-date Change: 15.8% | |
| MTD Links: Profile News Message Board | |
| Charts:- Daily , Weekly | |
| Add MTD to Watchlist: View: Get MTD Trend Analysis ➞ | |
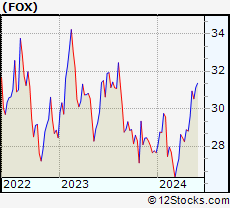 | FOX Twenty-First Century Fox, Inc. |
| Sector: Services & Goods | |
| SubSector: Entertainment - Diversified | |
| MarketCap: 24211.2 Millions | |
| Recent Price: 31.94 Smart Investing & Trading Score: 100 | |
| Day Percent Change: 0.73% Day Change: 0.23 | |
| Week Change: 2.6% Year-to-date Change: 15.5% | |
| FOX Links: Profile News Message Board | |
| Charts:- Daily , Weekly | |
| Add FOX to Watchlist: View: Get FOX Trend Analysis ➞ | |
| For tabular summary view of above stock list: Summary View ➞ 0 - 25 , 25 - 50 , 50 - 75 , 75 - 100 , 100 - 125 , 125 - 150 , 150 - 175 , 175 - 200 , 200 - 225 , 225 - 250 , 250 - 275 , 275 - 300 , 300 - 325 , 325 - 350 , 350 - 375 , 375 - 400 , 400 - 425 , 425 - 450 , 450 - 475 , 475 - 500 | ||
| Click To Change The Sort Order: By Market Cap or Company Size Performance: Year-to-date, Week and Day | |
| Select Chart Type: | ||
|
Best Stocks Today 12Stocks.com |
© 2024 12Stocks.com Terms & Conditions Privacy Contact Us
All Information Provided Only For Education And Not To Be Used For Investing or Trading. See Terms & Conditions


One More Thing ... Get Best Stocks Delivered Daily!
Never Ever Miss A Move With Our Top Ten Stocks Lists
Find Best Stocks In Any Market - Bull or Bear Market
Take A Peek At Our Top Ten Stocks Lists: Daily, Weekly, Year-to-Date & Top Trends
Find Best Stocks In Any Market - Bull or Bear Market
Take A Peek At Our Top Ten Stocks Lists: Daily, Weekly, Year-to-Date & Top Trends
S&P 500 Stocks With Best Up Trends [0-bearish to 100-bullish]: Best Buy[100], Bank of America[100], AT&T [100], NetApp [100], Humana [100], Edison [100], Otis Worldwide[100], CenterPoint [100], Ventas [100], T-Mobile US[100], NextEra [100]
Best S&P 500 Stocks Year-to-Date:
NVIDIA [121.38%], Constellation [85.51%], First Solar[57.74%], NRG [56.67%], Micron [46.47%], Western Digital[43.77%], Moderna [43.34%], QUALCOMM [41.08%], Eli Lilly[40.73%], DaVita [40.44%], Eaton [38.22%] Best S&P 500 Stocks This Week:
Best Buy[18.63%], Marathon Oil[13.3%], HP [11.45%], Ralph Lauren[7.74%], V.F [7.62%], Universal Health[7.61%], Target [7.53%], Whirlpool [7.52%], CVS Health[7.31%], HCA Healthcare[6.6%], DaVita [6.19%] Best S&P 500 Stocks Daily:
Caesars Entertainment[11.65%], V.F [7.70%], salesforce.com [7.54%], Dollar General[7.01%], CVS Health[6.35%], Walgreens Boots[5.39%], Cooper [4.52%], Entergy [4.37%], Boston Properties[4.26%], MGM Resorts[4.26%], Target [4.20%]