
 Login Sign Up


| |||||
 |  | ||||

| 12Stocks.com Market Intelligence |
Best S&P 500 Stocks
|
On this page, you will find the most comprehensive analysis of S&P 500 stocks and ETFs - from latest trends to performances to charts ➞. First, here are the year-to-date (YTD) performances of the most requested S&P 500 stocks at 12Stocks.com (click stock for review):
| NVIDIA 121% | ||
| Walmart 25% | ||
| Google 23% | ||
| JPMorgan Chase 19% | ||
| Goldman Sachs 18% | ||
| Amazon.com 16% | ||
| Merck 15% | ||
| Caterpillar 14% | ||
| Microsoft 10% | ||
| Chevron 9% | ||
| Apple -0% | ||
| Johnson & Johnson -6% | ||
| McDonald s -13% | ||
| Starbucks -16% | ||
| Gilead -21% | ||
| Boeing -32% | ||
| Intel -39% | ||
| Quick: S&P 500 Stocks Lists: Performances & Trends, S&P 500 Stock Charts
Sort S&P 500 stocks: Daily, Weekly, Year-to-Date, Market Cap & Trends. Filter S&P 500 stocks list by sector: Show all, Tech, Finance, Energy, Staples, Retail, Industrial, Materials, Utilities and HealthCare |
| 12Stocks.com S&P 500 Stocks Performances & Trends Daily Report | |||||||||
|
| 
The overall Smart Investing & Trading Score is 76 (0-bearish to 100-bullish) which puts S&P 500 index in short term neutral to bullish trend. The Smart Investing & Trading Score from previous trading session is 56 and hence an improvement of trend. | ||||||||
Here are the Smart Investing & Trading Scores of the most requested S&P 500 stocks at 12Stocks.com (click stock name for detailed review):
|


| 12Stocks.com: Top Performing S&P 500 Index Stocks | ||||||||||||||||||||||||||||||||||||||||||||||||
 The top performing S&P 500 Index stocks year to date are
Now, more recently, over last week, the top performing S&P 500 Index stocks on the move are


|
||||||||||||||||||||||||||||||||||||||||||||||||
| 12Stocks.com: Investing in S&P 500 Index with Stocks | |
|
The following table helps investors and traders sort through current performance and trends (as measured by Smart Investing & Trading Score) of various
stocks in the S&P 500 Index. Quick View: Move mouse or cursor over stock symbol (ticker) to view short-term technical chart and over stock name to view long term chart. Click on  to add stock symbol to your watchlist and to add stock symbol to your watchlist and  to view watchlist. Click on any ticker or stock name for detailed market intelligence report for that stock. to view watchlist. Click on any ticker or stock name for detailed market intelligence report for that stock. |
12Stocks.com Performance of Stocks in S&P 500 Index
| Ticker | Stock Name | Watchlist | Category | Recent Price | Smart Investing & Trading Score | Change % | Weekly Change% |
| BMY | Bristol-Myers |   | Health Care | 41.09 | 32 | 2.09% | -0.36% |
| CL | Colgate-Palmolive | | Consumer Staples | 92.96 | 68 | 2.23% | -0.36% |
| SPY | SPDR S&P | | Utilities | 527.37 | 76 | 0.91% | -0.39% |
| CHRW | C.H. Robinson | | Transports | 86.37 | 93 | 1.74% | -0.40% |
| PSX | Phillips 66 | | Energy | 142.11 | 38 | 2.69% | -0.40% |
| EQIX | Equinix | | Financials | 762.98 | 25 | 0.31% | -0.41% |
| DFS | Discover Financial | | Financials | 122.66 | 56 | 1.28% | -0.45% |
| WFC | Wells Fargo | | Financials | 59.92 | 56 | 1.20% | -0.48% |
| PG | Procter & Gamble | | Consumer Staples | 164.54 | 68 | 1.21% | -0.48% |
| REGN | Regeneron | | Health Care | 980.16 | 86 | 1.06% | -0.49% |
| BKNG | Booking Holdings | | Services & Goods | 3776.35 | 78 | 0.58% | -0.50% |
| RCL | Royal Caribbean | | Services & Goods | 147.68 | 63 | 0.13% | -0.51% |
| TDG | TransDigm | | Industrials | 1343.23 | 100 | 1.62% | -0.52% |
| CE | Celanese | | Materials | 152.04 | 38 | 0.48% | -0.54% |
| FFIV | F5 Networks | | Technology | 168.97 | 50 | 1.00% | -0.55% |
| WY | Weyerhaeuser | | Industrials | 30.03 | 32 | 1.04% | -0.56% |
| JBL | Jabil | | Technology | 118.90 | 45 | -0.27% | -0.59% |
| COO | Cooper | | Health Care | 94.31 | 75 | 4.52% | -0.61% |
| URI | United Rentals | | Transports | 669.41 | 25 | 1.54% | -0.61% |
| ALLE | Allegion | | Services & Goods | 121.82 | 32 | 1.14% | -0.64% |
| TSLA | Tesla | | Consumer Staples | 178.08 | 57 | -0.40% | -0.65% |
| COP | ConocoPhillips | | Energy | 116.48 | 43 | 2.55% | -0.66% |
| ISRG | Intuitive Surgical | | Health Care | 402.12 | 71 | -0.31% | -0.67% |
| MPC | Marathon | | Energy | 176.61 | 43 | 2.67% | -0.67% |
| CMG | Chipotle Mexican | | Services & Goods | 3129.52 | 48 | 0.76% | -0.70% |
| For chart view version of above stock list: Chart View ➞ 0 - 25 , 25 - 50 , 50 - 75 , 75 - 100 , 100 - 125 , 125 - 150 , 150 - 175 , 175 - 200 , 200 - 225 , 225 - 250 , 250 - 275 , 275 - 300 , 300 - 325 , 325 - 350 , 350 - 375 , 375 - 400 , 400 - 425 , 425 - 450 , 450 - 475 , 475 - 500 | ||
 | Click To Change The Sort Order: By Market Cap or Company Size Performance: Year-to-date, Week and Day |  |
|
Get the most comprehensive stock market coverage daily at 12Stocks.com ➞ Best Stocks Today ➞ Best Stocks Weekly ➞ Best Stocks Year-to-Date ➞ Best Stocks Trends ➞  Best Stocks Today 12Stocks.com Best Nasdaq Stocks ➞ Best S&P 500 Stocks ➞ Best Tech Stocks ➞ Best Biotech Stocks ➞ |
| Detailed Overview of S&P 500 Stocks |
| S&P 500 Technical Overview, Leaders & Laggards, Top S&P 500 ETF Funds & Detailed S&P 500 Stocks List, Charts, Trends & More |
| S&P 500: Technical Analysis, Trends & YTD Performance | |
| S&P 500 index as represented by
SPY, an exchange-traded fund [ETF], holds basket of five hundred (mostly largecap) stocks from across all major sectors of the US stock market. The S&P 500 index (contains stocks like Apple and Exxon) is up by 10.95% and is currently outperforming the overall market by 1.16% year-to-date. Below is a quick view of technical charts and trends: | |
 SPY Weekly Chart |
|
| Long Term Trend: Very Good | |
| Medium Term Trend: Very Good | |
 SPY Daily Chart |
|
| Short Term Trend: Not Good | |
| Overall Trend Score: 76 | |
| YTD Performance: 10.95% | |
| **Trend Scores & Views Are Only For Educational Purposes And Not For Investing | |
| 12Stocks.com: Investing in S&P 500 Index using Exchange Traded Funds | |
|
The following table shows list of key exchange traded funds (ETF) that
help investors track S&P 500 index. The following list also includes leveraged ETF funds that track twice or thrice the daily returns of S&P 500 indices. Short or inverse ETF funds move in the opposite direction to the index they track and are useful during market pullbacks or during bear markets. Quick View: Move mouse or cursor over ETF symbol (ticker) to view short-term technical chart and over ETF name to view long term chart. Click on ticker or stock name for detailed view. Click on to add stock symbol to your watchlist and to view watchlist. |
12Stocks.com List of ETFs that track S&P 500 Index
| Ticker | ETF Name | Watchlist | Recent Price | Smart Investing & Trading Score | Change % | Week % | Year-to-date % |
| SPY | SPDR S&P 500 ETF | | 527.37 | 76 | 0.91 | -0.39 | 10.95% |
| IVV | iShares Core S&P 500 ETF | | 529.96 | 76 | 0.88 | -0.41 | 10.96% |
| VOO | Vanguard 500 ETF | | 484.00 | 76 | 0.74 | -0.56 | 10.81% |
| OEF | iShares S&P 100 | | 252.25 | 68 | 0.66 | -0.47 | 12.92% |
| SSO | ProShares Ultra S&P500 | | 77.67 | 63 | 1.76 | -0.97 | 19.36% |
| UPRO | ProShares UltraPro S&P500 | | 70.17 | 68 | 2.63 | -1.46 | 28.19% |
| SPXL | Direxion Daily S&P500 Bull 3X ETF | | 133.30 | 68 | 2.55 | -1.43 | 28.19% |
| SH | ProShares Short S&P500 | | 11.94 | 25 | -0.75 | 0.59 | -8.08% |
| SDS | ProShares UltraShort S&P500 | | 24.91 | 32 | -1.70 | 1.01 | -16.74% |
| SPXU | ProShares UltraPro Short S&P500 | | 32.21 | 32 | -2.54 | 1.51 | -25.09% |
| SPXS | Direxion Daily S&P 500 Bear 3X ETF | | 8.72 | 32 | -2.46 | 1.4 | -24.5% |
| 12Stocks.com: Charts, Trends, Fundamental Data and Performances of S&P 500 Stocks | |
|
We now take in-depth look at all S&P 500 stocks including charts, multi-period performances and overall trends (as measured by Smart Investing & Trading Score). One can sort S&P 500 stocks (click link to choose) by Daily, Weekly and by Year-to-Date performances. Also, one can sort by size of the company or by market capitalization. |
| Select Your Default Chart Type: | |||||
| |||||
| Click on stock symbol or name for detailed view. Click on to add stock symbol to your watchlist and to view watchlist. Quick View: Move mouse or cursor over "Daily" to quickly view daily technical stock chart and over "Weekly" to view weekly technical stock chart. | |||||
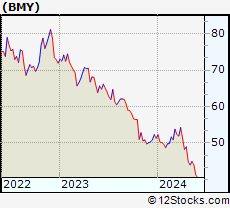 | BMY Bristol-Myers Squibb Company |
| Sector: Health Care | |
| SubSector: Drug Manufacturers - Major | |
| MarketCap: 117052 Millions | |
| Recent Price: 41.09 Smart Investing & Trading Score: 32 | |
| Day Percent Change: 2.09% Day Change: 0.84 | |
| Week Change: -0.36% Year-to-date Change: -19.9% | |
| BMY Links: Profile News Message Board | |
| Charts:- Daily , Weekly | |
| Add BMY to Watchlist: View: Get BMY Trend Analysis ➞ | |
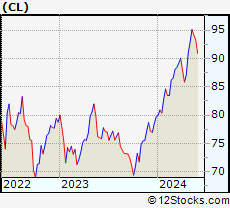 | CL Colgate-Palmolive Company |
| Sector: Consumer Staples | |
| SubSector: Personal Products | |
| MarketCap: 57242.7 Millions | |
| Recent Price: 92.96 Smart Investing & Trading Score: 68 | |
| Day Percent Change: 2.23% Day Change: 2.03 | |
| Week Change: -0.36% Year-to-date Change: 16.6% | |
| CL Links: Profile News Message Board | |
| Charts:- Daily , Weekly | |
| Add CL to Watchlist: View: Get CL Trend Analysis ➞ | |
 | SPY SPDR S&P 500 ETF |
| Sector: Utilities | |
| SubSector: Exchange Traded Fund | |
| MarketCap: 0 Millions | |
| Recent Price: 527.37 Smart Investing & Trading Score: 76 | |
| Day Percent Change: 0.91% Day Change: 4.76 | |
| Week Change: -0.39% Year-to-date Change: 11.0% | |
| SPY Links: Profile News Message Board | |
| Charts:- Daily , Weekly | |
| Add SPY to Watchlist: View: Get SPY Trend Analysis ➞ | |
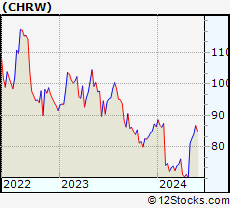 | CHRW C.H. Robinson Worldwide, Inc. |
| Sector: Transports | |
| SubSector: Air Delivery & Freight Services | |
| MarketCap: 9194.78 Millions | |
| Recent Price: 86.37 Smart Investing & Trading Score: 93 | |
| Day Percent Change: 1.74% Day Change: 1.48 | |
| Week Change: -0.4% Year-to-date Change: 0.0% | |
| CHRW Links: Profile News Message Board | |
| Charts:- Daily , Weekly | |
| Add CHRW to Watchlist: View: Get CHRW Trend Analysis ➞ | |
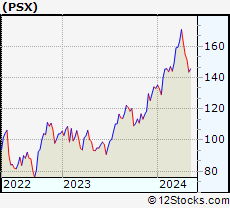 | PSX Phillips 66 |
| Sector: Energy | |
| SubSector: Oil & Gas Refining & Marketing | |
| MarketCap: 25253.6 Millions | |
| Recent Price: 142.11 Smart Investing & Trading Score: 38 | |
| Day Percent Change: 2.69% Day Change: 3.72 | |
| Week Change: -0.4% Year-to-date Change: 6.7% | |
| PSX Links: Profile News Message Board | |
| Charts:- Daily , Weekly | |
| Add PSX to Watchlist: View: Get PSX Trend Analysis ➞ | |
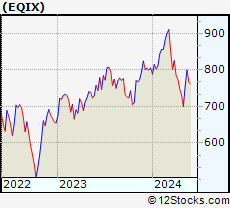 | EQIX Equinix, Inc. (REIT) |
| Sector: Financials | |
| SubSector: REIT - Diversified | |
| MarketCap: 45855.3 Millions | |
| Recent Price: 762.98 Smart Investing & Trading Score: 25 | |
| Day Percent Change: 0.31% Day Change: 2.35 | |
| Week Change: -0.41% Year-to-date Change: -5.3% | |
| EQIX Links: Profile News Message Board | |
| Charts:- Daily , Weekly | |
| Add EQIX to Watchlist: View: Get EQIX Trend Analysis ➞ | |
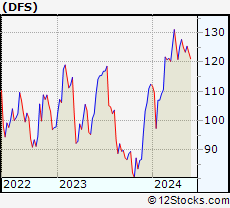 | DFS Discover Financial Services |
| Sector: Financials | |
| SubSector: Credit Services | |
| MarketCap: 9228.88 Millions | |
| Recent Price: 122.66 Smart Investing & Trading Score: 56 | |
| Day Percent Change: 1.28% Day Change: 1.55 | |
| Week Change: -0.45% Year-to-date Change: 9.1% | |
| DFS Links: Profile News Message Board | |
| Charts:- Daily , Weekly | |
| Add DFS to Watchlist: View: Get DFS Trend Analysis ➞ | |
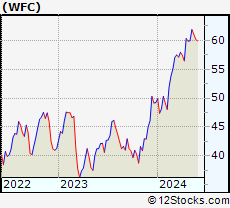 | WFC Wells Fargo & Company |
| Sector: Financials | |
| SubSector: Money Center Banks | |
| MarketCap: 129138 Millions | |
| Recent Price: 59.92 Smart Investing & Trading Score: 56 | |
| Day Percent Change: 1.20% Day Change: 0.71 | |
| Week Change: -0.48% Year-to-date Change: 21.7% | |
| WFC Links: Profile News Message Board | |
| Charts:- Daily , Weekly | |
| Add WFC to Watchlist: View: Get WFC Trend Analysis ➞ | |
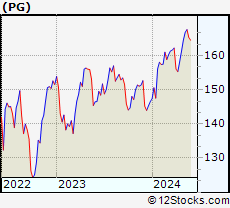 | PG The Procter & Gamble Company |
| Sector: Consumer Staples | |
| SubSector: Personal Products | |
| MarketCap: 277162 Millions | |
| Recent Price: 164.54 Smart Investing & Trading Score: 68 | |
| Day Percent Change: 1.21% Day Change: 1.96 | |
| Week Change: -0.48% Year-to-date Change: 12.3% | |
| PG Links: Profile News Message Board | |
| Charts:- Daily , Weekly | |
| Add PG to Watchlist: View: Get PG Trend Analysis ➞ | |
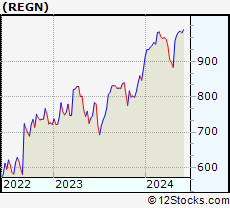 | REGN Regeneron Pharmaceuticals, Inc. |
| Sector: Health Care | |
| SubSector: Biotechnology | |
| MarketCap: 51903.7 Millions | |
| Recent Price: 980.16 Smart Investing & Trading Score: 86 | |
| Day Percent Change: 1.06% Day Change: 10.25 | |
| Week Change: -0.49% Year-to-date Change: 11.6% | |
| REGN Links: Profile News Message Board | |
| Charts:- Daily , Weekly | |
| Add REGN to Watchlist: View: Get REGN Trend Analysis ➞ | |
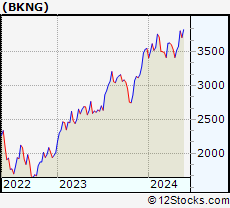 | BKNG Booking Holdings Inc. |
| Sector: Services & Goods | |
| SubSector: Business Services | |
| MarketCap: 54467.9 Millions | |
| Recent Price: 3776.35 Smart Investing & Trading Score: 78 | |
| Day Percent Change: 0.58% Day Change: 21.73 | |
| Week Change: -0.5% Year-to-date Change: 6.5% | |
| BKNG Links: Profile News Message Board | |
| Charts:- Daily , Weekly | |
| Add BKNG to Watchlist: View: Get BKNG Trend Analysis ➞ | |
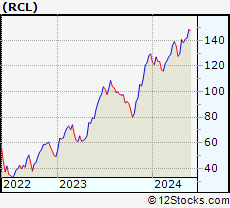 | RCL Royal Caribbean Cruises Ltd. |
| Sector: Services & Goods | |
| SubSector: Resorts & Casinos | |
| MarketCap: 7294.14 Millions | |
| Recent Price: 147.68 Smart Investing & Trading Score: 63 | |
| Day Percent Change: 0.13% Day Change: 0.19 | |
| Week Change: -0.51% Year-to-date Change: 14.1% | |
| RCL Links: Profile News Message Board | |
| Charts:- Daily , Weekly | |
| Add RCL to Watchlist: View: Get RCL Trend Analysis ➞ | |
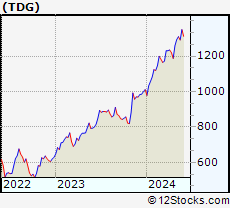 | TDG TransDigm Group Incorporated |
| Sector: Industrials | |
| SubSector: Aerospace/Defense Products & Services | |
| MarketCap: 18441 Millions | |
| Recent Price: 1343.23 Smart Investing & Trading Score: 100 | |
| Day Percent Change: 1.62% Day Change: 21.38 | |
| Week Change: -0.52% Year-to-date Change: 32.8% | |
| TDG Links: Profile News Message Board | |
| Charts:- Daily , Weekly | |
| Add TDG to Watchlist: View: Get TDG Trend Analysis ➞ | |
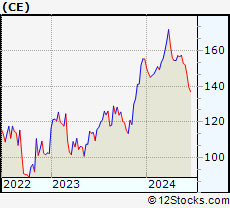 | CE Celanese Corporation |
| Sector: Materials | |
| SubSector: Chemicals - Major Diversified | |
| MarketCap: 8521.06 Millions | |
| Recent Price: 152.04 Smart Investing & Trading Score: 38 | |
| Day Percent Change: 0.48% Day Change: 0.72 | |
| Week Change: -0.54% Year-to-date Change: -2.1% | |
| CE Links: Profile News Message Board | |
| Charts:- Daily , Weekly | |
| Add CE to Watchlist: View: Get CE Trend Analysis ➞ | |
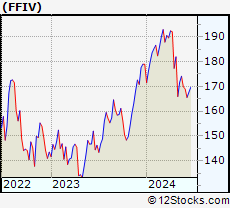 | FFIV F5 Networks, Inc. |
| Sector: Technology | |
| SubSector: Business Software & Services | |
| MarketCap: 6675.38 Millions | |
| Recent Price: 168.97 Smart Investing & Trading Score: 50 | |
| Day Percent Change: 1.00% Day Change: 1.67 | |
| Week Change: -0.55% Year-to-date Change: -5.6% | |
| FFIV Links: Profile News Message Board | |
| Charts:- Daily , Weekly | |
| Add FFIV to Watchlist: View: Get FFIV Trend Analysis ➞ | |
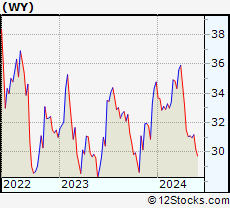 | WY Weyerhaeuser Company |
| Sector: Industrials | |
| SubSector: Lumber, Wood Production | |
| MarketCap: 13244.8 Millions | |
| Recent Price: 30.03 Smart Investing & Trading Score: 32 | |
| Day Percent Change: 1.04% Day Change: 0.31 | |
| Week Change: -0.56% Year-to-date Change: -13.6% | |
| WY Links: Profile News Message Board | |
| Charts:- Daily , Weekly | |
| Add WY to Watchlist: View: Get WY Trend Analysis ➞ | |
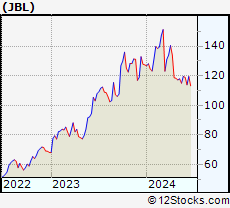 | JBL Jabil Inc. |
| Sector: Technology | |
| SubSector: Printed Circuit Boards | |
| MarketCap: 3272.15 Millions | |
| Recent Price: 118.90 Smart Investing & Trading Score: 45 | |
| Day Percent Change: -0.27% Day Change: -0.32 | |
| Week Change: -0.59% Year-to-date Change: -6.7% | |
| JBL Links: Profile News Message Board | |
| Charts:- Daily , Weekly | |
| Add JBL to Watchlist: View: Get JBL Trend Analysis ➞ | |
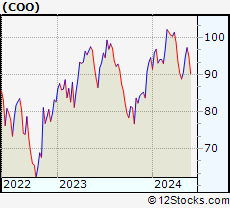 | COO The Cooper Companies, Inc. |
| Sector: Health Care | |
| SubSector: Medical Instruments & Supplies | |
| MarketCap: 15460 Millions | |
| Recent Price: 94.31 Smart Investing & Trading Score: 75 | |
| Day Percent Change: 4.52% Day Change: 4.08 | |
| Week Change: -0.61% Year-to-date Change: -0.3% | |
| COO Links: Profile News Message Board | |
| Charts:- Daily , Weekly | |
| Add COO to Watchlist: View: Get COO Trend Analysis ➞ | |
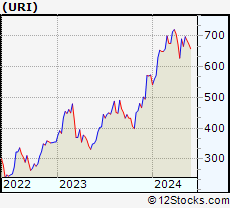 | URI United Rentals, Inc. |
| Sector: Transports | |
| SubSector: Rental & Leasing Services | |
| MarketCap: 6246.64 Millions | |
| Recent Price: 669.41 Smart Investing & Trading Score: 25 | |
| Day Percent Change: 1.54% Day Change: 10.18 | |
| Week Change: -0.61% Year-to-date Change: 16.7% | |
| URI Links: Profile News Message Board | |
| Charts:- Daily , Weekly | |
| Add URI to Watchlist: View: Get URI Trend Analysis ➞ | |
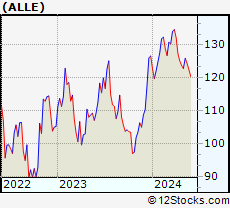 | ALLE Allegion plc |
| Sector: Services & Goods | |
| SubSector: Security & Protection Services | |
| MarketCap: 8515.93 Millions | |
| Recent Price: 121.82 Smart Investing & Trading Score: 32 | |
| Day Percent Change: 1.14% Day Change: 1.37 | |
| Week Change: -0.64% Year-to-date Change: -3.8% | |
| ALLE Links: Profile News Message Board | |
| Charts:- Daily , Weekly | |
| Add ALLE to Watchlist: View: Get ALLE Trend Analysis ➞ | |
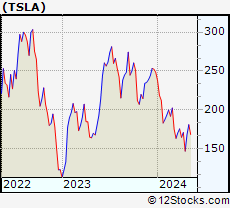 | TSLA Tesla, Inc. |
| Sector: Consumer Staples | |
| SubSector: Auto Manufacturers - Major | |
| MarketCap: 89058.8 Millions | |
| Recent Price: 178.08 Smart Investing & Trading Score: 57 | |
| Day Percent Change: -0.40% Day Change: -0.71 | |
| Week Change: -0.65% Year-to-date Change: -28.3% | |
| TSLA Links: Profile News Message Board | |
| Charts:- Daily , Weekly | |
| Add TSLA to Watchlist: View: Get TSLA Trend Analysis ➞ | |
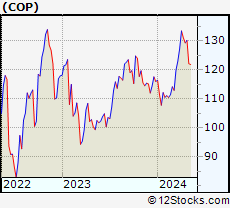 | COP ConocoPhillips |
| Sector: Energy | |
| SubSector: Independent Oil & Gas | |
| MarketCap: 33504.3 Millions | |
| Recent Price: 116.48 Smart Investing & Trading Score: 43 | |
| Day Percent Change: 2.55% Day Change: 2.90 | |
| Week Change: -0.66% Year-to-date Change: 0.4% | |
| COP Links: Profile News Message Board | |
| Charts:- Daily , Weekly | |
| Add COP to Watchlist: View: Get COP Trend Analysis ➞ | |
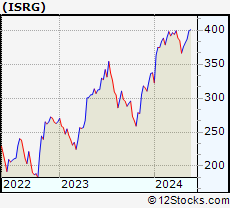 | ISRG Intuitive Surgical, Inc. |
| Sector: Health Care | |
| SubSector: Medical Instruments & Supplies | |
| MarketCap: 50917.5 Millions | |
| Recent Price: 402.12 Smart Investing & Trading Score: 71 | |
| Day Percent Change: -0.31% Day Change: -1.27 | |
| Week Change: -0.67% Year-to-date Change: 19.2% | |
| ISRG Links: Profile News Message Board | |
| Charts:- Daily , Weekly | |
| Add ISRG to Watchlist: View: Get ISRG Trend Analysis ➞ | |
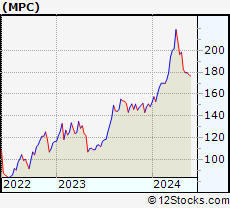 | MPC Marathon Petroleum Corporation |
| Sector: Energy | |
| SubSector: Oil & Gas Refining & Marketing | |
| MarketCap: 16862.4 Millions | |
| Recent Price: 176.61 Smart Investing & Trading Score: 43 | |
| Day Percent Change: 2.67% Day Change: 4.60 | |
| Week Change: -0.67% Year-to-date Change: 19.0% | |
| MPC Links: Profile News Message Board | |
| Charts:- Daily , Weekly | |
| Add MPC to Watchlist: View: Get MPC Trend Analysis ➞ | |
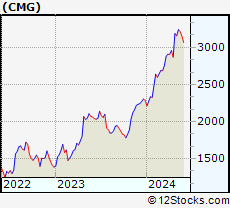 | CMG Chipotle Mexican Grill, Inc. |
| Sector: Services & Goods | |
| SubSector: Restaurants | |
| MarketCap: 16849.9 Millions | |
| Recent Price: 3129.52 Smart Investing & Trading Score: 48 | |
| Day Percent Change: 0.76% Day Change: 23.68 | |
| Week Change: -0.7% Year-to-date Change: 36.8% | |
| CMG Links: Profile News Message Board | |
| Charts:- Daily , Weekly | |
| Add CMG to Watchlist: View: Get CMG Trend Analysis ➞ | |
| For tabular summary view of above stock list: Summary View ➞ 0 - 25 , 25 - 50 , 50 - 75 , 75 - 100 , 100 - 125 , 125 - 150 , 150 - 175 , 175 - 200 , 200 - 225 , 225 - 250 , 250 - 275 , 275 - 300 , 300 - 325 , 325 - 350 , 350 - 375 , 375 - 400 , 400 - 425 , 425 - 450 , 450 - 475 , 475 - 500 | ||
| Click To Change The Sort Order: By Market Cap or Company Size Performance: Year-to-date, Week and Day | |
| Select Chart Type: | ||
|
Best Stocks Today 12Stocks.com |
© 2024 12Stocks.com Terms & Conditions Privacy Contact Us
All Information Provided Only For Education And Not To Be Used For Investing or Trading. See Terms & Conditions


One More Thing ... Get Best Stocks Delivered Daily!
Never Ever Miss A Move With Our Top Ten Stocks Lists
Find Best Stocks In Any Market - Bull or Bear Market
Take A Peek At Our Top Ten Stocks Lists: Daily, Weekly, Year-to-Date & Top Trends
Find Best Stocks In Any Market - Bull or Bear Market
Take A Peek At Our Top Ten Stocks Lists: Daily, Weekly, Year-to-Date & Top Trends
S&P 500 Stocks With Best Up Trends [0-bearish to 100-bullish]: Best Buy[100], Bank of America[100], AT&T [100], NetApp [100], Humana [100], Edison [100], Otis Worldwide[100], CenterPoint [100], Ventas [100], T-Mobile US[100], NextEra [100]
Best S&P 500 Stocks Year-to-Date:
NVIDIA [121.38%], Constellation [85.51%], First Solar[57.74%], NRG [56.67%], Micron [46.47%], Western Digital[43.77%], Moderna [43.34%], QUALCOMM [41.08%], Eli Lilly[40.73%], DaVita [40.44%], Eaton [38.22%] Best S&P 500 Stocks This Week:
Best Buy[18.63%], Marathon Oil[13.3%], HP [11.45%], Ralph Lauren[7.74%], V.F [7.62%], Universal Health[7.61%], Target [7.53%], Whirlpool [7.52%], CVS Health[7.31%], HCA Healthcare[6.6%], DaVita [6.19%] Best S&P 500 Stocks Daily:
Caesars Entertainment[11.65%], V.F [7.70%], salesforce.com [7.54%], Dollar General[7.01%], CVS Health[6.35%], Walgreens Boots[5.39%], Cooper [4.52%], Entergy [4.37%], Boston Properties[4.26%], MGM Resorts[4.26%], Target [4.20%]