
 Login Sign Up


| |||||
 |  | ||||

| 12Stocks.com Market Intelligence |
Best S&P 500 Stocks
|
On this page, you will find the most comprehensive analysis of S&P 500 stocks and ETFs - from latest trends to performances to charts ➞. First, here are the year-to-date (YTD) performances of the most requested S&P 500 stocks at 12Stocks.com (click stock for review):
| NVIDIA 121% | ||
| Walmart 25% | ||
| Google 23% | ||
| JPMorgan Chase 19% | ||
| Goldman Sachs 18% | ||
| Amazon.com 16% | ||
| Merck 15% | ||
| Caterpillar 14% | ||
| Microsoft 10% | ||
| Chevron 9% | ||
| Apple -0% | ||
| Johnson & Johnson -6% | ||
| McDonald s -13% | ||
| Starbucks -16% | ||
| Gilead -21% | ||
| Boeing -32% | ||
| Intel -39% | ||
| Quick: S&P 500 Stocks Lists: Performances & Trends, S&P 500 Stock Charts
Sort S&P 500 stocks: Daily, Weekly, Year-to-Date, Market Cap & Trends. Filter S&P 500 stocks list by sector: Show all, Tech, Finance, Energy, Staples, Retail, Industrial, Materials, Utilities and HealthCare |
| 12Stocks.com S&P 500 Stocks Performances & Trends Daily Report | |||||||||
|
| 
The overall Smart Investing & Trading Score is 76 (0-bearish to 100-bullish) which puts S&P 500 index in short term neutral to bullish trend. The Smart Investing & Trading Score from previous trading session is 56 and hence an improvement of trend. | ||||||||
Here are the Smart Investing & Trading Scores of the most requested S&P 500 stocks at 12Stocks.com (click stock name for detailed review):
|


| 12Stocks.com: Top Performing S&P 500 Index Stocks | ||||||||||||||||||||||||||||||||||||||||||||||||
 The top performing S&P 500 Index stocks year to date are
Now, more recently, over last week, the top performing S&P 500 Index stocks on the move are


|
||||||||||||||||||||||||||||||||||||||||||||||||
| 12Stocks.com: Investing in S&P 500 Index with Stocks | |
|
The following table helps investors and traders sort through current performance and trends (as measured by Smart Investing & Trading Score) of various
stocks in the S&P 500 Index. Quick View: Move mouse or cursor over stock symbol (ticker) to view short-term technical chart and over stock name to view long term chart. Click on  to add stock symbol to your watchlist and to add stock symbol to your watchlist and  to view watchlist. Click on any ticker or stock name for detailed market intelligence report for that stock. to view watchlist. Click on any ticker or stock name for detailed market intelligence report for that stock. |
12Stocks.com Performance of Stocks in S&P 500 Index
| Ticker | Stock Name | Watchlist | Category | Recent Price | Smart Investing & Trading Score | Change % | Weekly Change% |
| AXP | American Express |   | Financials | 240.00 | 83 | 1.17% | 0.76% |
| BAC | Bank of America | | Financials | 39.99 | 100 | 3.52% | 0.73% |
| SNA | Snap-on | | Industrials | 272.86 | 32 | 1.73% | 0.73% |
| LHX | L3Harris Technologies | | Technology | 224.83 | 93 | 2.58% | 0.71% |
| STZ | Constellation Brands | | Consumer Staples | 250.23 | 45 | 1.48% | 0.69% |
| GIS | General Mills | | Consumer Staples | 68.75 | 68 | 3.15% | 0.66% |
| ON | ON Semiconductor | | Technology | 73.04 | 52 | 1.29% | 0.66% |
| CBRE | CBRE | | Financials | 88.07 | 47 | 1.37% | 0.65% |
| LMT | Lockheed Martin | | Industrials | 470.34 | 90 | 2.04% | 0.64% |
| WDC | Western Digital | | Technology | 75.29 | 58 | -0.29% | 0.64% |
| MTB | M&T Bank | | Financials | 151.60 | 83 | 2.53% | 0.62% |
| ALGN | Align | | Health Care | 257.21 | 32 | 0.28% | 0.62% |
| WMT | Walmart | | Services & Goods | 65.76 | 90 | 1.34% | 0.58% |
| IRM | Iron Mountain | | Technology | 80.69 | 73 | 1.32% | 0.57% |
| BAX | Baxter | | Health Care | 34.09 | 25 | 1.97% | 0.56% |
| KMX | CarMax | | Services & Goods | 70.26 | 50 | 0.88% | 0.54% |
| SWKS | Skyworks Solutions | | Technology | 92.66 | 50 | 2.18% | 0.54% |
| PSA | Public Storage | | Financials | 273.83 | 67 | 2.08% | 0.53% |
| ARE | Alexandria Real | | Financials | 119.00 | 42 | 2.32% | 0.51% |
| CHD | Church & Dwight Co | | Consumer Staples | 107.01 | 71 | 2.54% | 0.51% |
| IVZ | Invesco | | Financials | 15.71 | 93 | 2.28% | 0.51% |
| AJG | Arthur J. | | Financials | 253.33 | 93 | 1.70% | 0.50% |
| DGX | Quest Diagnostics | | Health Care | 141.97 | 88 | 1.89% | 0.49% |
| VRSK | Verisk Analytics | | Services & Goods | 252.78 | 93 | 1.37% | 0.48% |
| MMM | 3M | | Industrials | 100.14 | 88 | 1.98% | 0.47% |
| For chart view version of above stock list: Chart View ➞ 0 - 25 , 25 - 50 , 50 - 75 , 75 - 100 , 100 - 125 , 125 - 150 , 150 - 175 , 175 - 200 , 200 - 225 , 225 - 250 , 250 - 275 , 275 - 300 , 300 - 325 , 325 - 350 , 350 - 375 , 375 - 400 , 400 - 425 , 425 - 450 , 450 - 475 , 475 - 500 | ||
 | Click To Change The Sort Order: By Market Cap or Company Size Performance: Year-to-date, Week and Day |  |
|
Get the most comprehensive stock market coverage daily at 12Stocks.com ➞ Best Stocks Today ➞ Best Stocks Weekly ➞ Best Stocks Year-to-Date ➞ Best Stocks Trends ➞  Best Stocks Today 12Stocks.com Best Nasdaq Stocks ➞ Best S&P 500 Stocks ➞ Best Tech Stocks ➞ Best Biotech Stocks ➞ |
| Detailed Overview of S&P 500 Stocks |
| S&P 500 Technical Overview, Leaders & Laggards, Top S&P 500 ETF Funds & Detailed S&P 500 Stocks List, Charts, Trends & More |
| S&P 500: Technical Analysis, Trends & YTD Performance | |
| S&P 500 index as represented by
SPY, an exchange-traded fund [ETF], holds basket of five hundred (mostly largecap) stocks from across all major sectors of the US stock market. The S&P 500 index (contains stocks like Apple and Exxon) is up by 10.95% and is currently outperforming the overall market by 1.16% year-to-date. Below is a quick view of technical charts and trends: | |
 SPY Weekly Chart |
|
| Long Term Trend: Very Good | |
| Medium Term Trend: Very Good | |
 SPY Daily Chart |
|
| Short Term Trend: Not Good | |
| Overall Trend Score: 76 | |
| YTD Performance: 10.95% | |
| **Trend Scores & Views Are Only For Educational Purposes And Not For Investing | |
| 12Stocks.com: Investing in S&P 500 Index using Exchange Traded Funds | |
|
The following table shows list of key exchange traded funds (ETF) that
help investors track S&P 500 index. The following list also includes leveraged ETF funds that track twice or thrice the daily returns of S&P 500 indices. Short or inverse ETF funds move in the opposite direction to the index they track and are useful during market pullbacks or during bear markets. Quick View: Move mouse or cursor over ETF symbol (ticker) to view short-term technical chart and over ETF name to view long term chart. Click on ticker or stock name for detailed view. Click on to add stock symbol to your watchlist and to view watchlist. |
12Stocks.com List of ETFs that track S&P 500 Index
| Ticker | ETF Name | Watchlist | Recent Price | Smart Investing & Trading Score | Change % | Week % | Year-to-date % |
| SPY | SPDR S&P 500 ETF | | 527.37 | 76 | 0.91 | -0.39 | 10.95% |
| IVV | iShares Core S&P 500 ETF | | 529.96 | 76 | 0.88 | -0.41 | 10.96% |
| VOO | Vanguard 500 ETF | | 484.00 | 76 | 0.74 | -0.56 | 10.81% |
| OEF | iShares S&P 100 | | 252.25 | 68 | 0.66 | -0.47 | 12.92% |
| SSO | ProShares Ultra S&P500 | | 77.67 | 63 | 1.76 | -0.97 | 19.36% |
| UPRO | ProShares UltraPro S&P500 | | 70.17 | 68 | 2.63 | -1.46 | 28.19% |
| SPXL | Direxion Daily S&P500 Bull 3X ETF | | 133.30 | 68 | 2.55 | -1.43 | 28.19% |
| SH | ProShares Short S&P500 | | 11.94 | 25 | -0.75 | 0.59 | -8.08% |
| SDS | ProShares UltraShort S&P500 | | 24.91 | 32 | -1.70 | 1.01 | -16.74% |
| SPXU | ProShares UltraPro Short S&P500 | | 32.21 | 32 | -2.54 | 1.51 | -25.09% |
| SPXS | Direxion Daily S&P 500 Bear 3X ETF | | 8.72 | 32 | -2.46 | 1.4 | -24.5% |
| 12Stocks.com: Charts, Trends, Fundamental Data and Performances of S&P 500 Stocks | |
|
We now take in-depth look at all S&P 500 stocks including charts, multi-period performances and overall trends (as measured by Smart Investing & Trading Score). One can sort S&P 500 stocks (click link to choose) by Daily, Weekly and by Year-to-Date performances. Also, one can sort by size of the company or by market capitalization. |
| Select Your Default Chart Type: | |||||
| |||||
| Click on stock symbol or name for detailed view. Click on to add stock symbol to your watchlist and to view watchlist. Quick View: Move mouse or cursor over "Daily" to quickly view daily technical stock chart and over "Weekly" to view weekly technical stock chart. | |||||

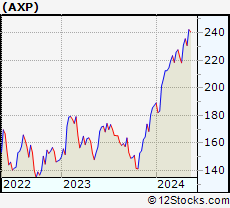 | AXP American Express Company |
| Sector: Financials | |
| SubSector: Credit Services | |
| MarketCap: 68388 Millions | |
| Recent Price: 240.00 Smart Investing & Trading Score: 83 | |
| Day Percent Change: 1.17% Day Change: 2.78 | |
| Week Change: 0.76% Year-to-date Change: 28.1% | |
| AXP Links: Profile News Message Board | |
| Charts:- Daily , Weekly | |
| Add AXP to Watchlist: View: Get AXP Trend Analysis ➞ | |
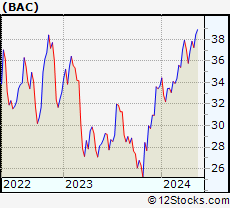 | BAC Bank of America Corporation |
| Sector: Financials | |
| SubSector: Money Center Banks | |
| MarketCap: 189690 Millions | |
| Recent Price: 39.99 Smart Investing & Trading Score: 100 | |
| Day Percent Change: 3.52% Day Change: 1.36 | |
| Week Change: 0.73% Year-to-date Change: 18.8% | |
| BAC Links: Profile News Message Board | |
| Charts:- Daily , Weekly | |
| Add BAC to Watchlist: View: Get BAC Trend Analysis ➞ | |
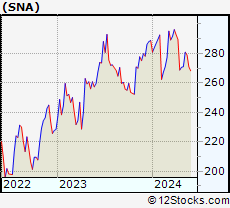 | SNA Snap-on Incorporated |
| Sector: Industrials | |
| SubSector: Small Tools & Accessories | |
| MarketCap: 5947.26 Millions | |
| Recent Price: 272.86 Smart Investing & Trading Score: 32 | |
| Day Percent Change: 1.73% Day Change: 4.63 | |
| Week Change: 0.73% Year-to-date Change: -5.5% | |
| SNA Links: Profile News Message Board | |
| Charts:- Daily , Weekly | |
| Add SNA to Watchlist: View: Get SNA Trend Analysis ➞ | |
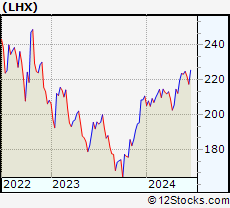 | LHX L3Harris Technologies, Inc. |
| Sector: Technology | |
| SubSector: Communication Equipment | |
| MarketCap: 37906.1 Millions | |
| Recent Price: 224.83 Smart Investing & Trading Score: 93 | |
| Day Percent Change: 2.58% Day Change: 5.66 | |
| Week Change: 0.71% Year-to-date Change: 6.8% | |
| LHX Links: Profile News Message Board | |
| Charts:- Daily , Weekly | |
| Add LHX to Watchlist: View: Get LHX Trend Analysis ➞ | |
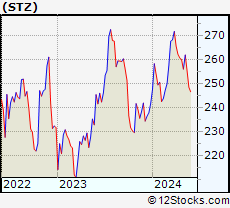 | STZ Constellation Brands, Inc. |
| Sector: Consumer Staples | |
| SubSector: Beverages - Wineries & Distillers | |
| MarketCap: 27394.5 Millions | |
| Recent Price: 250.23 Smart Investing & Trading Score: 45 | |
| Day Percent Change: 1.48% Day Change: 3.64 | |
| Week Change: 0.69% Year-to-date Change: 3.5% | |
| STZ Links: Profile News Message Board | |
| Charts:- Daily , Weekly | |
| Add STZ to Watchlist: View: Get STZ Trend Analysis ➞ | |
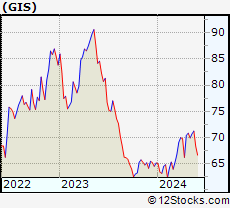 | GIS General Mills, Inc. |
| Sector: Consumer Staples | |
| SubSector: Processed & Packaged Goods | |
| MarketCap: 34131.7 Millions | |
| Recent Price: 68.75 Smart Investing & Trading Score: 68 | |
| Day Percent Change: 3.15% Day Change: 2.10 | |
| Week Change: 0.66% Year-to-date Change: 5.5% | |
| GIS Links: Profile News Message Board | |
| Charts:- Daily , Weekly | |
| Add GIS to Watchlist: View: Get GIS Trend Analysis ➞ | |
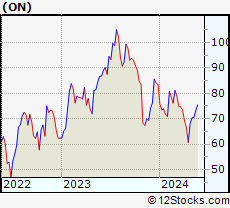 | ON ON Semiconductor Corporation |
| Sector: Technology | |
| SubSector: Semiconductor - Broad Line | |
| MarketCap: 5183.82 Millions | |
| Recent Price: 73.04 Smart Investing & Trading Score: 52 | |
| Day Percent Change: 1.29% Day Change: 0.93 | |
| Week Change: 0.66% Year-to-date Change: -12.6% | |
| ON Links: Profile News Message Board | |
| Charts:- Daily , Weekly | |
| Add ON to Watchlist: View: Get ON Trend Analysis ➞ | |
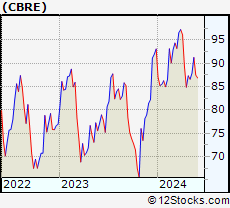 | CBRE CBRE Group, Inc. |
| Sector: Financials | |
| SubSector: Property Management | |
| MarketCap: 12799.2 Millions | |
| Recent Price: 88.07 Smart Investing & Trading Score: 47 | |
| Day Percent Change: 1.37% Day Change: 1.19 | |
| Week Change: 0.65% Year-to-date Change: -5.4% | |
| CBRE Links: Profile News Message Board | |
| Charts:- Daily , Weekly | |
| Add CBRE to Watchlist: View: Get CBRE Trend Analysis ➞ | |
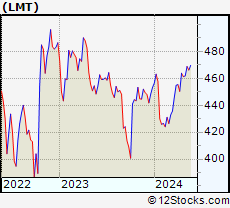 | LMT Lockheed Martin Corporation |
| Sector: Industrials | |
| SubSector: Aerospace/Defense Products & Services | |
| MarketCap: 94116.4 Millions | |
| Recent Price: 470.34 Smart Investing & Trading Score: 90 | |
| Day Percent Change: 2.04% Day Change: 9.40 | |
| Week Change: 0.64% Year-to-date Change: 3.8% | |
| LMT Links: Profile News Message Board | |
| Charts:- Daily , Weekly | |
| Add LMT to Watchlist: View: Get LMT Trend Analysis ➞ | |
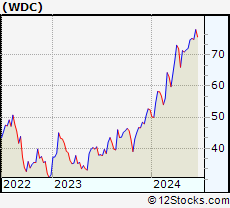 | WDC Western Digital Corporation |
| Sector: Technology | |
| SubSector: Data Storage Devices | |
| MarketCap: 10712.9 Millions | |
| Recent Price: 75.29 Smart Investing & Trading Score: 58 | |
| Day Percent Change: -0.29% Day Change: -0.22 | |
| Week Change: 0.64% Year-to-date Change: 43.8% | |
| WDC Links: Profile News Message Board | |
| Charts:- Daily , Weekly | |
| Add WDC to Watchlist: View: Get WDC Trend Analysis ➞ | |
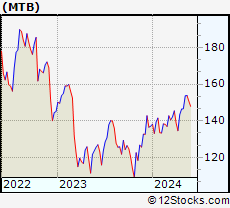 | MTB M&T Bank Corporation |
| Sector: Financials | |
| SubSector: Regional - Northeast Banks | |
| MarketCap: 13950.9 Millions | |
| Recent Price: 151.60 Smart Investing & Trading Score: 83 | |
| Day Percent Change: 2.53% Day Change: 3.74 | |
| Week Change: 0.62% Year-to-date Change: 10.6% | |
| MTB Links: Profile News Message Board | |
| Charts:- Daily , Weekly | |
| Add MTB to Watchlist: View: Get MTB Trend Analysis ➞ | |
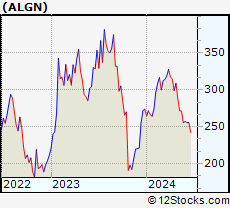 | ALGN Align Technology, Inc. |
| Sector: Health Care | |
| SubSector: Medical Appliances & Equipment | |
| MarketCap: 12802 Millions | |
| Recent Price: 257.21 Smart Investing & Trading Score: 32 | |
| Day Percent Change: 0.28% Day Change: 0.71 | |
| Week Change: 0.62% Year-to-date Change: -6.1% | |
| ALGN Links: Profile News Message Board | |
| Charts:- Daily , Weekly | |
| Add ALGN to Watchlist: View: Get ALGN Trend Analysis ➞ | |
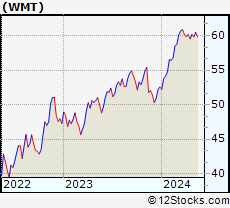 | WMT Walmart Inc. |
| Sector: Services & Goods | |
| SubSector: Discount, Variety Stores | |
| MarketCap: 355610 Millions | |
| Recent Price: 65.76 Smart Investing & Trading Score: 90 | |
| Day Percent Change: 1.34% Day Change: 0.87 | |
| Week Change: 0.58% Year-to-date Change: 25.1% | |
| WMT Links: Profile News Message Board | |
| Charts:- Daily , Weekly | |
| Add WMT to Watchlist: View: Get WMT Trend Analysis ➞ | |
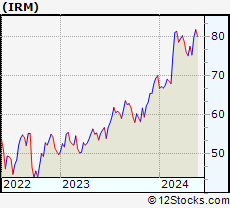 | IRM Iron Mountain Incorporated |
| Sector: Technology | |
| SubSector: Business Software & Services | |
| MarketCap: 7339.18 Millions | |
| Recent Price: 80.69 Smart Investing & Trading Score: 73 | |
| Day Percent Change: 1.32% Day Change: 1.05 | |
| Week Change: 0.57% Year-to-date Change: 15.3% | |
| IRM Links: Profile News Message Board | |
| Charts:- Daily , Weekly | |
| Add IRM to Watchlist: View: Get IRM Trend Analysis ➞ | |
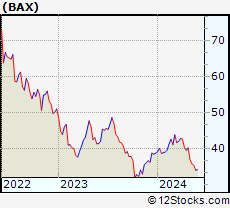 | BAX Baxter International Inc. |
| Sector: Health Care | |
| SubSector: Medical Instruments & Supplies | |
| MarketCap: 39955.8 Millions | |
| Recent Price: 34.09 Smart Investing & Trading Score: 25 | |
| Day Percent Change: 1.97% Day Change: 0.66 | |
| Week Change: 0.56% Year-to-date Change: -11.8% | |
| BAX Links: Profile News Message Board | |
| Charts:- Daily , Weekly | |
| Add BAX to Watchlist: View: Get BAX Trend Analysis ➞ | |
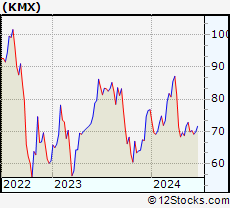 | KMX CarMax, Inc. |
| Sector: Services & Goods | |
| SubSector: Auto Dealerships | |
| MarketCap: 8121.71 Millions | |
| Recent Price: 70.26 Smart Investing & Trading Score: 50 | |
| Day Percent Change: 0.88% Day Change: 0.61 | |
| Week Change: 0.54% Year-to-date Change: -8.4% | |
| KMX Links: Profile News Message Board | |
| Charts:- Daily , Weekly | |
| Add KMX to Watchlist: View: Get KMX Trend Analysis ➞ | |
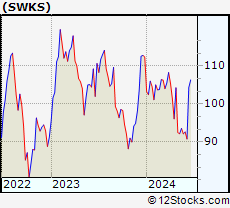 | SWKS Skyworks Solutions, Inc. |
| Sector: Technology | |
| SubSector: Semiconductor - Integrated Circuits | |
| MarketCap: 13981 Millions | |
| Recent Price: 92.66 Smart Investing & Trading Score: 50 | |
| Day Percent Change: 2.18% Day Change: 1.98 | |
| Week Change: 0.54% Year-to-date Change: -17.6% | |
| SWKS Links: Profile News Message Board | |
| Charts:- Daily , Weekly | |
| Add SWKS to Watchlist: View: Get SWKS Trend Analysis ➞ | |
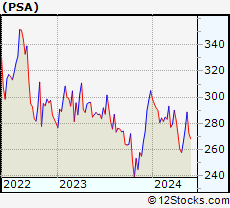 | PSA Public Storage |
| Sector: Financials | |
| SubSector: REIT - Industrial | |
| MarketCap: 32733.9 Millions | |
| Recent Price: 273.83 Smart Investing & Trading Score: 67 | |
| Day Percent Change: 2.08% Day Change: 5.59 | |
| Week Change: 0.53% Year-to-date Change: -10.2% | |
| PSA Links: Profile News Message Board | |
| Charts:- Daily , Weekly | |
| Add PSA to Watchlist: View: Get PSA Trend Analysis ➞ | |
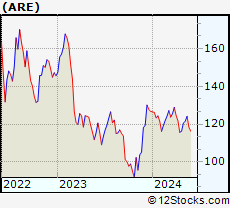 | ARE Alexandria Real Estate Equities, Inc. |
| Sector: Financials | |
| SubSector: REIT - Office | |
| MarketCap: 16793.6 Millions | |
| Recent Price: 119.00 Smart Investing & Trading Score: 42 | |
| Day Percent Change: 2.32% Day Change: 2.70 | |
| Week Change: 0.51% Year-to-date Change: -6.1% | |
| ARE Links: Profile News Message Board | |
| Charts:- Daily , Weekly | |
| Add ARE to Watchlist: View: Get ARE Trend Analysis ➞ | |
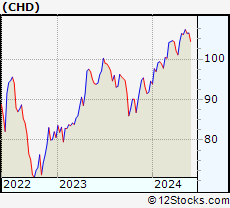 | CHD Church & Dwight Co., Inc. |
| Sector: Consumer Staples | |
| SubSector: Cleaning Products | |
| MarketCap: 17425.7 Millions | |
| Recent Price: 107.01 Smart Investing & Trading Score: 71 | |
| Day Percent Change: 2.54% Day Change: 2.65 | |
| Week Change: 0.51% Year-to-date Change: 13.2% | |
| CHD Links: Profile News Message Board | |
| Charts:- Daily , Weekly | |
| Add CHD to Watchlist: View: Get CHD Trend Analysis ➞ | |
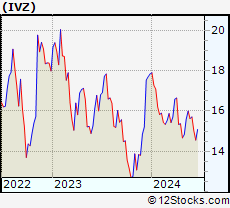 | IVZ Invesco Ltd. |
| Sector: Financials | |
| SubSector: Asset Management | |
| MarketCap: 4578.23 Millions | |
| Recent Price: 15.71 Smart Investing & Trading Score: 93 | |
| Day Percent Change: 2.28% Day Change: 0.35 | |
| Week Change: 0.51% Year-to-date Change: -11.9% | |
| IVZ Links: Profile News Message Board | |
| Charts:- Daily , Weekly | |
| Add IVZ to Watchlist: View: Get IVZ Trend Analysis ➞ | |
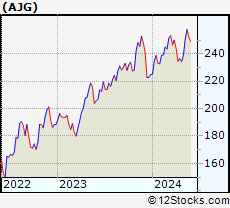 | AJG Arthur J. Gallagher & Co. |
| Sector: Financials | |
| SubSector: Insurance Brokers | |
| MarketCap: 14852.2 Millions | |
| Recent Price: 253.33 Smart Investing & Trading Score: 93 | |
| Day Percent Change: 1.70% Day Change: 4.24 | |
| Week Change: 0.5% Year-to-date Change: 12.7% | |
| AJG Links: Profile News Message Board | |
| Charts:- Daily , Weekly | |
| Add AJG to Watchlist: View: Get AJG Trend Analysis ➞ | |
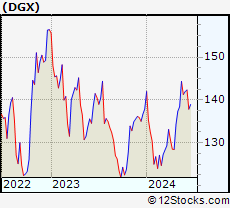 | DGX Quest Diagnostics Incorporated |
| Sector: Health Care | |
| SubSector: Medical Laboratories & Research | |
| MarketCap: 11076.1 Millions | |
| Recent Price: 141.97 Smart Investing & Trading Score: 88 | |
| Day Percent Change: 1.89% Day Change: 2.64 | |
| Week Change: 0.49% Year-to-date Change: 3.0% | |
| DGX Links: Profile News Message Board | |
| Charts:- Daily , Weekly | |
| Add DGX to Watchlist: View: Get DGX Trend Analysis ➞ | |
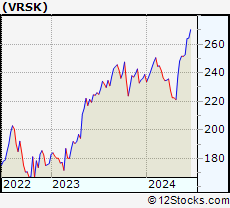 | VRSK Verisk Analytics, Inc. |
| Sector: Services & Goods | |
| SubSector: Business Services | |
| MarketCap: 22033.2 Millions | |
| Recent Price: 252.78 Smart Investing & Trading Score: 93 | |
| Day Percent Change: 1.37% Day Change: 3.41 | |
| Week Change: 0.48% Year-to-date Change: 5.8% | |
| VRSK Links: Profile News Message Board | |
| Charts:- Daily , Weekly | |
| Add VRSK to Watchlist: View: Get VRSK Trend Analysis ➞ | |
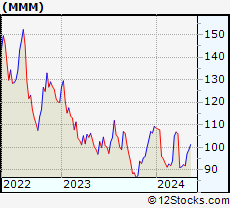 | MMM 3M Company |
| Sector: Industrials | |
| SubSector: Diversified Machinery | |
| MarketCap: 79237.7 Millions | |
| Recent Price: 100.14 Smart Investing & Trading Score: 88 | |
| Day Percent Change: 1.98% Day Change: 1.94 | |
| Week Change: 0.47% Year-to-date Change: -8.4% | |
| MMM Links: Profile News Message Board | |
| Charts:- Daily , Weekly | |
| Add MMM to Watchlist: View: Get MMM Trend Analysis ➞ | |
| For tabular summary view of above stock list: Summary View ➞ 0 - 25 , 25 - 50 , 50 - 75 , 75 - 100 , 100 - 125 , 125 - 150 , 150 - 175 , 175 - 200 , 200 - 225 , 225 - 250 , 250 - 275 , 275 - 300 , 300 - 325 , 325 - 350 , 350 - 375 , 375 - 400 , 400 - 425 , 425 - 450 , 450 - 475 , 475 - 500 | ||
| Click To Change The Sort Order: By Market Cap or Company Size Performance: Year-to-date, Week and Day | |
| Select Chart Type: | ||
|
Best Stocks Today 12Stocks.com |
© 2024 12Stocks.com Terms & Conditions Privacy Contact Us
All Information Provided Only For Education And Not To Be Used For Investing or Trading. See Terms & Conditions


One More Thing ... Get Best Stocks Delivered Daily!
Never Ever Miss A Move With Our Top Ten Stocks Lists
Find Best Stocks In Any Market - Bull or Bear Market
Take A Peek At Our Top Ten Stocks Lists: Daily, Weekly, Year-to-Date & Top Trends
Find Best Stocks In Any Market - Bull or Bear Market
Take A Peek At Our Top Ten Stocks Lists: Daily, Weekly, Year-to-Date & Top Trends
S&P 500 Stocks With Best Up Trends [0-bearish to 100-bullish]: Best Buy[100], Bank of America[100], AT&T [100], NetApp [100], Humana [100], Edison [100], Otis Worldwide[100], CenterPoint [100], Ventas [100], T-Mobile US[100], NextEra [100]
Best S&P 500 Stocks Year-to-Date:
NVIDIA [121.38%], Constellation [85.51%], First Solar[57.74%], NRG [56.67%], Micron [46.47%], Western Digital[43.77%], Moderna [43.34%], QUALCOMM [41.08%], Eli Lilly[40.73%], DaVita [40.44%], Eaton [38.22%] Best S&P 500 Stocks This Week:
Best Buy[18.63%], Marathon Oil[13.3%], HP [11.45%], Ralph Lauren[7.74%], V.F [7.62%], Universal Health[7.61%], Target [7.53%], Whirlpool [7.52%], CVS Health[7.31%], HCA Healthcare[6.6%], DaVita [6.19%] Best S&P 500 Stocks Daily:
Caesars Entertainment[11.65%], V.F [7.70%], salesforce.com [7.54%], Dollar General[7.01%], CVS Health[6.35%], Walgreens Boots[5.39%], Cooper [4.52%], Entergy [4.37%], Boston Properties[4.26%], MGM Resorts[4.26%], Target [4.20%]