
 Login Sign Up


| |||||
 |  | ||||

| 12Stocks.com Market Intelligence |
Best MidCap Stocks
|
| In a hurry? Mid Cap Stocks Lists: Performance Trends Table, Stock Charts
Sort midcap stocks: Daily, Weekly, Year-to-Date, Market Cap & Trends. Filter midcap stocks list by sector: Show all, Tech, Finance, Energy, Staples, Retail, Industrial, Materials, Utilities and HealthCare Filter midcap stocks list by size:All MidCap Large Mid-Range Small |
| 12Stocks.com Mid Cap Stocks Performances & Trends Daily | |||||||||
|
|  The overall Smart Investing & Trading Score is 83 (0-bearish to 100-bullish) which puts Mid Cap index in short term bullish trend. The Smart Investing & Trading Score from previous trading session is 56 and hence an improvement of trend.
| ||||||||
Here are the Smart Investing & Trading Scores of the most requested mid cap stocks at 12Stocks.com (click stock name for detailed review):
|


| 12Stocks.com: Top Performing Mid Cap Index Stocks | ||||||||||||||||||||||||||||||||||||||||||||||||
 The top performing Mid Cap Index stocks year to date are
Now, more recently, over last week, the top performing Mid Cap Index stocks on the move are


|
||||||||||||||||||||||||||||||||||||||||||||||||
| 12Stocks.com: Investing in Midcap Index with Stocks | |
|
The following table helps investors and traders sort through current performance and trends (as measured by Smart Investing & Trading Score) of various
stocks in the Midcap Index. Quick View: Move mouse or cursor over stock symbol (ticker) to view short-term technical chart and over stock name to view long term chart. Click on  to add stock symbol to your watchlist and to add stock symbol to your watchlist and  to view watchlist. Click on any ticker or stock name for detailed market intelligence report for that stock. to view watchlist. Click on any ticker or stock name for detailed market intelligence report for that stock. |
12Stocks.com Performance of Stocks in Midcap Index
| Ticker | Stock Name | Watchlist | Category | Recent Price | Smart Investing & Trading Score | Change % | YTD Change% |
| LEA | Lear |   | Consumer Staples | 125.35 | 25 | 1.22% | -11.23% |
| FTV | Fortive | | Technology | 74.44 | 25 | 1.17% | 1.10% |
| H | Hyatt Hotels | | Services & Goods | 147.47 | 25 | 1.16% | 13.08% |
| PAG | Penske Automotive | | Services & Goods | 152.10 | 25 | 1.09% | -5.24% |
| MSM | MSC Industrial | | Services & Goods | 85.90 | 25 | 1.08% | -15.17% |
| VVV | Valvoline | | Energy | 40.60 | 25 | 1.07% | 8.04% |
| DOX | Amdocs | | Technology | 79.00 | 25 | 0.92% | -10.11% |
| MLM | Martin Marietta | | Industrials | 572.08 | 25 | 0.87% | 14.67% |
| VMC | Vulcan Materials | | Industrials | 255.77 | 25 | 0.67% | 12.67% |
| ROK | Rockwell Automation | | Industrials | 257.53 | 25 | 0.14% | -17.05% |
| CFR | Cullen/Frost Bankers | | Financials | 101.58 | 25 | 0.03% | -6.37% |
| XP | XP | | Financials | 18.99 | 25 | -0.37% | -27.16% |
| JAZZ | Jazz | | Health Care | 105.25 | 25 | -0.20% | -14.43% |
| DBX | Dropbox | | Technology | 22.53 | 20 | 0.85% | -23.58% |
| HST | Host Hotels | | Financials | 17.94 | 20 | 0.73% | -7.86% |
| GLOB | Globant S.A | | Technology | 161.12 | 20 | 0.46% | -32.30% |
| VAC | Marriott Vacations | | Services & Goods | 90.27 | 20 | -1.57% | 6.34% |
| TDOC | Teladoc Health | | Technology | 11.24 | 20 | -0.44% | -47.84% |
| PINC | Premier | | Technology | 18.92 | 20 | -0.11% | -15.38% |
| WU | Western Union | | Financials | 12.80 | 18 | 0.63% | 7.38% |
| TREX | Trex | | Industrials | 86.48 | 18 | 0.62% | 4.46% |
| LYFT | Lyft | | Technology | 15.61 | 18 | -0.95% | 4.14% |
| EXP | Eagle Materials | | Industrials | 232.39 | 18 | -0.49% | 14.57% |
| RPRX | Royalty Pharma | | Health Care | 27.40 | 17 | 3.91% | -2.46% |
| MOH | Molina | | Health Care | 314.58 | 17 | 2.79% | -12.93% |
| For chart view version of above stock list: Chart View ➞ 0 - 25 , 25 - 50 , 50 - 75 , 75 - 100 , 100 - 125 , 125 - 150 , 150 - 175 , 175 - 200 , 200 - 225 , 225 - 250 , 250 - 275 , 275 - 300 , 300 - 325 , 325 - 350 , 350 - 375 , 375 - 400 , 400 - 425 , 425 - 450 , 450 - 475 , 475 - 500 , 500 - 525 , 525 - 550 , 550 - 575 , 575 - 600 , 600 - 625 , 625 - 650 , 650 - 675 , 675 - 700 , 700 - 725 , 725 - 750 , 750 - 775 | ||
 | Click To Change The Sort Order: By Market Cap or Company Size Performance: Year-to-date, Week and Day |  |
|
Get the most comprehensive stock market coverage daily at 12Stocks.com ➞ Best Stocks Today ➞ Best Stocks Weekly ➞ Best Stocks Year-to-Date ➞ Best Stocks Trends ➞  Best Stocks Today 12Stocks.com Best Nasdaq Stocks ➞ Best S&P 500 Stocks ➞ Best Tech Stocks ➞ Best Biotech Stocks ➞ |
| Detailed Overview of Midcap Stocks |
| Midcap Technical Overview, Leaders & Laggards, Top Midcap ETF Funds & Detailed Midcap Stocks List, Charts, Trends & More |
| Midcap: Technical Analysis, Trends & YTD Performance | |
| MidCap segment as represented by
MDY, an exchange-traded fund [ETF], holds basket of about four hundred midcap stocks from across all major sectors of the US stock market. The midcap index (contains stocks like Green Mountain Coffee Roasters and Tractor Supply Company) is up by 7.65% and is currently underperforming the overall market by -2.14% year-to-date. Below is a quick view of technical charts and trends: | |
 MDY Weekly Chart |
|
| Long Term Trend: Very Good | |
| Medium Term Trend: Good | |
 MDY Daily Chart |
|
| Short Term Trend: Very Good | |
| Overall Trend Score: 83 | |
| YTD Performance: 7.65% | |
| **Trend Scores & Views Are Only For Educational Purposes And Not For Investing | |
| 12Stocks.com: Investing in Midcap Index using Exchange Traded Funds | |
|
The following table shows list of key exchange traded funds (ETF) that
help investors track Midcap index. The following list also includes leveraged ETF funds that track twice or thrice the daily returns of Midcap indices. Short or inverse ETF funds move in the opposite direction to the index they track and are useful during market pullbacks or during bear markets. Quick View: Move mouse or cursor over ETF symbol (ticker) to view short-term technical chart and over ETF name to view long term chart. Click on ticker or stock name for detailed view. Click on to add stock symbol to your watchlist and to view watchlist. |
12Stocks.com List of ETFs that track Midcap Index
| Ticker | ETF Name | Watchlist | Recent Price | Smart Investing & Trading Score | Change % | Week % | Year-to-date % |
| IJH | iShares Core S&P Mid-Cap | | 59.68 | 83 | 1.31 | 0.27 | 7.67% |
| MDY | SPDR S&P MidCap 400 ETF | | 546.18 | 83 | 1.32 | 0.29 | 7.65% |
| IWR | iShares Russell Mid-Cap | | 81.91 | 71 | 0.91 | -0.65 | 5.38% |
| IWP | iShares Russell Mid-Cap Growth | | 108.67 | 8 | 0.21 | -2.18 | 4.03% |
| IWS | iShares Russell Mid-Cap Value | | 123.18 | 83 | 1.27 | -0.02 | 5.92% |
| IJK | iShares S&P Mid-Cap 400 Growth | | 88.41 | 46 | -0.32 | -1.5 | 11.6% |
| UMDD | ProShares UltraPro MidCap400 | | 25.80 | 83 | 3.74 | 0.49 | 15.59% |
| IJJ | iShares S&P Mid-Cap 400 Value | | 114.94 | 63 | 0.45 | -0.39 | 0.79% |
| MYY | ProShares Short MidCap400 | | 20.24 | 25 | -1.20 | -0.26 | -5.64% |
| SMDD | ProShares UltraPro Short MidCap400 | | 10.84 | 17 | -3.99 | -0.66 | -19.49% |
| XMLV | PowerShares S&P MidCap Low Volatil ETF | | 55.65 | 61 | 0.67 | -0.47 | 4.64% |
| MVV | ProShares Ultra MidCap400 | | 63.30 | 63 | 0.08 | -2.01 | 9.35% |
| MZZ | ProShares UltraShort MidCap400 | | 11.08 | 27 | -2.35 | -0.36 | -11.83% |
| 12Stocks.com: Charts, Trends, Fundamental Data and Performances of MidCap Stocks | |
|
We now take in-depth look at all MidCap stocks including charts, multi-period performances and overall trends (as measured by Smart Investing & Trading Score). One can sort MidCap stocks (click link to choose) by Daily, Weekly and by Year-to-Date performances. Also, one can sort by size of the company or by market capitalization. |
| Select Your Default Chart Type: | |||||
| |||||
| Click on stock symbol or name for detailed view. Click on to add stock symbol to your watchlist and to view watchlist. Quick View: Move mouse or cursor over "Daily" to quickly view daily technical stock chart and over "Weekly" to view weekly technical stock chart. | |||||

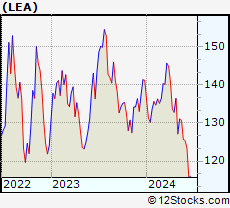 | LEA Lear Corporation |
| Sector: Consumer Staples | |
| SubSector: Auto Parts | |
| MarketCap: 5106.09 Millions | |
| Recent Price: 125.35 Smart Investing & Trading Score: 25 | |
| Day Percent Change: 1.22% Day Change: 1.51 | |
| Week Change: -0.29% Year-to-date Change: -11.2% | |
| LEA Links: Profile News Message Board | |
| Charts:- Daily , Weekly | |
| Add LEA to Watchlist: View: Get Complete LEA Trend Analysis ➞ | |
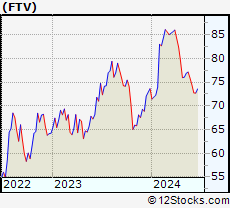 | FTV Fortive Corporation |
| Sector: Technology | |
| SubSector: Scientific & Technical Instruments | |
| MarketCap: 16351.9 Millions | |
| Recent Price: 74.44 Smart Investing & Trading Score: 25 | |
| Day Percent Change: 1.17% Day Change: 0.86 | |
| Week Change: -1.91% Year-to-date Change: 1.1% | |
| FTV Links: Profile News Message Board | |
| Charts:- Daily , Weekly | |
| Add FTV to Watchlist: View: Get Complete FTV Trend Analysis ➞ | |
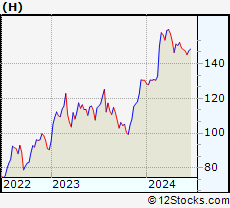 | H Hyatt Hotels Corporation |
| Sector: Services & Goods | |
| SubSector: Lodging | |
| MarketCap: 5525.56 Millions | |
| Recent Price: 147.47 Smart Investing & Trading Score: 25 | |
| Day Percent Change: 1.16% Day Change: 1.69 | |
| Week Change: -0.41% Year-to-date Change: 13.1% | |
| H Links: Profile News Message Board | |
| Charts:- Daily , Weekly | |
| Add H to Watchlist: View: Get Complete H Trend Analysis ➞ | |
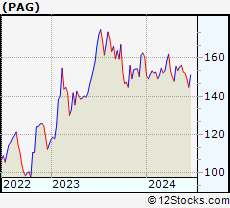 | PAG Penske Automotive Group, Inc. |
| Sector: Services & Goods | |
| SubSector: Auto Dealerships | |
| MarketCap: 2088.81 Millions | |
| Recent Price: 152.10 Smart Investing & Trading Score: 25 | |
| Day Percent Change: 1.09% Day Change: 1.64 | |
| Week Change: -0.39% Year-to-date Change: -5.2% | |
| PAG Links: Profile News Message Board | |
| Charts:- Daily , Weekly | |
| Add PAG to Watchlist: View: Get Complete PAG Trend Analysis ➞ | |
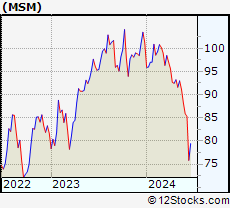 | MSM MSC Industrial Direct Co., Inc. |
| Sector: Services & Goods | |
| SubSector: Industrial Equipment Wholesale | |
| MarketCap: 2701.88 Millions | |
| Recent Price: 85.90 Smart Investing & Trading Score: 25 | |
| Day Percent Change: 1.08% Day Change: 0.92 | |
| Week Change: -2.77% Year-to-date Change: -15.2% | |
| MSM Links: Profile News Message Board | |
| Charts:- Daily , Weekly | |
| Add MSM to Watchlist: View: Get Complete MSM Trend Analysis ➞ | |
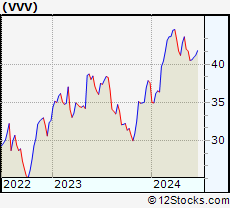 | VVV Valvoline Inc. |
| Sector: Energy | |
| SubSector: Oil & Gas Refining & Marketing | |
| MarketCap: 2225.94 Millions | |
| Recent Price: 40.60 Smart Investing & Trading Score: 25 | |
| Day Percent Change: 1.07% Day Change: 0.43 | |
| Week Change: 0.17% Year-to-date Change: 8.0% | |
| VVV Links: Profile News Message Board | |
| Charts:- Daily , Weekly | |
| Add VVV to Watchlist: View: Get Complete VVV Trend Analysis ➞ | |
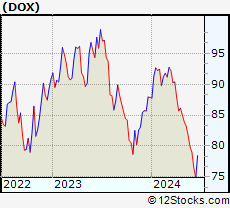 | DOX Amdocs Limited |
| Sector: Technology | |
| SubSector: Business Software & Services | |
| MarketCap: 6895.48 Millions | |
| Recent Price: 79.00 Smart Investing & Trading Score: 25 | |
| Day Percent Change: 0.92% Day Change: 0.72 | |
| Week Change: -1.14% Year-to-date Change: -10.1% | |
| DOX Links: Profile News Message Board | |
| Charts:- Daily , Weekly | |
| Add DOX to Watchlist: View: Get Complete DOX Trend Analysis ➞ | |
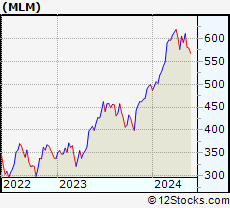 | MLM Martin Marietta Materials, Inc. |
| Sector: Industrials | |
| SubSector: General Building Materials | |
| MarketCap: 10624.3 Millions | |
| Recent Price: 572.08 Smart Investing & Trading Score: 25 | |
| Day Percent Change: 0.87% Day Change: 4.95 | |
| Week Change: -1.22% Year-to-date Change: 14.7% | |
| MLM Links: Profile News Message Board | |
| Charts:- Daily , Weekly | |
| Add MLM to Watchlist: View: Get Complete MLM Trend Analysis ➞ | |
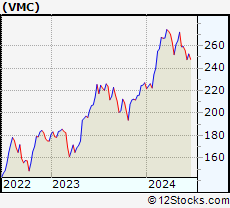 | VMC Vulcan Materials Company |
| Sector: Industrials | |
| SubSector: General Building Materials | |
| MarketCap: 12304.7 Millions | |
| Recent Price: 255.77 Smart Investing & Trading Score: 25 | |
| Day Percent Change: 0.67% Day Change: 1.69 | |
| Week Change: -1.34% Year-to-date Change: 12.7% | |
| VMC Links: Profile News Message Board | |
| Charts:- Daily , Weekly | |
| Add VMC to Watchlist: View: Get Complete VMC Trend Analysis ➞ | |
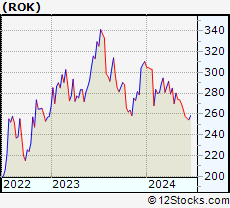 | ROK Rockwell Automation, Inc. |
| Sector: Industrials | |
| SubSector: Diversified Machinery | |
| MarketCap: 15666.1 Millions | |
| Recent Price: 257.53 Smart Investing & Trading Score: 25 | |
| Day Percent Change: 0.14% Day Change: 0.35 | |
| Week Change: -2.52% Year-to-date Change: -17.1% | |
| ROK Links: Profile News Message Board | |
| Charts:- Daily , Weekly | |
| Add ROK to Watchlist: View: Get Complete ROK Trend Analysis ➞ | |
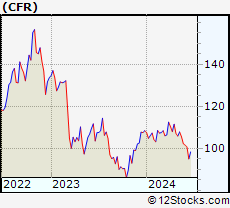 | CFR Cullen/Frost Bankers, Inc. |
| Sector: Financials | |
| SubSector: Regional - Southwest Banks | |
| MarketCap: 3536.75 Millions | |
| Recent Price: 101.58 Smart Investing & Trading Score: 25 | |
| Day Percent Change: 0.03% Day Change: 0.03 | |
| Week Change: -0.71% Year-to-date Change: -6.4% | |
| CFR Links: Profile News Message Board | |
| Charts:- Daily , Weekly | |
| Add CFR to Watchlist: View: Get Complete CFR Trend Analysis ➞ | |
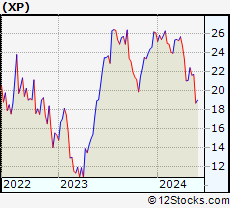 | XP XP Inc. |
| Sector: Financials | |
| SubSector: Asset Management | |
| MarketCap: 12990.3 Millions | |
| Recent Price: 18.99 Smart Investing & Trading Score: 25 | |
| Day Percent Change: -0.37% Day Change: -0.07 | |
| Week Change: 1.66% Year-to-date Change: -27.2% | |
| XP Links: Profile News Message Board | |
| Charts:- Daily , Weekly | |
| Add XP to Watchlist: View: Get Complete XP Trend Analysis ➞ | |
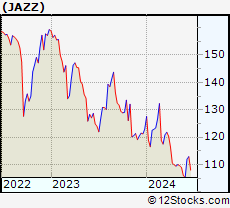 | JAZZ Jazz Pharmaceuticals plc |
| Sector: Health Care | |
| SubSector: Biotechnology | |
| MarketCap: 5576.05 Millions | |
| Recent Price: 105.25 Smart Investing & Trading Score: 25 | |
| Day Percent Change: -0.20% Day Change: -0.21 | |
| Week Change: -0.76% Year-to-date Change: -14.4% | |
| JAZZ Links: Profile News Message Board | |
| Charts:- Daily , Weekly | |
| Add JAZZ to Watchlist: View: Get Complete JAZZ Trend Analysis ➞ | |
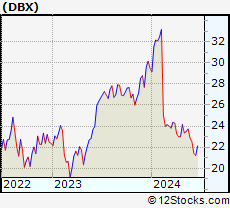 | DBX Dropbox, Inc. |
| Sector: Technology | |
| SubSector: Application Software | |
| MarketCap: 7588.32 Millions | |
| Recent Price: 22.53 Smart Investing & Trading Score: 20 | |
| Day Percent Change: 0.85% Day Change: 0.19 | |
| Week Change: -1.57% Year-to-date Change: -23.6% | |
| DBX Links: Profile News Message Board | |
| Charts:- Daily , Weekly | |
| Add DBX to Watchlist: View: Get Complete DBX Trend Analysis ➞ | |
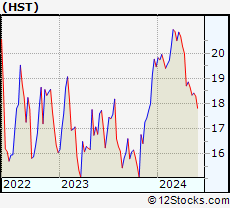 | HST Host Hotels & Resorts, Inc. |
| Sector: Financials | |
| SubSector: REIT - Hotel/Motel | |
| MarketCap: 8253.74 Millions | |
| Recent Price: 17.94 Smart Investing & Trading Score: 20 | |
| Day Percent Change: 0.73% Day Change: 0.13 | |
| Week Change: -1.97% Year-to-date Change: -7.9% | |
| HST Links: Profile News Message Board | |
| Charts:- Daily , Weekly | |
| Add HST to Watchlist: View: Get Complete HST Trend Analysis ➞ | |
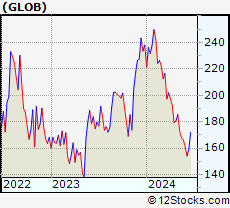 | GLOB Globant S.A. |
| Sector: Technology | |
| SubSector: Information Technology Services | |
| MarketCap: 2976.88 Millions | |
| Recent Price: 161.12 Smart Investing & Trading Score: 20 | |
| Day Percent Change: 0.46% Day Change: 0.74 | |
| Week Change: -3.23% Year-to-date Change: -32.3% | |
| GLOB Links: Profile News Message Board | |
| Charts:- Daily , Weekly | |
| Add GLOB to Watchlist: View: Get Complete GLOB Trend Analysis ➞ | |
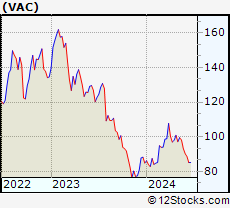 | VAC Marriott Vacations Worldwide Corporation |
| Sector: Services & Goods | |
| SubSector: Resorts & Casinos | |
| MarketCap: 2173.54 Millions | |
| Recent Price: 90.27 Smart Investing & Trading Score: 20 | |
| Day Percent Change: -1.57% Day Change: -1.44 | |
| Week Change: -3.19% Year-to-date Change: 6.3% | |
| VAC Links: Profile News Message Board | |
| Charts:- Daily , Weekly | |
| Add VAC to Watchlist: View: Get Complete VAC Trend Analysis ➞ | |
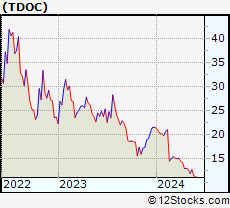 | TDOC Teladoc Health, Inc. |
| Sector: Technology | |
| SubSector: Healthcare Information Services | |
| MarketCap: 11968.5 Millions | |
| Recent Price: 11.24 Smart Investing & Trading Score: 20 | |
| Day Percent Change: -0.44% Day Change: -0.05 | |
| Week Change: -2.09% Year-to-date Change: -47.8% | |
| TDOC Links: Profile News Message Board | |
| Charts:- Daily , Weekly | |
| Add TDOC to Watchlist: View: Get Complete TDOC Trend Analysis ➞ | |
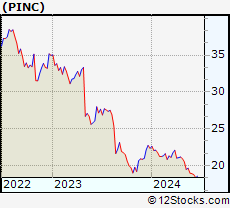 | PINC Premier, Inc. |
| Sector: Technology | |
| SubSector: Healthcare Information Services | |
| MarketCap: 2044.85 Millions | |
| Recent Price: 18.92 Smart Investing & Trading Score: 20 | |
| Day Percent Change: -0.11% Day Change: -0.02 | |
| Week Change: -0.37% Year-to-date Change: -15.4% | |
| PINC Links: Profile News Message Board | |
| Charts:- Daily , Weekly | |
| Add PINC to Watchlist: View: Get Complete PINC Trend Analysis ➞ | |
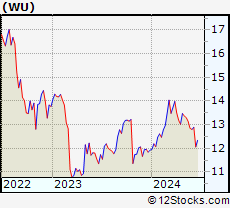 | WU The Western Union Company |
| Sector: Financials | |
| SubSector: Credit Services | |
| MarketCap: 7974.48 Millions | |
| Recent Price: 12.80 Smart Investing & Trading Score: 18 | |
| Day Percent Change: 0.63% Day Change: 0.08 | |
| Week Change: -0.39% Year-to-date Change: 7.4% | |
| WU Links: Profile News Message Board | |
| Charts:- Daily , Weekly | |
| Add WU to Watchlist: View: Get Complete WU Trend Analysis ➞ | |
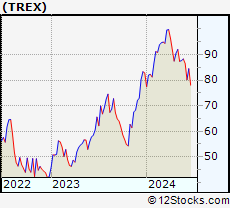 | TREX Trex Company, Inc. |
| Sector: Industrials | |
| SubSector: General Building Materials | |
| MarketCap: 4369.23 Millions | |
| Recent Price: 86.48 Smart Investing & Trading Score: 18 | |
| Day Percent Change: 0.62% Day Change: 0.53 | |
| Week Change: -2.06% Year-to-date Change: 4.5% | |
| TREX Links: Profile News Message Board | |
| Charts:- Daily , Weekly | |
| Add TREX to Watchlist: View: Get Complete TREX Trend Analysis ➞ | |
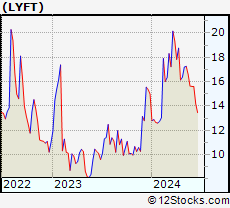 | LYFT Lyft, Inc. |
| Sector: Technology | |
| SubSector: Application Software | |
| MarketCap: 7923.22 Millions | |
| Recent Price: 15.61 Smart Investing & Trading Score: 18 | |
| Day Percent Change: -0.95% Day Change: -0.15 | |
| Week Change: -0.19% Year-to-date Change: 4.1% | |
| LYFT Links: Profile News Message Board | |
| Charts:- Daily , Weekly | |
| Add LYFT to Watchlist: View: Get Complete LYFT Trend Analysis ➞ | |
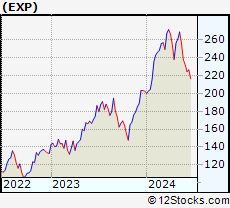 | EXP Eagle Materials Inc. |
| Sector: Industrials | |
| SubSector: Cement | |
| MarketCap: 2234.73 Millions | |
| Recent Price: 232.39 Smart Investing & Trading Score: 18 | |
| Day Percent Change: -0.49% Day Change: -1.14 | |
| Week Change: -2.47% Year-to-date Change: 14.6% | |
| EXP Links: Profile News Message Board | |
| Charts:- Daily , Weekly | |
| Add EXP to Watchlist: View: Get Complete EXP Trend Analysis ➞ | |
 | RPRX Royalty Pharma plc |
| Sector: Health Care | |
| SubSector: Biotechnology | |
| MarketCap: 28457 Millions | |
| Recent Price: 27.40 Smart Investing & Trading Score: 17 | |
| Day Percent Change: 3.91% Day Change: 1.03 | |
| Week Change: 2.93% Year-to-date Change: -2.5% | |
| RPRX Links: Profile News Message Board | |
| Charts:- Daily , Weekly | |
| Add RPRX to Watchlist: View: Get Complete RPRX Trend Analysis ➞ | |
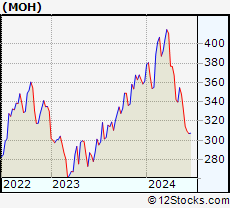 | MOH Molina Healthcare, Inc. |
| Sector: Health Care | |
| SubSector: Health Care Plans | |
| MarketCap: 7235.6 Millions | |
| Recent Price: 314.58 Smart Investing & Trading Score: 17 | |
| Day Percent Change: 2.79% Day Change: 8.54 | |
| Week Change: -5.28% Year-to-date Change: -12.9% | |
| MOH Links: Profile News Message Board | |
| Charts:- Daily , Weekly | |
| Add MOH to Watchlist: View: Get Complete MOH Trend Analysis ➞ | |
| For tabular summary view of above stock list: Summary View ➞ 0 - 25 , 25 - 50 , 50 - 75 , 75 - 100 , 100 - 125 , 125 - 150 , 150 - 175 , 175 - 200 , 200 - 225 , 225 - 250 , 250 - 275 , 275 - 300 , 300 - 325 , 325 - 350 , 350 - 375 , 375 - 400 , 400 - 425 , 425 - 450 , 450 - 475 , 475 - 500 , 500 - 525 , 525 - 550 , 550 - 575 , 575 - 600 , 600 - 625 , 625 - 650 , 650 - 675 , 675 - 700 , 700 - 725 , 725 - 750 , 750 - 775 | ||
| Click To Change The Sort Order: By Market Cap or Company Size Performance: Year-to-date, Week and Day | |
| Select Chart Type: | ||
|
Best Stocks Today 12Stocks.com |
© 2024 12Stocks.com Terms & Conditions Privacy Contact Us
All Information Provided Only For Education And Not To Be Used For Investing or Trading. See Terms & Conditions


One More Thing ... Get Best Stocks Delivered Daily!
Never Ever Miss A Move With Our Top Ten Stocks Lists
Find Best Stocks In Any Market - Bull or Bear Market
Take A Peek At Our Top Ten Stocks Lists: Daily, Weekly, Year-to-Date & Top Trends
Find Best Stocks In Any Market - Bull or Bear Market
Take A Peek At Our Top Ten Stocks Lists: Daily, Weekly, Year-to-Date & Top Trends
Midcap Stocks With Best Up Trends [0-bearish to 100-bullish]: Gap [100], Boston Beer[100], Nordstrom [100], Best Buy[100], NetApp [100], HEICO [100], Edison [100], Otis Worldwide[100], Clearway Energy[100], CenterPoint Energy[100], Ventas [100]
Best Midcap Stocks Year-to-Date:
Vistra Energy[157.22%], CAVA [112.86%], AppLovin [104.75%], Constellation Energy[85.51%], EMCOR [80.41%], Tenet [78.93%], ShockWave Medical[75.67%], Tandem Diabetes[73.23%], Natera [70.07%], Pure Storage[69.07%], Crocs [66.62%] Best Midcap Stocks This Week:
Gap [38.04%], GameStop [21.79%], Boston Beer[20.3%], DICK S[19.83%], Burlington Stores[19.8%], Best Buy[18.63%], Peloton Interactive[15.56%], Olaplex [13.38%], Marathon Oil[13.3%], CAVA [11.6%], HP [11.45%] Best Midcap Stocks Daily:
Gap [28.60%], Boston Beer[22.33%], Penn National[19.62%], Elastic N.V[11.67%], Caesars Entertainment[11.65%], Olaplex [9.88%], Zscaler [8.50%], V.F [7.70%], Medical Properties[7.20%], Kohl s[6.52%], Victorias Secret[5.56%]